


Abstract
There is increasing evidence for Müllerian-inhibiting substance (MIS)/anti-Müllerian hormone (AMH) physiologic activity in the human uterus, so it is relevant to study how MIS/AMH levels impact pregnancy.
To investigate the association of MIS/AMH levels with the risk of adverse obstetric outcomes.
Retrospective cohort study.
Academic fertility center.
Women who became pregnant through in vitro fertilization between January 2012 and October 2016. Exclusion criteria were: oocyte donation, gestational carrier, multiple gestations, miscarriage before 20 weeks, or medically indicated preterm deliveries.
None.
There were two primary outcomes, preterm birth and cesarean delivery for arrest of labor. Because MIS/AMH level is highly skewed by certain infertility diagnoses, the preterm birth analysis was stratified by polycystic ovary syndrome (PCOS) diagnosis, and the cesarean delivery for arrest of labor analysis was stratified by diminished ovarian reserve diagnosis. χ2, Mann-Whitney, and t tests were used as appropriate. A P value of <0.05 was considered statistically significant.
Among women with PCOS, those who delivered prematurely had substantially higher MIS/AMH levels (18 vs 6.4 ng/mL, P = 0.003) than did those who delivered at term. At the highest MIS/AMH values, preterm deliveries predominated; above the 90th percentile in women with PCOS, all deliveries were premature. No effect of MIS/AMH level was observed in women without PCOS. We found no association between MIS/AMH values and cesarean delivery for labor arrest.
In women with PCOS, substantially elevated MIS/AMH levels are significantly associated with preterm birth, suggesting closer follow-up and further studies to elucidate the underlying mechanisms.
Abnormalities of parturition are common and have serious medical and economic consequences. Preterm birth, defined as delivery prior to 37 weeks, affects ∼10% of pregnancies in the United States and is the leading cause of infant death and disability in developed countries (1). Thus, interventions to reduce the rates and complications of prematurity are of great interest to researchers globally (2). Most preterm births are spontaneous, attributable to preterm labor or preterm premature rupture of membranes, with <30% resulting from maternal or fetal indications (3). The strongest risk for preterm birth is history of prior preterm birth (4). Other risk factors include infections, smoking, low body mass index (BMI), congenital uterine malformations, low socioeconomic status, black race, substance abuse, and multifetal gestation (5–8).
The high rate of births by cesarean delivery has also caused public health concerns. One-third of births in the United States are by cesarean delivery, and >50% of these are for labor complications, namely arrest of dilatation or descent (9, 10). There are ongoing efforts to redefine normal labor parameters to prevent unnecessary cesarean deliveries (11–15). However, it would also be beneficial to be able to identify women at high risk of arrest, such that a prelabor cesarean delivery could be recommended to minimize morbidity associated with prolonged or arrested labor (16).
Markers that predict adverse obstetric outcomes for patient risk stratification are needed. In addition to enabling us to identify individuals at risk, this knowledge may allow insight into the underlying etiologies of preterm birth and labor arrest and direct specific interventions for these adverse outcomes (5). There is growing literature on markers for preterm birth, from fetal fibronectin to inflammatory cytokines, serum proteomics, and genomic pathways (17–24). However, none has yet proven to be a clear positive predictor of preterm birth that can effectively be applied in the clinical setting. No such markers exist for prediction of labor arrest.
Müllerian-inhibiting substance (MIS), also known as anti-Müllerian hormone (AMH), was first identified as the factor responsible for Müllerian duct regression during male embryonic development (25). Subsequent studies discovered its production in the female ovary by primary and early secondary follicles as well as its regulatory role in the activation and selection of follicles during folliculogenesis (26–28). Its clinical applications as a marker of ovarian reserve and predictor of response to infertility treatments have proven invaluable in the field of assisted reproductive technology (29–33).
Expression of the MIS type 2 receptor (MISR2), also known as AMH receptor type 2, in the uterine mesenchyme is well established in animal models (34–37), and there are evolving human data with the identification of MISR2 to solidify a role for MIS/AMH in the adult uterus (38, 39).
These insights led us to suspect a probable uterine effect of MIS/AMH and to investigate its effects in pregnancy, with the hypothesis that extreme levels of maternal serum MIS/AMH can result in adverse obstetric outcomes. We sought to determine whether (1) high MIS/AMH levels would be associated with increased risk of spontaneous preterm delivery and (2) low MIS/AMH levels would be associated with increased risk of cesarean delivery for arrest of labor.
Methods
After approval by the Partners HealthCare Institutional Review Board, a retrospective chart review was conducted of all consecutive in vitro fertilization (IVF) cycles at the Massachusetts General Hospital Fertility Center between January 2012 and October 2016. Demographic and clinical information was collected from the electronic medical record (Epic, Epic Systems, Verona, WI). Data included maternal age, BMI, race, marital status, MIS/AMH level measured within 1 year prior to initiating IVF, prior uterine or cervical surgery, diabetes mellitus, Society for Assisted Reproductive Technology (SART) infertility diagnoses [anovulation, diminished ovarian reserve (DOR), endometriosis, genetic, idiopathic, male factor, polycystic ovary syndrome (PCOS), and tubal abnormalities], type of IVF cycle (fresh or frozen embryo transfer), gestational age at delivery, mode of delivery, indication for cesarean delivery when applicable, and birth weight of the fetus. Women were diagnosed with PCOS using Rotterdam criteria, which require that two of the three following criteria are met: oligo-ovulation/anovulation, clinical or biochemical evidence of hyperandrogenism, and polycystic ovaries on ultrasound (40). All patients with PCOS underwent laboratory testing, and 14% demonstrated evidence of hyperandrogenemia, as measured by elevated serum total testosterone.
Exclusion criteria were as follows: cycles that did not result in pregnancy, cycles that used donor oocyte or gestational carrier, multifetal gestations, patients who did not have an MIS/AMH serum level, pregnancies resulting in loss prior to 20 weeks, and pregnancies for which delivery information was not available. For IVF cycles, our standard protocols for controlled ovarian hyperstimulation and for frozen embryo transfer were previously described (41, 42). The number of embryos for transfer was determined by the guidelines established by the American Society of Reproductive Medicine guidelines (43).
Pregnancies were classified as term, if delivery occurred ≥37 weeks of gestational age, or preterm, at <37 weeks. Medically indicated preterm deliveries were excluded from the analysis. Term deliveries were further divided into vaginal deliveries and cesarean deliveries. Cesarean deliveries were classified for arrest of labor when the operative report indicated failure to progress, arrest of dilation, or arrest of descent, whereas the nonarrest deliveries included the following indications: nonreassuring fetal status, prior uterine surgery, malpresentation, abnormal placentation, maternal complications, and elective or repeat cesarean.
Primary outcomes of interest were gestational age at delivery and cesarean delivery for arrest of labor. Because the exposure variable of serum MIS/AMH levels is highly skewed by two infertility diagnoses, with the highest MIS/AMH levels likely to be found in those with PCOS (44–48) and the lowest levels in those with DOR (49–51), we performed two separate stratified analyses by these diagnoses for the respective outcomes of interest. The first examined the association between MIS/AMH levels and preterm vs term deliveries, and the second examined the association between MIS/AMH levels and term cesarean deliveries for arrest of labor vs term normal deliveries (including both vaginal and cesarean deliveries for other indications). χ2, Mann-Whitney, and t tests were used as appropriate. A P value of <0.05 was considered statistically significant.
During the study period, serum MIS/AMH levels were determined by the Ansh Labs (Webster, TX) Ultra-Sensitive AMH ELISA, which is a quantitative three-step sandwich immunoassay (package insert: Ansh Labs Ultra-Sensitive AMH/MIS; document AL-105; revision no. 04). Samples were sent to the Mayo Clinic Department of Laboratory Medicine and Pathology (Rochester, MN). The test was developed and its performance characteristics were determined by the Mayo Clinic, consistent with Clinical Laboratory Improvement Amendments requirements.
Results
Between January 2012 and October 2016, there were 4451 IVF cycles initiated at the Massachusetts General Hospital Fertility Center, resulting in 1806 pregnancies. After applying exclusion criteria, 432 pregnancies were included in the analysis (Fig. 1).
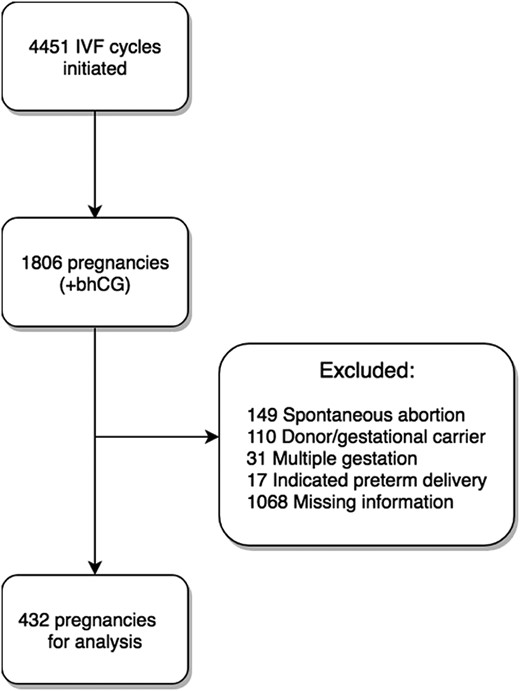
Flowchart of analysis.
Demographic information for these 432 women is detailed in Table 1. Within the entire cohort, those who delivered prematurely were younger (mean age, 33.7 vs 34.9 years, P = 0.025) and more overweight (mean BMI, 26.6 vs 24.0, P < 0.001) than those who delivered at term, but they did not differ by other demographic factors, including marital status, ethnicity, gravidity, or parity. Most notably, the preterm group had a higher median MIS/AMH value (4.15 vs 2.45 ng/mL, P = 0.004) compared with the term group, as seen in Table 2. A predominance of PCOS as a SART infertility diagnosis was also seen in the preterm group, at a rate >300% compared with the term group.
Demographic Characteristics of Entire Cohort (n = 432)
| All Deliveries (n = 432) | Term Deliveries (n = 392) | Preterm Deliveries (n = 40) | P Valuea | |
|---|---|---|---|---|
| Age, y | 34.9 ± 3.57 | 34.9 ± 3.52 | 33.7 ± 3.92 | 0.025 |
| Marital status | 0.472 | |||
| Single | 5 (1.2%) | 5 (1.3%) | 0 (0%) | |
| Partnered | 427 (98.8%) | 387 (98.7%) | 40 (100%) | |
| Ethnicity | 0.451 | |||
| White | 319 (73.8%) | 291 (74.2%) | 28 (70.0%) | |
| Asian | 77 (17.8%) | 71 (18.1%) | 6 (15.0%) | |
| Black | 18 (4.2%) | 15 (3.8%) | 3 (7.5%) | |
| Hispanic | 18 (4.2%) | 15 (3.8%) | 3 (7.5%) | |
| History of cervical or uterine surgery | 35 (8%) | 31 (7.9%) | 4 (10.0%) | 0.644 |
| Diabetes | 26 (6%) | 24 (6.1%) | 2 (5.0%) | 0.776 |
| Gravidity, median (IQR) | 1 (0–2) | 1 (0–2) | 0.5 (0–2) | 0.929 |
| Parity, median (IQR) | 0 (0–1) | 0 (0–1) | 1 (0–1) | 0.741 |
| BMI | 24.2 ± 4.49 | 24.0 ± 4.43 | 26.6 ± 4.57 | <0.001 |
Abbreviation: IQR, interquartile range.
χ2, Mann-Whitney, or t test as appropriate.
Clinical Characteristics of Entire Cohort (n = 432)
| All Deliveries (n = 432) | Term Deliveries (n = 392) | Preterm Deliveries (n = 40) | P Valuea | |
|---|---|---|---|---|
| Gestational age, wk | 38.6 ± 2.42 | 39.1 ± 1.17 | 33.9 ± 4.82 | |
| Day 3 FSH, IU/mL | 7.3 ± 2.60 | 7.38 ± 2.62 | 6.55 ± 2.29 | 0.063 |
| Day 3 E2, pg/mL | 42.2 ± 31.8 | 42.9 ± 33.1 | 35.3 ± 12.6 | 0.156 |
| MIS/AMH, ng/mL, median (IQR) | 2.6 (1.3–4.8) | 2.45 (1.2–4.4) | 4.15 (1.8–9.9) | 0.004 |
| Cycle type | 0.026 | |||
| Fresh | 340 (78.7%) | 314 (80.1%) | 26 (65.0%) | |
| Frozen | 92 (21.3%) | 78 (19.9%) | 14 (35.0%) | |
| SART diagnosisb | ||||
| Idiopathic | 109 (25%) | 102 (26.0%) | 7 (17.5%) | |
| Tubal | 63 (15%) | 58 (14.8%) | 5 (12.5%) | |
| Male | 184 (43%) | 166 (42.4%) | 18 (45.0%) | |
| PCOS | 47 (11%) | 35 (8.9%) | 12 (30.0%) | |
| Anovulation | 34 (8%) | 29 (7.4%) | 5 (12.5%) | |
| DOR | 84 (19%) | 80 (20.4%) | 4 (10%) | |
| Endometriosis | 24 (6%) | 20 (5.1%) | 4 (10%) | |
| Multiple diagnoses | 121 (28%) | 108 (27.6%) | 13 (32.5%) | |
| Mode of delivery | 0.001 | |||
| Spontaneous vaginal | 287 (66%) | 249 (63.5%) | 38 (95.0%) | |
| Cesarean | 145 (34%) | 143 (36.5%) | 2 (5%) | |
| Birthweight, g | 3307.6 ± 621.6 | 3393.9 ± 512.2 | 2461.4 ± 911.5 | <0.001 |
Abbreviation: IQR, interquartile range.
χ2, Mann-Whitney, or t test as appropriate.
Total will sum to >432; given women could have multiple diagnoses.
Table 3 illustrates the unequal distribution of MIS/AMH values between preterm and term deliveries. However, when stratified by PCOS diagnosis, the effect of MIS/AMH levels on risk of preterm birth became more pronounced (Fig. 2). Within the group of women with PCOS (n = 47), those who delivered prematurely had a substantially higher median MIS/AMH value (18 vs 6.4 ng/mL, P = 0.003), were younger (mean age, 31.9 vs 33.9 years old, P = 0.056), and were more overweight (mean BMI, 29.3 vs 25.6, P = 0.020) than those who delivered at term (Tables 4 and 5).
MIS/AMH Breakdown of Entire Cohort
| All Births (n = 432) | Term Deliveries (n = 392) | Preterm Deliveries (n = 40) | |
|---|---|---|---|
| MIS/AMH, ng/mL | |||
| Mean ± SD | 3.80 ± 4.22 | 3.44 ± 3.39 | 7.39 ± 8.15 |
| Median, range | 2.6 (0.2–35) | 2.45 (0.2–29) | 4.15 (0.2–35) |
| Distribution/value | |||
| ≥75th Percentile/≥4.75 ng/mL | — | 90/392 (23%) | 18/40 (45%) |
| ≥90th Percentile/≥8.5 ng/mL | — | 34/392 (8.7%) | 11/40 (27.5%) |
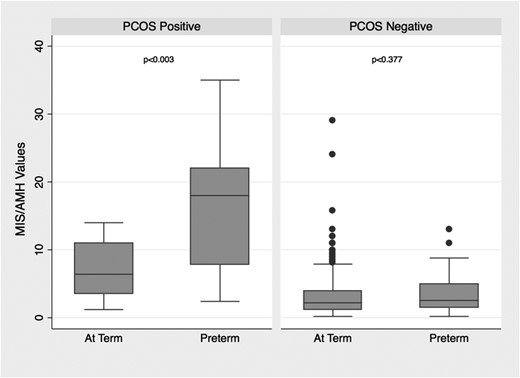
Distribution of MIS/AMH levels in women with and without PCOS by timing of delivery.
Demographic Characteristics of Women With PCOS (n = 47)
| All Deliveries (n = 47) | Term Deliveries (n = 35) | Preterm Deliveries (n = 12) | P Valuea | |
|---|---|---|---|---|
| Age | 33.4 ± 3.0 | 33.9 ± 2.83 | 31.9 ± 3.31 | 0.056 |
| Marital status | — | |||
| Single | 0 (0%) | 0 (0%) | 0 (0%) | |
| Partnered | 47 (100%) | 35 (100%) | 12 (100%) | |
| Ethnicity | 0.669 | |||
| White | 29 (61.7%) | 23 (65.7%) | 6 (50%) | |
| Asian | 8 (17.0%) | 6 (17.1%) | 2 (16.7%) | |
| Black | 3 (6.4%) | 2 (5.7%) | 1 (8.3%) | |
| Hispanic | 7 (14.9%) | 4 (11.4%) | 3 (25%) | |
| History of cervical or uterine surgery | 4 (9%) | 3 (8.6%) | 1 (8.3%) | 0.980 |
| Diabetes | 5 (11%) | 5 (14.3%) | 0 (0%) | 0.166 |
| Gravidity, median (IQR) | 1 (0–2) | 1 (0–2) | 0.5 (0–1.5) | 0.640 |
| Parity, median (IQR) | 0 (0–1) | 0 (0–1) | 0 (0–0) | 0.085 |
| BMI | 26.5 ± 4.8 | 25.6 ± 4.42 | 29.3 ± 4.92 | 0.020 |
Abbreviation: IQR, interquartile range.
χ2, Mann-Whitney, or t test as appropriate.
Clinical Characteristics of Women With PCOS (n = 47)
| All Deliveries (n = 47) | Term Deliveries (n = 35) | Preterm Deliveries (n = 12) | P Valuea | |
|---|---|---|---|---|
| Gestational age, wk | 37.2 ± 4.62 | 39.1 ± 1.15 | 32.2 ± 6.49 | — |
| Day 3 FSH, IU/mL | 5.96 ± 1.30 | 6.26 ± 1.30 | 5.20 ± 0.94 | 0.014 |
| Day 3 E2, pg/mL | 35.8 ± 13.6 | 36.1 ± 14.6 | 34.9 ± 11.3 | 0.779 |
| MIS/AMH, ng/mL, median (IQR) | 8.3 (3.9–13) | 6.4 (3.5–11) | 18 (7.8–22) | 0.003 |
| Cycle type | 0.813 | |||
| Fresh | 30 (64%) | 22 (62.9%) | 8 (66.7%) | |
| Frozen | 17 (36%) | 13 (37.1%) | 4 (33.3%) | |
| SARTb | ||||
| Idiopathic | 0 | 0 | 0 | |
| Tubal | 5 | 3 | 2 | |
| Male | 20 | 18 | 2 | |
| Anovulation | 5 | 3 | 2 | |
| DOR | 1 | 1 | 0 | |
| Endometriosis | 0 | 0 | 0 | |
| Multiple diagnoses | 26 (55%) | 21 (60%) | 5 (41.7%) | |
| Mode of delivery | 0.085 | |||
| Spontaneous vaginal | 36 (77%) | 24 (68.6%) | 12 (100%) | |
| Cesarean | 11 (23%) | 11 (31.4%) | 0 (0%) | |
| Birthweight, g | 3092.9 ± 915.3 | 3423.1 ± 529.8 | 2130 ± 1130.0 | <0.001 |
Abbreviation: IQR, interquartile range.
χ2, Mann-Whitney, or t test as appropriate.
Total will sum to >47, given women could have multiple SART diagnoses.
Conversely, for women without PCOS, no differences in demographic characteristics, including age, BMI, and ethnicity, were seen between the women who delivered at term vs preterm. Additionally, they had similar MIS/AMH levels, specifically 2.25 ng/mL for term and 2.55 ng/mL for preterm (P = 0.392).
At the highest MIS/AMH values, preterm deliveries predominated (Table 6). Two-thirds of PCOS women with MIS/AMH levels above the 75th percentile (MIS/AMH value of 13 ng/mL) delivered preterm. Of the five women with PCOS with an MIS/AMH level above the 90th percentile (20 ng/mL), all delivered preterm.
MIS/AMH Breakdown Among Women With PCOS
| All Births (n = 47) | Term Deliveries (n = 35) | Preterm Deliveries (n = 12) | |
|---|---|---|---|
| MIS/AMH, ng/mL | |||
| Mean ± SD | 9.45 ± 6.96 | 7.58 ± 3.93 | 16.2 ± 9.44 |
| Median, range | 8.3 (1.2–35) | 6.4 (1.2–14) | 18 (2.4–35) |
| Distribution/value | |||
| ≥75th Percentile/≥13 ng/mL | — | 4/35 (11%) | 8/12 (67%) |
| ≥90th Percentile/≥20 ng/mL | — | 0/35 (0%) | 5/12 (41.7%) |
For the second outcome of interest, a separate analysis of women with DOR (n = 80) focused on the MIS/AMH levels of women who underwent a cesarean delivery for arrest of labor compared with the those who delivered either vaginally or via cesarean delivery for other indications. Their demographic and clinical information are represented in an online repository (52). Notably, there was no difference in MIS/AMH values between the women who experienced labor arrest (who subsequently required cesarean delivery) and the comparison group of normal deliveries. Furthermore, when exploring the extremely low MIS/AMH levels at the 25th and 10th percentile within the cohort, there was no difference noted with regard to prevalence of cesarean delivery for arrest or other delivery outcome (52).
Discussion
In this population of patients undergoing IVF, elevated MIS/AMH levels were highly associated with adverse obstetric outcomes. Women with PCOS and an elevated MIS/AMH level were at the greatest risk for spontaneous preterm birth. The risk was magnified at the extremely high MIS/AMH levels, with the result that all those who had an MIS/AMH level above the 90th percentile (20 ng/mL) delivered prematurely. Interestingly, it seems that this combination of factors—PCOS plus an extremely high MIS/AMH level—is highly associated with elevated risk of spontaneous preterm birth, whereas women without PCOS who delivered prematurely had similar MIS/AMH levels to their counterparts who delivered at term.
PCOS is associated with a variety of complications in pregnancy, including increased risk of miscarriage and preterm birth; however, to date there are no specific identifiable markers that delineate which patients are at risk (53). Recent meta-analyses have analyzed the strength of the association of PCOS with preterm birth, and they noted it to be weakened by study heterogeneity (54, 55). Several studies have included multiple gestations (which may occur following ovulation induction or IVF in patients with PCOS) as well as medically indicated preterm births (e.g., induced deliveries for preeclampsia or gestational diabetes, conditions for which patients with PCOS are unequivocally at higher risk). Our study excluded these potential confounders, and in doing so, revealed an independent risk factor for spontaneous preterm birth in patients with PCOS with elevated AMH/MIS levels.
We propose that the biological plausibility for this association can be found in the expression pattern of the MISR2 in the uterus as well as from discoveries in novel mouse models. Transgenic mice with constitutive overexpression of MIS/AMH are able to conceive pregnancies but experience spontaneous midgestational loss and extensive resorption of pups (56). We theorize that this phenomenon may be comparable to spontaneous preterm birth in humans.
A recent retrospective cohort analysis modeled IVF outcomes at various MIS/AMH level cutoffs, noting that live birth numbers were optimized within an intermediate range of MIS/AMH values (variable depending on age), but lower and higher values were associated with a poorer prognosis (57). In fact, women experienced extraordinarily high rates of miscarriage at an MIS/AMH level >10 ng/mL, ranging from 43% loss rate in women under the age of 36 years up to 82% in women ≥43 years of age. Their analysis showed that there is an age-dependent “best” MIS/AMH level range for IVF outcomes. Lower MIS/AMH levels were associated with lower pregnancy rates but a relatively typical miscarriage rate, based on age. High MIS/AMH levels, however, were associated with slightly lower pregnancy rates and a much higher miscarriage rate than for women with normal values (57). Our findings reflected continued pregnancy “loss” after fetal viability in women with PCOS at the highest MIS/AMH levels, manifesting as preterm labor and delivery later in the second trimester and into the third trimester. If elevated MIS/AMH levels were to be proven to be a causative agent in the pathophysiology of preterm birth, or other adverse obstetric outcome, one could envision a role for treatments that reduce the MIS/AMH levels, such as ovarian drilling (58, 59).
With regard to obstetric risks associated with the extremely low MIS/AMH levels, we sought to correlate mode of delivery with the low MIS/AMH levels associated with idiopathic diminished ovarian reserve. However, no association was found with Cesarean section, even at the lowest percentiles of MIS/AMH. This is not altogether surprising given the multifactorial decision-making process involving unique maternal, fetal, and medical provider factors that all contribute to a cesarean delivery. Thus, the impact of extremely low MIS/AMH levels on uterine physiology is yet to be determined.
The relationship between high MIS/AMH levels and preterm labor risk is a complex one, because the ligand is secreted by the ovary but its receptors are distributed in the ovary, uterus (34–37), and hypothalamus/pituitary (60, 61), all of which could directly or indirectly affect uterine function. Furthermore, MIS/AMH is itself intimately linked with the etiology of PCOS, given the prevalence of AMH mutations in that patient population (62), as well as the ability of high MIS/AMH prenatal exposure to cause PCOS in mice (48). It remains unclear whether risk of preterm birth could be explained by the effect of MIS/AMH during gestation, or by the sequela of dysregulated uterine development long prior to pregnancy. For the former, one might consider an inhibitory effect of MIS/AMH on myometrium maintenance, remodeling, or contractility, given the reported expression of MISR2 in that cell type. For the latter, it is easy to envision how even mild Müllerian hypoplasia could translate into a restricted capacity to accommodate full-term pregnancy. To address these possibilities, future studies should characterize MISR2 expression in the developing and adult human uterus, and consider measuring uterine metrics, such as thickness, in the PCOS population with high MIS/AMH levels.
Alternatively, the extreme MIS/AMH secretion phenotype in patients with PCOS may be reflecting a clinical subtype with an exaggerated ovarian phenotype, associated with a more pronounced hormonal dysregulation (such as hyperandrogenemia) indirectly resulting in increased preterm risk. Or finally, MIS/AMH levels may be correlated to an unmeasured predictor, or to a variable for which we could not perform a regression analysis given the limited size of our study, which could be mechanistically unrelated to the preterm labor.
The IVF population represented in our study may limit the generalizability of the findings. Within our fertility center, all patients are nonsmokers and have a BMI between 18.5 and 40. Furthermore, blacks represent 4% of our study population, whereas they are ∼13% of the US population. It would also be beneficial to study the association between MIS/AMH levels and obstetric outcomes in a non-IVF population. The Ansh assay was used in this study, but the Beckman Coulter, Roche, or other MIS/AMH immunoassays would also be applicable, if a single assay were applied across the entire population as in this study (63–66). Ideally, there should be an international standard assay, toward which the World Health Organization is working, to allow more direct comparisons to be made (67, 68).
Whether the adverse obstetric outcomes associated with elevated MIS/AMH levels is a direct effect of MIS/AMH itself, or if its elevation is a proxy for another physiologic process, the risk of an extremely elevated level in women with PCOS has clear clinical significance. We invite other fertility practices to examine their patient populations in an effort to define further the scope of this obstetric risk. If MIS/AMH level, as our data indicates, proves to be a predictive marker for preterm birth, particularly among women with PCOS, then closer monitoring should be implemented for women at highest risk.
Abbreviations:
- AMH
anti-Müllerian hormone
- BMI
body mass index
- DOR
diminished ovarian reserve
- MIS
Müllerian-inhibiting substance
- MISR2
MIS type 2 receptor
- PCOS
polycystic ovary syndrome
- SART
Society for Assisted Reproductive Technology
Acknowledgments
The authors acknowledge Michael F. Greene, Caroline Coletti, Motohiro Kano, Hatice Duygu Saatcioglu, and Irene Souter for contributions to this project.
Financial Support: This work was supported by funding from the Massachusetts General Hospital Department of Obstetrics and Gynecology (to M.E.S.) and the Massachusetts General Hospital Department of Surgery (to D.P.).
Disclosure Summary: The authors have nothing to disclose.
