


Abstract
Obesity-related hyperinsulinism may impede lifestyle-initiated weight loss.
Proof-of-concept study to investigate the amplifying effects of diazoxide (DZX)-mediated insulin suppression on lifestyle-induced weight loss in nondiabetic, hyperinsulinemic, obese men.
Twelve-month study comprising an initial 6-month, double-blind trial, followed by a partially de-blinded 6-month extension in men with obesity with a body mass index of 30 to 37.5 kg/m2 and a fasting serum C-peptide level >1.00 nM. Patients were randomized into three treatment groups: DZX + placebo (DZX + PL), DZX + metformin (DZX + MTF), and double PL (PL + PL).
At 6 months, DZX treatment was associated with a 6.1-kg PL-subtracted decline in fat mass (FM), and at 12 months, FM had decreased by a total of 15.7 ± 2.5 kg. Twelve months of DZX treatment was also associated with a significant decline in systolic (−6.6%) and diastolic (−8.6%) blood pressure and low-density lipoprotein-cholesterol (−18%) and triglycerides (−43%) and a 39% rise in high-density lipoprotein-cholesterol. These effects were achieved at the cost of a small rise in fasting glucose (95% CI: 0.2 to 1.0 mM) and hemoglobin A1c (95% CI: −0.08% to 0.44%). There were no differences between DZX monotherapy and the combination of DZX + MTF.
High-dose DZX treatment of 1 year resulted in a substantial decrease in FM, blood pressure, and lipid levels at the cost of a small rise in blood glucose levels.
Recent trend data in 200 countries indicate that the global prevalence of obesity continues to increase rapidly. Predictions for 2025 are that 18% of men and 21% of women will be obese (1).
Treatment of obesity is a major challenge. As most lifestyle interventions have shown only limited and transient effects, additional interventions will be needed to establish clinically meaningful weight loss. Over the past six decades, several compounds have been developed to promote weight loss, but most have been withdrawn because of limited efficacy or major side effects (2). Orlistat is one of the compounds that is still available, but its effect is small, with a placebo (PL)-subtracted 1-year mean weight loss of 2.9 kg (3). The phentermine-topiramate combination is currently the most effective antiobesity drug with a PL-subtracted 1-year weight loss of 8.8 kg; however, it has a high adverse event score, and it is only available in the United States (2). The second-most effective compound is liraglutide, with a PL-subtracted 1-year weight loss of 5.6 kg. It is one of today’s most expensive antiobesity drugs (2).
Suppression of insulin levels is a relatively underexplored approach of obesity treatment. Obesity-related hyperinsulinemia is generally viewed as a compensatory β-cell response to overcome the resistance to the glucose-lowering actions of insulin. However, there is also evidence that hyperinsulinemia may actually promote the development of obesity (4–6). In juvenile obesity, postprandial hyperinsulinemia precedes the development of insulin resistance by 4 to 5 years (7). Likewise, in adults, both fasting and postprandial hyperinsulinemia have been identified as predictors of long-term weight gain (8, 9).
Insulin promotes adipocyte lipogenesis by stimulating fatty acid uptake and its conversion into triglycerides (TG) and suppresses lipolysis by inhibition of hormone-sensitive lipase (10, 11). Both mechanisms promote sustained storage of fat in the adipocyte. Hyperinsulinemia may therefore be a major obstacle for weight loss, and it has been suggested that suppression of insulin secretion may help to promote lipolysis and decrease body fat mass (FM). This hypothesis is supported by observations in animals and humans with obesity (12–14).
Diazoxide (DZX), a nonselective potassium channel agonist that inhibits glucose-stimulated insulin secretion in the pancreatic β-cell, has been used to study the effects of insulin suppression on body composition in several small studies (13, 15–20). In hyperinsulinemic with obesity, 8 weeks of DZX treatment led to a more than twofold-higher loss of body fat than PL (15). In an open, uncontrolled pilot study in men with obesity, the decrease in body fat was found to be related to the level of DZX-mediated insulin suppression. Loss of fat of 10 kg or more occurred when fasting insulin levels were suppressed below 4.5 mU/L (16). The current study was designed to explore further the efficacy of high-dose DZX as antiobesity treatment in men in a PL-controlled setting. In a subgroup of patients, metformin (MTF) was added to test its ability to prevent DZX-induced hyperglycemia.
Subjects and Methods
Subjects
Men who were obese, but otherwise healthy, with a body mass index (BMI) of 30 to 37.5 kg/m2 and 20 to 55 years of age, were recruited by advertisement in local newspapers. All subjects received a general physical examination and a laboratory screening after an overnight fast. Men with a fasting plasma glucose level ≤6 mM, a hemoglobin (Hb)A1c level ≤6.0% (42 mmol/mol), a fasting C-peptide level ≥ 1.0 nM, and a stable body weight for at least 3 months before the study were eligible for inclusion. Women were not included because of the risk of hypertrichosis. Exclusion criteria were the following: any endocrine disease, serum creatinine >120 µM, liver enzymes greater than two times the upper limit of normal, continued use of medication affecting blood pressure or glucose and lipid metabolism, drug abuse, gout, use of alcohol >2 U/day, and cessation of smoking in the past 6 months. Antihypertensive or lipid-lowering drugs were discontinued 4 weeks before the start of the study. The study was approved by the Institutional Review Board and registered at clinicaltrials.gov as NCT00631033. All participating subjects gave their written, informed consent.
Study design
Patients were randomized in a double-blind manner to one of three treatment arms; DZX + PL (DZX + PL), DZX + MTF, and double PL (PL + PL). DZX was started in a dose of 100 mg twice daily with monthly increments of 100 mg per day, until side effects or hyperglycemia occurred or until the maximum dose of 900 mg daily was reached. The dose-escalation schedule is summarized in Table 1. Tablets were taken at breakfast, lunch, dinner, and before bedtime. MTF was started in a dose of 850 mg once daily with weekly increments of 850 mg per day up to a maximum dose of three times 850 mg or until gastrointestinal side effects occurred. Before the study, caloric intake was assessed by a dietician. Study diet and physical exercise were standardized. A mild hypocaloric diet was prescribed, consisting of 75% of the caloric intake required to maintain ideal body weight, as calculated by the Harris-Benedict formula (21). All subjects were instructed to use only three meals a day with a carbohydrate-fat-protein content of 50%, 30%, and 20%, respectively, and received instructions to walk for 30 minutes after lunch and dinner with the aim to reach 10,000 steps a day. In addition, they were instructed to visit the Sports Center (Physique, Arnhem, Netherlands) three times a week to receive standardized training by two physiotherapists. Attendance to the Sports Center was recorded. After 6 months, treatment of the subjects in the PL + PL arm was discontinued. Treatment of DZX arms remained blinded for the full 12-month study period.
DZX and PL Dose-Escalation Schedule
| Study Duration (wk) | Number of Tablets, 100 mg | |||
|---|---|---|---|---|
| Breakfast | Lunch | Dinner | Bedtime | |
| 0–4 | 1 | 0 | 1 | 0 |
| 4–8 | 1 | 1 | 1 | 0 |
| 8–12 | 1 | 1 | 1 | 1 |
| 12–16 | 2 | 1 | 1 | 1 |
| 16–20 | 2 | 1 | 2 | 1 |
| 20–24 | 2 | 2 | 2 | 1 |
| 24–28 | 2 | 2 | 2 | 2 |
| >28 (maximum dose) | 3 | 2 | 2 | 2 |
One tablet represents 100 mg DZX or PL.
Measurements
Baseline measurements included body height, weight, waist circumference, body composition by total body dual energy X-ray absorptiometry (Lunar; Dexa Solutions, Madison, WI), blood pressure, home glucose measurements for 2 days, and the number of steps per week measured by pedometer (Omron Walking style One 2.0 HJ-320-E, Hoofddorp, Netherlands). A 24-hour urine was collected to measure total volume and creatinine and glucose excretion. A fasting blood sample was obtained between 0800 and 0900 to measure total blood count, plasma glucose, insulin, HbA1c, creatinine, sodium, potassium, uric acid, lactic acid, liver enzymes, lipid profile, beta-hydroxybutyric acid, aceto-acetate, and free fatty acid levels. All baseline measurements were repeated at 6 and 12 months. The main outcome measurements were body weight, FM, blood pressure, glucose, HbA1c, lipid levels, and reported side effects.
Patients had to visit the outpatient clinic every month for the measurement of body weight, blood pressure, waist circumference, and a check of blood glucose levels. Blood pressure was measured in the upright position with an automatic device (Omron M3) after a 5-minute rest.
Laboratory assays
Commercially available methods were used for measurement of plasma glucose (enzymatic colorimetric assay, p800; Roche Diagnostics, Mannheim, Germany), plasma insulin (electrochemiluminescence immunoassay; Elecsys 2010; Roche Diagnostics), plasma C-peptide concentrations (competitive chemiluminescent enzyme immunoassay; Diagnostic Products Corporation, Los Angeles, CA; manufacturer’s reference for fasting levels in nonobese subjects: 0.15 to 1.00 nM), and HbA1c (reverse-phase cation exchange chromatography; ADAMSTM HA-8160; Menarini Group, Florence, Italy). Plasma DZX levels were analyzed by high-pressure liquid chromatography with UV detection, as described previously (17).
Safety monitoring
All subjects were instructed to perform three, eight-point home glucose measurements in the week preceding the monthly outpatient clinic visit (Accu-check: Roche Diagnostics), with blood samples taken in the fasting state, 2 hours after breakfast, just before lunch, 2 hours after lunch, before dinner, 2 hours after dinner, at bedtime, and at 3:00. They were instructed to contact the trial investigators before the planned visits if side effects or hyperglycemia occurred. Hyperglycemia was defined as a fasting home glucose level >7 mM or a glucose level >11 mM, 2 hours after a meal.
Every 4 weeks, fasting glucose, insulin, and blood pressure were measured, and a 24-hour urine was collected to quantify glucosuria. In the case of DZX-related side effects, such as edema, hyperglycemia, glucosuria, a systolic blood pressure <110 mmHg, or a diastolic blood pressure <70 mmHg, the DZX dose was reduced in steps of 100 mg per day every 2 to 4 weeks until all side effects disappeared. In the case of edema persisting for >2 weeks, an additional blood sample was taken to measure N-terminal pro-brain natriuretic peptide.
Statistical analysis
All data are shown as means ± SEM. The results were analyzed as per protocol. Data from patients meant to be on active treatment were excluded if plasma DZX levels were undetectable, as this suggested noncompliance. Differences among the three groups were analyzed by one-way ANOVA. Differences within groups were analyzed by paired t test; these paired t tests compared the baseline results with the 6- and 12-month results (see Tables 3 and 4). Differences between both DZX groups were analyzed by unpaired t test. In the case of a non-Gaussian distribution, the Kruskal-Wallis and Wilcoxon tests were used. To calculate correlations, Pearson correlation test was used. P < 0.05 was considered statistically significant.
Sample-size calculation
Sample-size calculation was based on the results of a previous, uncontrolled DZX pilot study showing a 6-month mean weight loss of 10 kg and the magnitude of weight loss during PL treatment observed in a large, controlled intervention study (3, 16). With an expected 6-month weight loss of 10 kg for DZX and 3 kg for PL, with an SD of 5 kg, at least eight men had to be included to demonstrate a PL-subtracted difference of 7 kg (α 0.05, power 80%). With an estimated dropout rate of 25%, 12 men had to be included in each arm.
Results
Forty-four men were included (Fig. 1). Nine men dropped out during the initial 4 weeks of the trial: three for personal reasons unrelated to the trial, two because of side effects (one because of MTF-related gastrointestinal side effects and another one because of MTF-induced rash), and four because of early-onset motivational problems and/or the inability to adhere to the physical exercise protocol. Thirty-five men completed the 6-month PL-controlled period as per protocol: 12 in the PL + PL arm, 10 in the DZX + PL arm, and 13 in the DZX + MTF arm. One subject in the DZX + PL arm had undetectable DZX serum levels starting from week 4, and one subject in the DZX + MTF arm had undetectable DZX serum levels starting from week 20. Data of these patients were excluded.
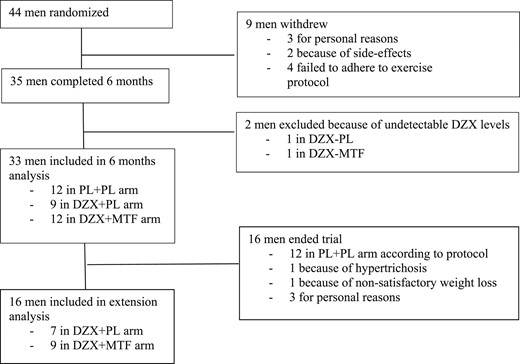
Randomization and dropouts.
Baseline results
At baseline, the three groups were well matched for all parameters, with the exception of a slightly higher low-density lipoprotein (LDL) in the DZX + PL group (Table 2). The reported caloric intake before the study was 2428 ± 102 kcal/day. The recommended intake during the study was 1627 ± 37 kcal/day, which represents a reduction of 30.9 ± 2.8% compared with prestudy intake (P < 0.001). Fasting C-peptide and insulin levels ranged from 1.0 to 1.9 nM and from 8.5 to 34.5 mU/L, respectively. Two men in the DZX + MTF arm had obstructive sleep apnea syndrome requiring continuous positive airway pressure, three men used a antihypertensive agent (low dose β-blocker, diuretic, and angiotensin-converting enzyme inhibitor, respectively, one patient in each arm), and three men (one patient in each arm) used a statin. Antihypertensives and statins had been discontinued 4 weeks before the start of the study, according to protocol.
Baseline Characteristics (B) and Changes (∆) After 6 Months
| PL + PL, n = 12 | DZX Groups, n = 21 | DZX + PL, n = 9 | DZX + MTF, n = 12 | P Value | |
|---|---|---|---|---|---|
| Age, y | 46.6 ± 1.9 | 42.3 ± 1.7 | 41.9 ± 3.1 | 42.5 ± 2.0 | 0.29 |
| Intake, kcal/d | 2468.4 ± 186.7 | 2540.1 ± 160.1 | 2671.2 ± 178.1 | 2269.3 ± 165.0 | 0.31 |
| DZX dosage, mg/d | 435 ± 33 | 422 ± 62 | 442 ± 34 | 0.61 | |
| DZX serum level, mg/L | ND | 37.2 ± 4.7 | 37.9 ± 8.8 | 38.8 ± 5.1 | 0.62 |
| Weight, kg | |||||
| B | 118.5 ± 2.4 | 119.9 ± 2.9 | 124.5 ± 4.9 | 116.7 ± 3.4 | 0.58 |
| ∆ | −8.3 ± 0.8a | −12.4 ± 1.6a | −12.3 ± 1.6a | −12.4 ± 1.3a | 0.03b |
| BMI, kg/m2 | |||||
| B | 34.8 ± 0.7 | 35.3 ± 0.6 | 34.9 ± 0.8 | 35.6 ± 0.9 | 0.73 |
| ∆ | −2.3 ± 0.3a | −3.8 ± 0.4a | −4.2 ± 0.6a | −3.6 ± 0.4a | 0.03b |
| Waist, cm | |||||
| B | 120.6 ± 2.1 | 119.4 ± 1.8 | 120.4 ± 2.2 | 118.6 ± 2.6 | 0.83 |
| ∆ | −8.0 ± 1.0a | −11.7 ± 1.2a | −11.5 ± 2.1a | −11.8 ± 1.4a | 0.14 |
| FM, kg | |||||
| B | 44.1 ± 1.6 | 46.6 ± 1.7 | 46.1 ± 2.4 | 47.0 ± 2.3 | 0.59 |
| ∆ | −7.6 ± 1.2a | −13.7 ± 1.3a | −14.4 ± 2.4a | −13.4 ± 1.2a | 0.01b |
| LBM, kg | |||||
| B | 68.3 ± 1.9 | 67.6 ± 1.6 | 71.9 ± 2.4 | 64.7 ± 1.9 | 0.14 |
| ∆ | 0.7 ± 0.9 | 1.7 ± 0.5c | 1.7 ± 1.0 | 1.8 ± 0.5d | 0.63 |
| Fasting insulin, mU/L | |||||
| B | 13.1 ± 1.7 | 15.0 ± 1.5 | 15.5 ± 2.6 | 14.6 ± 1.8 | 0.43 |
| ∆ | −3.4 ± 1.7 | −11.5 ± 1.2a | −12.5 ± 2.3c | −10.8 ± 1.3a | <0.01b |
| Fasting glucose, mM | |||||
| B | 5.6 ± 0.2 | 5.7 ± 0.1 | 5.6 ± 0.1 | 5.7 ± 0.1 | 0.53 |
| ∆ | −0.1 ± 0.1 | 0.6 ± 0.2c | 0.7 ± 0.2d | 0.6 ± 0.3d | 0.04b |
| HbA1c, % | |||||
| B | 5.5 ± 0.1 | 5.7 ± 0.1 | 5.6 ± 0.1 | 5.7 ± 0.1 | 0.13 |
| ∆ | 0.0 ± 0.1 | 0.2 ± 0.1 | 0.3 ± 0.1 | 0.2 ± 0.1 | 0.17 |
Values represent means ± SEM.
Abbreviations: LBM, lean body mass; ND, not determined.
P < 0.001.
P < 0.05 between DZX+MTF and DZX+PL versus PL+PL.
P < 0.01.
P < 0.05.
DZX and MTF doses and side effects
DZX was gradually titrated upward until side effects occurred. The mean maximal DZX dose that patients were exposed to during the first 6 months was 467 ± 27 mg/day. Individual maximal doses varied markedly and ranged from 300 to 700 mg/day. Dose reduction because of side effects was performed in 18 DZX patients and in one PL-treated patient. Sixteen DZX patients required a dose reduction of 100 mg, and two required a dose reduction of 200 mg before side effects had disappeared completely. At 6 months, none of the patients had side effects or glucosuria.
The mean daily DZX dose reached at 6 months was 422 ± 62 mg in the DZX + PL arm and 442 ± 34 mg in the DZX + MTF arm. This corresponded with plasma DZX levels of 37.9 ± 8.8 mg/L and 38.8 ± 5.1 mg/L (P = 0.85), respectively. DZX was not detectable in the PL + PL group. All but one subject tolerated MTF in a dose of 2550 mg/day.
Adverse events during the dose-escalation period were the following: transient nausea, edema, hyperglycemia, loose stools, hypertrichosis, and palpitations (see Table 3). The dose-limiting events related to DZX were hyperglycemia and edema. Twelve patients developed edema during the 6-month dose-escalation period (one PL-treated patient and 11 DZX-treated patients). N-Terminal pro-brain natriuretic peptide levels measured at the time of edema formation ranged from 1 to 18 pM (median 7 pM) and were well below the upper normal limit of 21 pM.
Adverse Events During Dose Escalation
| Adverse Effects | PL + PL | DZX + PL | DZX + MTF |
|---|---|---|---|
| Nausea | 1 | 1 | 11 |
| Edema | 1 | 3 | 8 |
| Hyperglycemia | 0 | 3 | 3 |
| Glucosuria | 0 | 1 | 2 |
| Palpitations | 0 | 3 | 0 |
| Hypertrichosis | 1 | 2 | 2 |
| Loose stool | 1 | 1 | 2 |
| Adverse Effects | PL + PL | DZX + PL | DZX + MTF |
|---|---|---|---|
| Nausea | 1 | 1 | 11 |
| Edema | 1 | 3 | 8 |
| Hyperglycemia | 0 | 3 | 3 |
| Glucosuria | 0 | 1 | 2 |
| Palpitations | 0 | 3 | 0 |
| Hypertrichosis | 1 | 2 | 2 |
| Loose stool | 1 | 1 | 2 |
All events disappeared after dose reduction.
Effects on body composition
During the first 3 months, all three groups showed a similar degree of weight loss (Fig. 2). Thereafter, weight loss began to diverge, and at 6 months, weight loss was significantly greater in the DZX + PL (−12.3 ± 1.6 kg) and DZX + MTF (−12.4 ± 1.6 kg) arms compared with the PL + PL arm (−8.2 ± 0.8; Table 3; P = 0.03). Loss of FM, assessed by dual-energy X-ray absorptiometry, was also significantly greater in the DZX + PL and DZX + MTF arms (−14.4 ± 2.4 kg and −13.4 ± 1.2 kg, respectively) compared with PL (−7.6 ± 1.2 kg; P = 0.01). The combination of the results of both DZX groups showed a PL-subtracted loss of FM of 6.1 kg (95% CI: −8.9 to −3.3 kg). The increase in lean body mass (LBM) was comparable for all groups (P = 0.63). The changes (Δ) in body weight and FM over the first 6 months were correlated with fasting insulin levels, measured at 6 months (fasting-Ins6; Δ-body weight vs fasting-Ins6: r = −0.37, P = 0.01 and Δ-FM vs fasting-Ins6: r = −0.43, P = 0.008). As shown in Fig. 3, substantial loss of FM (decrease >10 kg) only occurred if fasting insulin levels were <5.5 mU/L (for conversion to pM, multiply by 6.945).

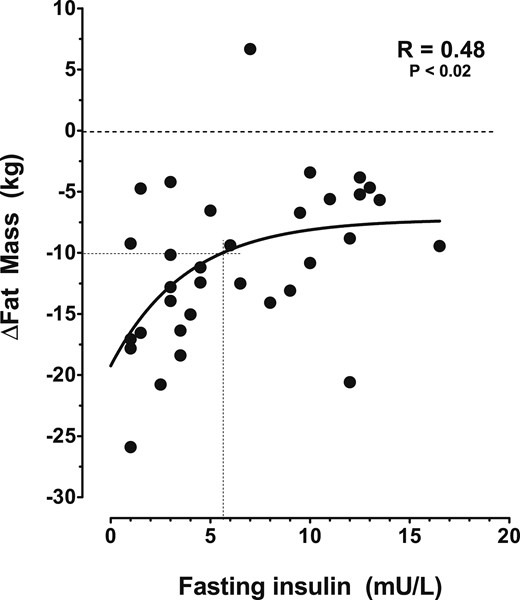
Curve fit of the change (∆) in body FM as a function of fasting-Ins6. Each solid circle represents men in either the PL-PL, or DZX group. The crossed lines show the fasting insulin level below which fat loss of at least 10 kg occurred. The dashed horizontal line is “zero weight loss line.”
Extension of the study
Sixteen out of 23 (70%) men on active treatment completed the 6-month extension, according to protocol. At 6 months, one subject had stopped treatment because of hypertrichosis, one because of nonsatisfactory weight loss, and three for reasons not related to the trial. Results of the changes in the 16 men after the 6-month extension are summarized in Table 4. Baseline results of this subgroup did not differ significantly from those of the initial group. DZX dose escalation continued beyond 6 months. The maximal doses that patients were exposed to ranged from 300 to 900 mg/day: 900 mg was reached in two subjects, 800 mg in one subject, and 700 mg in one subject, and 12 were exposed to a dose of 600 mg or less. The maximal tolerated dose, i.e., the dose without side effects ranged from 200 to 900 mg/day. The achieved mean daily DZX doses and DZX plasma levels, as well as the changes in outcome parameters at 12 months, were comparable for the DZX + PL and DZX + MTF groups, and therefore, results of both groups were combined. At 12 months, mean fasting insulin levels had decreased to 5.0 ± 1.6 mU/L, whereas mean fasting glucose levels had increased from 5.8 ± 0.1 to 6.2 ± 0.2 mM without a significant increase in HbA1c level. Body weight decreased by 13.8 ± 1.8% and FM by 33.5 ± 4.7%. The changes in body weight and FM over 12 months were correlated with fasting insulin levels achieved at 12 months (fasting-Ins12); Δ-body weight vs fasting-Ins12: r = −0.37, P < 0.01) and (Δ-FM vs fasting-Ins12: r = −0.56, P < 0.0001. The 0.4% increase in LBM was not significant (P = 0.89). As shown in Table 4, 12 months of DZX treatment were also associated with a significant decline in systolic and diastolic blood pressure (6.6% and 8.6%, respectively), a 39% increase in high-density lipoprotein-cholesterol, and a decline in LDL-cholesterol (17.9%) and TG (43%).
Baseline Characteristics and Changes in the 16 Patients Completing the 1-Year DZX Treatment Period, According to Protocol
| Baseline | 6 Months Change | 12 Months Change | 12 Months % Change | |
|---|---|---|---|---|
| DZX dosage, mg/d | 0 | 494 ± 37 | 512 ± 48 | |
| DZX serum level, mg/L | ND | 40.9 ± 5.2 | 42.2 ± 7.2 | |
| Fasting insulin, mU/L | 18.1 ± 1.6 | −14.2 ± 1.2a | −13.6 ± 1.2a | −76.7 ± 5.3a |
| Weight, kg | 120.3 ± 3.4 | −14.1 ± 1.4a | −16.9 ± 2.5a | −13.8 ± 1.8a |
| BMI, kg/m2 | 35.2 ± 0.7 | −3.6 ± 0.4a | −4.5 ± 0.7a | −12.8 ± 1.8a |
| Waist, cm | 119.9 ± 1.8 | −12.3 ± 1.3a | −15.2 ± 1.9a | −12.6 ± 1.4a |
| FM, kg | 46.5 ± 1.9 | −14.3 ± 1.3a | −15.7 ± 2.5a | −33.5 ± 4.7a |
| LBM, kg | 68.3 ± 1.8 | 1.2 ± 0.7 | 0.2 ± 0.8 | +0.4 ± 1.1 |
| Systolic BP, mmHg | 148.1 ± 3.3 | −11.8 ± 2.7a | −10.9 ± 2.5a | −6.6 ± 1.6a |
| Diastolic BP, mmHg | 91.2 ± 2.3 | −8.7 ± 2.2b | −8.3 ± 1.7b | −8.6 ± 1.7b |
| Fasting glucose, mM | 5.8 ± 0.1 | 0.5 ± 0.2c | 0.5 ± 0.2b | +8.7 ± 3b |
| HbA1c, % | 5.7 ± 0.1 | 0.3 ± 0.1 | 0.1 ± 0.1 | +2.1 ± 1.2 |
| HDL, mM | 1.1 ± 0.0 | 0.4 ± 0.1a | 0.4 ± 0.1a | +39.1 ± 7.9a |
| LDL, mM | 3.7 ± 0.2 | −0.8 ± 0.2a | −0.7 ± 0.1a | −17.9 ± 4.7a |
| TG, mM | 1.9 ± 0.3 | −1.0 ± 0.2a | −1.0 ± 0.2a | −43 ± 7.5a |
Values represent mean ± SEM.
Abbreviations: BP, blood pressure; HDL, high-density lipoprotein; ND, not determined.
P < 0.001.
P < 0.05.
P < 0.01.
Discussion
The current study indicates that treatment by high-dose, DZX-mediated insulin suppression in hyperinsulinemic men with obesity on top of moderate caloric restriction and regular physical exercise leads to marked weight loss, lowers blood pressure, and improves lipid profiles. These improvements come at the cost of a small deterioration in glycemic control. Detailed evaluation of the effects on glucose and lipid metabolism has been reported recently (22).
Our findings are in agreement with the observations of Alemzadeh et al. (15), who showed that 8 weeks of DZX treatment of hyperinsulinemic mainly female subjects with obesity caused a more than two times greater loss of FM compared with PL (−9.3 ± 1.0 vs −3.6 ± 0.9 kg, P < 0.01). In contrast, a second PL-controlled, 2-month study of similar design and also mainly including female subjects failed to confirm these results (18). The lack of effect in the latter study can be attributed to poor matching of baseline fasting insulin levels. BMI-adjusted, baseline fasting insulin levels were 31% lower in the PL arm, a difference that was nearly equivalent to the insulin-lowering effect of the 200-mg DZX dose that was used in the active arm. These circumstances caused insulin levels to converge to the same level, as observed in the PL group. As we have shown previously, as well as in the current study, the actual fasting insulin levels are critical determinants of the degree of fat loss. It was observed that clinically meaningful weight loss (>10 kg) only occurred if fasting insulin levels were below a specified limit, i.e., 4.5 mU/L in the van Boekel et al. study (16) and 5.5 mU /L in the current study. Therefore, it is not surprising that weight loss in the Due et al. study (18) was comparable in both groups, as all subjects were exposed to the same caloric restriction at a comparable insulin level.
Insulin suppression has also been obtained by treatment with octreotide (12, 23). Velasquez-Mieyer et al. (23) studied the effect of octreotide–long-acting release 40 mg every 4 weeks for 24 weeks in 44 subjects with obesity with a mean BMI of 44 kg/m2 and observed a 30% reduction of insulin levels, associated with a 3.6-kg reduction in body weight and a rise in mean HbA1c from 5.65% to 5.88%. Similar results of octreotide treatment were described by Lustig and Greenway (12). Although these findings support the importance of insulin suppression to achieve weight loss, it should be realized that octreotide has multiple actions that may have contributed to the weight loss observed in these studies. It is also important to note that weight loss and insulin suppression induced by octreotide were >50% less than achieved by DZX.
The current study included a treatment arm with the combination of DZX and MTF. MTF was added to reduce the possible risk of hyperglycemia induced by DZX and because of its reported effects on weight loss (24). PL-controlled trials in adolescents and adults who were nondiabetic, obese, and hyperinsulinemic have shown that MTF, in a dose of 1000 to 1700 mg/day for 2 to 6 months, induced a 3-kg PL-subtracted weight loss and improved insulin sensitivity (25, 26). In our study, however, addition of MTF did not potentiate weight loss, had no protective effect on fasting or peak glucose levels, and did not increase the effects on lipid levels. These results allowed us to combine the results of both DZX groups (Tables 2 and 4). The 12-month results were in line with the results observed in the 6-month, PL-controlled period (Fig. 2 and Table 4).
PL-associated weight loss at 6 months was over 8 kg, which was more than twice as high as commonly observed in other studies. Reported PL-associated weight loss in large trials is ∼3.4 kg (95% CI: −5.2 to −1.7 kg) at 6 months and 2.7 kg (95% CI: −4.2 to −1.4 kg) at 12 months (2, 3). The difference with our findings may be explained by the high motivation of participants to meet the advised lifestyle changes and demanding exercise requirements. The addition of DZX led to an additional loss of FM of over 6 kg during the first 6 months. Although PL treatment was discontinued at 6 months, a rough estimate of the PL-subtracted weight loss at 12 months can be made based on the PL results reported in the literature (Fig. 2).
The 1-year improvements in blood pressure and lipid levels were substantial and much larger than observed in previous medical intervention trials. At a 15-kg weight loss, these studies have shown a 3-mmHg decline in systolic and diastolic blood pressure, a decrease in TG levels of ∼0.45 mM, and a 15% decline in insulin levels (3, 27). The magnitude of changes in our trial was much greater and therefore, cannot be explained by weight loss only.
Several hypotheses have been forwarded to explain the decline in FM induced by insulin suppression, but the overall picture of all mechanisms involved remains incomplete (28). In addition to insulin’s direct peripheral effect on the adipocyte as a fat-storage hormone, selective insulin resistance has been proposed as an important mechanism (29, 30). Resistance to the glucose-lowering actions of insulin at muscle level combined with relative sensitivity to the lipogenic actions of insulin in adipose tissue will lead to substrate shunting from the muscle cell toward the adipocyte, induction of adipocyte hypertrophy and hyperplasia, and stimulation of differentiation of preadipocytes to adipocytes (31–33).
Insulin also affects hypothalamic function, where it acts as a suppressor of food intake and stimulator of energy expenditure in subjects who were nonobese, usually in synergism with leptin (34). However, individuals with obesity lose responsiveness to these signals despite their higher plasma insulin and leptin levels (35). Reversal of this cerebral insulin resistance may improve suppression of appetite and increase energy expenditure (36). In animal models, DZX treatment lowered serum insulin levels, improved muscle and cerebral insulin sensitivity, reduced lipid synthesis and storage, reduced food intake, and increased basal metabolic rate and weight loss (13, 19, 20). Finally, DZX may also exert a direct effect on adipocyte lipid metabolism through its binding to sulfonylurea receptors (37). Activation of these receptors reduces adipocyte lipogenesis and promotes lipolysis.
The current study has several limitations. It included only a limited number of men with a PL-controlled period of only 6 months. Therefore, it should be regarded as an explorative study that requires confirmation by larger studies, preferably PL controlled for at least 1 year. Another limitation is that the present data cannot be extrapolated to women. There is evidence to suggest that women may be more sensitive to the insulin-suppressive effects of DZX than men (17). Sex-specific treatment strategies may be needed. Finally, it did not address the effects that insulin suppression may have on protein metabolism. Insulin is known to promote skeletal muscular protein synthesis and to inhibit protein breakdown. Excessive lowering of insulin levels might induce a catabolic state with loss of muscle tissue. However, the PL-subtracted, 1.0-kg increase in LBM during the first 6 months of the study suggests that muscle protein catabolism did not occur. The trend toward a decrease in LBM during the extension period is not easily explained. This aspect deserves further evaluation in future studies. Long-term studies will also be needed to examine whether the cancer risk reduction and lifespan extension during insulin suppression in animal studies can be reproduced in men (38).
In summary, high-dose DZX-induced suppression of plasma insulin to a level of 5 mU/L or less and on top of increased physical exercise and moderate caloric restriction leads to a substantial loss of excess body fat and a substantial improvement of blood pressure and lipid levels. It remains to be demonstrated whether these beneficial effects outweigh the potentially adverse effects of a small rise in glucose levels. Before DZX can be advised for use in regular clinical practice, more details about the balance of risk vs benefit are needed.
Abbreviations:
- BMI
body mass index
- DZX
diazoxide
- fasting-Ins6/12
fasting insulin levels, measured at 6 and 12 months, respectively
- FM
fat mass
- Hb
hemoglobin
- LBM
lean body mass
- LDL
low-density lipoprotein
- MTF
metformin
- PL
placebo
- TG
triglycerides
- Δ
change
Acknowledgments
Clinical Trial Information: ClinicalTrials.gov no. NCT00631033 (registered November 2004).
Disclosure Summary: The authors have nothing to disclose.
