


Abstract
Despite apparent muscle weakness in overt or even subclinical hyperthyroidism, the effects of thyroid function in the reference range on muscle strength are unknown.
To investigate the association of serum TSH and free T4 with handgrip strength (HGS) in euthyroid elderly.
A nationally representative population-based, cross-sectional study from the Korea National Health and Nutrition Examination Surveys.
A total of 650 men aged ≥50 years and 533 postmenopausal women.
HGS was measured using a digital grip strength dynamometer, and low muscle strength was defined based on the Korean specific cutoff point of HGS (28.9 and 16.8 kg in men and women, respectively).
After adjustment for confounders, lower serum TSH but not free T4 was associated with lower HGS in men (P = 0.032). Compared with men with high-normal TSH, those with low-normal TSH consistently showed 5.0% lower HGS (P = 0.027), with a linear decrease in HGS across decreasing serum TSH quartiles (P for trend = 0.018). Men with low muscle strength had 22.0% lower serum TSH than those without (P = 0.015), and the odds for the risk of low muscle strength was 3.76 times higher among men with low-normal TSH than it was among those with high-normal TSH (P = 0.021). However, these associations were not observed in postmenopausal women.
These results suggest that serum TSH level at the lower end of reference range may be associated with low muscle strength, especially in older men.
Handgrip strength (HGS) is a measure of the maximum static force that the hand can squeeze around a dynamometer and is a reliable indicator of overall muscle strength (1, 2). Low HGS has been associated with various comorbidities, such as hypertension, diabetes, cardiovascular disease, stroke, and chronic obstructive pulmonary disease, as well as higher all-cause mortality rates (3–8). Considering these links, HGS has been suggested as a feasible “biomarker of aging” across the life course (9, 10). Importantly, low HGS is known as a clinical marker of poor mobility and a better predictor of clinical outcomes than is low muscle mass (11, 12). In addition, muscle strength is not dependent solely on muscle mass, and the relationship between muscle strength and mass is not linear (11, 13, 14). Therefore, more consideration of muscle strength per se, in addition to muscle mass in research and practice, is necessary to completely understand the roles of potential effectors on muscle health.
Thyroid hormone has pleiotropic effects on energy homeostasis, lipid and glucose metabolism, and blood pressure, and accumulating clinical evidence now indicates the critical role of thyroid function on human muscle health as well. For example, most patients with over hyperthyroidism have apparent muscle weakness (15, 16), which is markedly improved after treatment (17). Even a mild excess in thyroid hormone, called subclinical hyperthyroidism, has been related to low muscle strength and midthigh muscle cross-sectional area. However, these studies may contribute little to the maintenance of muscle health during aging because the prevalence of hyperthyroidism is relatively low, and most people at risk of age-related frailty have thyroid hormone levels in the reference range. Therefore, the question of whether an association between thyroid function and muscle metabolism also exists in the euthyroid range is clinically important. To address these issues, in the current study, we evaluated serum TSH and free T4 concentration in relation to HGS in community-dwelling euthyroid older adults.
Materials and Methods
Study population
This cross-sectional study was based on data acquired in the sixth edition of the Korea National Health and Nutrition Examination Survey (KNHANES) that was conducted between January 2014 and December 2015. This nationwide survey used a stratified, multistage, clustered probability sampling method to select a representative sample of the noninstitutionalized, civilian Korean population (18). The survey consisted of a health interview survey, nutrition survey, and health examination survey. The KNHANES database is publicly available at the KNHANES website (http://knhanes.cdc.go.kr; available in Korean and English). In 2014 and 2015, the surveys were completed by 14,930 participants. After excluding subjects who were not suitable for the measurement of HGS based on the following criteria—no hands, arms, or thumbs; paralysis of hands; cast on hands or fingers; bandage on hands or wrist; hand or wrist surgery in the prior 3 months; and pain, tingling, or stiffness in hands or wrist within the prior week—HGS was measured in all participants aged ≥10 years (n = 11,683). During this period, 4706 individuals aged ≥10 years were selected for the measurements for thyroid function using stratified subsampling and weighted to represent the total Korean population. Consequently, information about both HGS and thyroid function was available for 4457 subjects aged ≥10 years. Among them, we enrolled 1429 participants (759 men aged ≥50 years and 670 postmenopausal women) for the current study. Participants with liver cirrhosis, renal failure, neoplastic diseases, stroke sequelae, myocardial infarction/angina, thyroid diseases, and a history of taking thyroid-related medication were excluded from this study (n = 110) because these may affect thyroid function and/or muscle metabolism. Participants with abnormal TSH (<0.35 or >5.50 mIU/L) and/or abnormal free T4 (<0.89 or >1.76 ng/dL) levels were also excluded (n = 136). The remaining 650 men aged ≥50 years and 533 postmenopausal women were eligible for this study. All participants in the KNHANES survey provided informed consent. The KNHANES was reviewed and approved by the Ethics Committee of the Korea Centers for Disease Control and Prevention.
Measurement of HGS
HGS was measured using a digital grip strength dynamometer (T.K.K. 5401; Takei Scientific Instruments Co., Ltd., Tokyo, Japan), which measures between 5.0 and 100.0 kg of force and has an adjustable grip span. The minimum measurement unit is 0.1 kg. During the assessment, participants were asked to stand upright with their feet hip-width apart and to look forward with the elbow fully extended. The dynamometer was held by the testing hand in a neutral, comfortable position (not flexed or extended) with 90° flexion at the index finger. Participants performed three trials for each hand alternately, always starting with the dominant hand. Participants were instructed to squeeze the grip continuously with full force for at least 3 seconds. The time between each trial was approximately 60 seconds. Grip strength was defined as the average of three trials for the dominant hand (19). In this study, we adopted the Korean specific cutoff point of HGS for the definition of low muscle strength, which was generated by deriving –2 SD values of healthy young adults, as recommended by the European Working Group on Sarcopenia in Older People (11), and the cutoff values of HGS were 28.9 and 16.8 kg in men and women, respectively (19).
Measurement of thyroid function
Blood samples were drawn via venipuncture in the morning after overnight fasting, immediately refrigerated, and then transported to the Central Testing Institute in Seoul, Korea. Serum TSH and free T4 were analyzed using an electrochemiluminescence immunoassay (Roche Diagnostics, Manheim, Germany) within 24 hours after transport. Serum TSH was measured using an E-TSH kit (Roche Diagnostics), for which the reference range of the kit was 0.35 to 5.50 mIU/L. Serum free T4 was measured using an E-Free T4 kit (Roche Diagnostics), for which the reference range was 0.89 to 1.76 ng/mL.
Measurement of clinical and dietary parameters
All participants underwent a thorough physical examination. Age, body weight, height, smoking and drinking habits, and performance on resistance exercises such as push-up, sit-up, dumbbell exercise, and horizontal bar were recorded. Smoking habit and resistance exercise were categorized in three levels [e.g., never, past, or current and no, intermittent (1 to 3 days/week), or regular (≥4 days/week), respectively]. A standard drink was defined as a single glass of beer, wine, liquor, or the Korean traditional drink So-ju (Korean distilled liquor), and heavy alcohol drinking was indicated as “yes” when the participant had at least seven drinks at one time, more than twice a week, for men (at least five drinks for women). Height (cm) and weight (kg) were measured using standardized protocols while the participant was dressed in light clothing without shoes. Body mass index (kg/m2) was calculated from the height and weight.
Nutrient status, including total protein intake (g/d), was assessed using a 24-hour dietary recall questionnaire administered by a trained dietitian. The results were generated using the Food Composition Table developed by the National Rural Resources Development Institute (20).
Statistical analysis
Following the guideline of statistics from the Korea Centers for Disease Control and Prevention, all analyses were performed using the Complex Samples Plan, which is available as the complex samples option in SPSS Version 18.0 (SPSS, Inc., Chicago, IL). Survey sample weights were considered in all analyses to produce estimates that were representative of the noninstitutionalized civilian population in Korea (21). Data are presented as means with 95% CIs or as percentages, unless otherwise specified. The baseline characteristics were calculated using an unpaired t test for continuous variables or the χ2 test for categorical variables. To test the hypothesis that serum TSH level might be independently associated with HGS, we performed multiple linear regression analyses using an enter method with HGS as a dependent variable and with serum TSH level as an independent variable. Potential confounding factors, such as age, weight, height, smoking habit, heavy alcohol drinking, resistance exercise, and protein intake, which were selected on the basis of clinical applicability, were also simultaneously considered in these analyses. To further analyze the HGS changes according to serum TSH quartiles, multivariable-adjusted least squares means with 95% CIs were estimated and compared using analysis of covariance after adjustment for confounders. The trend of HGS across serum TSH quartiles was checked by examining P values for the trends using multiple linear regression analyses. The multivariable-adjusted least squares means with 95% CIs of serum TSH in terms of low muscle strength were also estimated and compared using analysis of covariance. To generate ORs with 95% CIs for low muscle strength according to serum TSH quartile categories, we performed multiple logistic regression analyses after adjustment for confounding variables. P < 0.05 was considered to indicate statistical significance.
Results
The clinical characteristics of 650 men aged ≥50 years and 533 postmenopausal women are shown in Table 1. The mean age of the men was 58.0 years (range, 50 to 80 years), and the mean age of the women was 59.0 years (range, 43 to 80 years). Men were taller, were heavier, and had higher rates of current smoking, heavy alcohol drinking, regular resistance exercise, and protein intake than women, whereas there was no difference in body mass index between men and women. Compared with women, HGS and serum free T4 level were 63.6% and 3.3% greater in men, respectively, and serum TSH level was 11.7% lower.
Baseline Characteristics of the Study Population
| Variables | Men (n = 650) | Women (n = 533) | P Value |
|---|---|---|---|
| Age, y | 58.0 (57.6–58.5) | 59.0 (58.3–59.6) | 0.012 |
| Weight, kg | 68.7 (67.7–69.7) | 58.3 (57.5–59.1) | <0.001 |
| Height, cm | 168.0 (167.4–168.5) | 155.5 (155.0–156.1) | <0.001 |
| Body mass index, kg/m2 | 24.3 (24.0–24.6) | 24.1 (23.8–24.4) | 0.353 |
| Smoking habit, % | <0.001 | ||
| Never | 14.9 | 91.8 | |
| Past | 48.6 | 3.9 | |
| Current | 36.5 | 4.3 | |
| Heavy alcohol drinking, % | <0.001 | ||
| No | 80.8 | 96.4 | |
| Yes | 19.2 | 3.6 | |
| Resistance exercise, % | 0.001 | ||
| No | 69.1 | 79.9 | |
| Intermittent | 14.0 | 11.2 | |
| Regular | 16.9 | 8.9 | |
| Protein intake, g/d | 80.0 (76.0–84.1) | 58.3 (55.2–61.4) | <0.001 |
| HGS, kg | 38.6 (38.1–39.2) | 23.6 (23.1–24.1) | <0.001 |
| Serum TSH, mIU/L | 2.26 (2.16–2.36) | 2.56 (2.45–2.68) | <0.001 |
| Serum free T4, ng/dL | 1.24 (1.22–1.25) | 1.20 (1.19–1.21) | <0.001 |
Values are presented as mean with 95% CIs unless otherwise specified. P values were determined using the Student t test for continuous variables and the χ2 test for categorical variables. Bold numbers indicate significant values.
Multiple linear regression analyses were performed to determine which covariates, including serum TSH level, were independently associated with HGS (Table 2). In both men and women, HGS had an inverse association with age and a positive association with weight and height. However, the independent positive associations of protein intake and serum TSH with HGS were observed only in men. Importantly, the statistical significance for the independent relationship between serum TSH and HGS persisted even after additional adjustment for serum free T4 level in the multivariable model in men (Supplemental Table 1). Meanwhile, there was no correlation between serum free T4 level and HGS, regardless of adjustment models, in both men and women (Supplemental Table 2).
Multiple Linear Regression Analysis to Determine Which Covariates Including Serum TSH Level Are Independently Associated With HGS
| Independent Variables | Dependent Variable: HGS | ||
|---|---|---|---|
| β | SE | P Value | |
| Men | |||
| Age | –0.239 | 0.045 | <0.001 |
| Weight | 0.111 | 0.037 | 0.003 |
| Height | 0.132 | 0.061 | 0.031 |
| Smoking habit | 0.488 | 0.427 | 0.254 |
| Heavy alcohol drinking | –0.286 | 0.787 | 0.716 |
| Resistance exercise | 0.081 | 0.402 | 0.839 |
| Protein intake | 0.019 | 0.008 | 0.023 |
| Serum TSH level | 0.640 | 0.297 | 0.032 |
| Women | |||
| Age | –0.153 | 0.035 | <0.001 |
| Weight | 0.066 | 0.025 | 0.008 |
| Height | 0.292 | 0.048 | <0.001 |
| Smoking habit | −1.030 | 0.585 | 0.079 |
| Heavy alcohol drinking | 1.783 | 1.084 | 0.101 |
| Resistance exercise | 0.451 | 0.291 | 0.122 |
| Protein intake | −0.005 | 0.010 | 0.606 |
| Serum TSH level | −0.027 | 0.190 | 0.886 |
The enter method is applied to this model with HGS as a dependent variable and with age, weight, height, smoking drinking habit, heavy alcohol drinking, resistance exercise, protein intake, and serum TSH level as independent variables simultaneously. Values are adjusted for all other variables in table. Bold numbers indicate significant values.
To investigate whether the association between serum TSH and HGS has a threshold effect, we divided the participants into quartiles according to serum TSH level in each sex (Fig. 1). In men, participants in the lowest serum TSH quartile (quartile 1) showed 5.0% lower HGS than those in the highest quartile (quartile 4) after adjustment for age, weight, height, smoking habit, heavy alcohol drinking, resistance exercise, and protein intake (P = 0.027). Consistently, in men, HGS linearly decreased across decreasing serum TSH quartiles. In contrast, in women, there was no significant difference in HGS among serum TSH quartiles in a multivariable adjustment model.
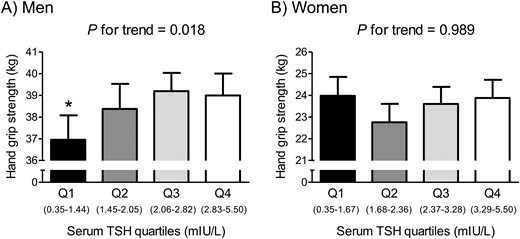
HGS according to serum TSH quartiles in (A) euthyroid men and (B) women. Values are presented as the estimated mean with 95% CIs after adjustment for confounding factors using analysis of covariance. Asterisk indicates statistical significant difference from the Q4. Confounding variables include age, weight, height, smoking habit, heavy alcohol drinking, resistance exercise, and protein intake. Q, quartile.
Among 650 men aged ≥50 years and 533 postmenopausal women, 7.5% of men and 10.7% of women belonged to the low muscle strength group based on HGS. After adjustment for confounders, participants with low muscle strength had a 22.0% lower serum TSH level than those without this condition with statistical significance in men (Fig. 2). However, the serum TSH level was not significantly different between participants with and without low muscle strength in women.
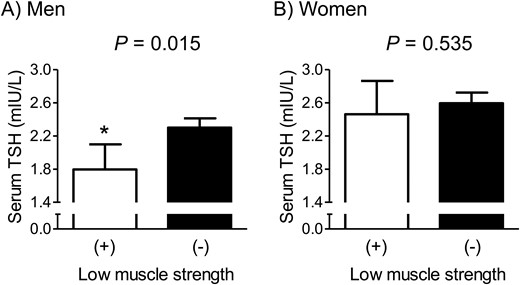
Difference in serum TSH concentration between subjects with and without low muscle strength in (A) euthyroid men and (B) women. Values are presented as the estimated mean with 95% CIs after adjustment for confounding factors using analysis of covariance. Asterisk indicates statistical significant difference from the control. Confounding variables include age, weight, height, smoking habit, heavy alcohol drinking, resistance exercise, and protein intake. The cutoff values of HGS to define low muscle strength were 28.9 and 16.8 kg in men and women, respectively.
Multiple logistic regression analyses were performed to determine ORs for low muscle strength according to serum TSH quartile categories (Table 3). In men, after adjustment for age, weight, height, smoking habit, heavy alcohol drinking, resistance exercise, and protein intake, the odds for the risk of low muscle strength was 3.76 times higher among participants in quartile 1 than it was among those in quartile 4. However, the OR for low muscle strength according to the serum TSH quartiles was not significant in women.
Multiple Logistic Regression Analyses to Determine the ORs for Low Muscle Strength According to Serum TSH Quartile Categories
| Men: Low Muscle Strength (HGS <28.9 kg) | Women: Low Muscle Strength (HGS <16.8 kg) | ||||||
|---|---|---|---|---|---|---|---|
| TSH Quartiles | Prevalence, % | OR (95% CI) | P Value | TSH Quartiles | Prevalence, % | OR (95% CI) | P Value |
| Q1 (0.35–1.44 mIU/L) | 13.3 | 3.76 (1.22–11.59) | 0.021 | Q1 (0.35–1.67 mIU/L) | 13.5 | 1.13 (0.40–3.18) | 0.822 |
| Q2 (1.45–2.05 mIU/L) | 8.7 | 0.97 (0.30–3.16) | 0.963 | Q2 (1.68–2.36 mIU/L) | 11.9 | 1.25 (0.41–3.80) | 0.696 |
| Q3 (2.06–2.82 mIU/L) | 2.5 | 0.41 (0.10–1.77) | 0.231 | Q3 (2.37–3.28 mIU/L) | 9.0 | 0.97 (0.34–2.83) | 0.961 |
| Q4 (2.83–5.50 mIU/L) | 6.1 | 1 (Reference) | Q4 (3.29–5.50 mIU/L) | 8.3 | 1 (Reference) | ||
Adjusted confounding variables include age, weight, height, smoking habit, heavy alcohol drinking, resistance exercise, and protein intake. Bold numbers indicate significant values.
Abbreviation: Q, quartile.
Discussion
In this nationally representative population-based cohort of euthyroid older adults, we observed that lower serum TSH level was associated with lower HGS in men, and men with low muscle strength had a markedly lower serum TSH level after adjustment for confounders. Consistently, when we divided the participants into TSH quartiles, men with a low-normal TSH concentration had lower HGS and higher odds for low muscle strength than those with a high-normal TSH level. However, these associations were not significant in women. To our knowledge, this is the first report showing the relationship between thyroid function and muscle strength in participants with TSH and free T4 levels within the reference range.
The muscle weakness in overt hyperthyroidism that is associated with low or undetectable TSH levels has traditionally been explained by the actions of elevated thyroid hormone, such as muscle fiber-type switching (22, 23). Therefore, there is a possibility that the observed association between low TSH and low HGS in the current study may be attributable to a secondary change related to a high thyroid hormone level, because serum TSH is the most sensitive and specific indicator of the thyroid axis (24). However, there was no correlation between serum free T4 level and HGS in this euthyroid cohort, and the association of serum TSH level with HGS remained significant after additional adjustment for serum free T4 in the multivariable model. These findings suggest that TSH could directly modulate muscle metabolism, independently of thyroid hormone, as observed in the case of bone remodeling (25). In fact, recent studies have reported the presence of the TSH receptor in skeletal muscle cells (26, 27), further supporting this speculation. Although the exact role of TSH receptor signaling in skeletal muscle needs more investigation, we believe that our present study could provide important clinical background for upcoming experimental studies into this issue.
A result of particular interest in the current study is that the positive relationship of serum TSH with HGS was observed only in elderly men, not in postmenopausal women. We speculate that this may be largely attributable to the abrupt decrease in estrogen in these women, as well as the sex difference. More specifically, the rapid decrease in estrogen levels after menopause is the most important biological event that causes major changes in homeostasis in women. With respect to muscle metabolism, there is evidence that muscle tissue expresses estrogen receptors, and thus, estrogen deficiency can directly affect muscle homeostasis (28). Furthermore, menopause-associated excessive adiposity and the resultant lipotoxicity may contribute to the negative muscle balance (29). Therefore, we assume that the effects of the considerable changes caused by estrogen deficiency in postmenopausal women may be strong enough to counteract those of TSH in the reference range on muscle metabolism. Further studies focusing on how male and female hormones interact with thyroid function in relation to muscle could be highly interesting.
Because relatively larger data sets are available from healthy individuals than those with overt or subclinical thyroid diseases, many studies have been performed about the effects of variation in thyroid function across the reference range on health outcomes in these populations. In general, low-normal TSH levels were associated with beneficial effects on cardiovascular, metabolic, and pregnancy outcomes with good quality of evidence (30). In contrast, lower TSH levels within the reference range may have adverse effects on bone, independently of thyroid hormone levels, through the increased risk of osteoporosis and fracture (31–33). In addition, in the current study, we first reported that serum TSH level at the lower end of the reference range could be associated with lower muscle strength in men. Therefore, considering the paradox between protective and detrimental associations of TSH with various health parameters, normal thyroid function should be very cautiously interpreted in the clinical setting. We agree that a high TSH level, especially >10 mIU/L with certain conditions, could be treated to reduce the cardiovascular risk, as recommend by the American Thyroid Association guidelines (34); however, overtreatment should be avoided to maintain bone and muscle health. From the same point of view, the optimal serum TSH levels for the treatment of abnormal thyroid function need to be individualized after evaluating the musculoskeletal and cardiovascular risk for each person, especially in older men.
Several published studies have shown the association between serum TSH level within the reference range and adiposity (35), and thus it is possible that increased adiposity may contribute to our observed findings. However, when we adjusted for waist circumference, as an indirect index of body adiposity, in addition to multivariable confounding factors including weight and height, the significant positive association between serum TSH level and HGS in men persisted (β = 0.624, P = 0.034), suggesting that body adiposity may not be the critical mediator in their association.
The major strength of our study is that it is a large population-based study using well-collected national data, which enhances the statistical reliability of the results and the generalizability of the data. We also used the Korean specific cutoff point of HGS for low muscle strength, as recommended by the Asian Working Group for Sarcopenia (2) and the European Working Group on Sarcopenia in Older People (11), because these values can be different depending on ethnicities, body size, lifestyle, and cultural backgrounds. Despite these strengths, several limitations should be considered when interpreting our data. First, because it was a cross-sectional study, we could not determine whether there was a causal relationship between serum TSH level and HGS. Second, the lack of repeated assessments of thyroid hormone levels might have resulted in some errors in measurements of the serum levels because there are diurnal variations in thyroid hormone levels. However, all blood samples in the KNHANES were consistently drawn in the morning after overnight fasting, and thus this might minimize such errors. Third, the levels of T3 or free T3, which may have an important role in skeletal muscle homeostasis (36), were not measured in the KNHANES. Thus, we cannot exclude the possibility that serum T3 level in the reference range could be related to HGS, even if T4 was not. Fourth, our study population was exclusively Korean, and thus we cannot be certain that our results would be applicable to other populations, particularly Caucasians. Last, although we attempted to apply strict exclusion criteria and consider as many covariates as possible, the observed findings could have resulted from uncontrolled comorbidities or medications that affect serum TSH and/or muscle metabolism, such as nonthyroidal illness and the usage of glucocorticoids.
In summary, data gathered from a nationally representative cohort demonstrate that a low-normal serum TSH level was associated with lower HGS and a higher risk of low muscle strength in euthyroid elderly men. However, these associations were not observed in euthyroid postmenopausal women. These results suggest that the reference range of TSH may not be optimal from the viewpoint of muscle health and that avoiding low-normal serum TSH concentrations may help to maintain muscle strength, particularly in older men.
Abbreviations:
Acknowledgments
Financial Support: This article was supported by grants from the Korea Health Technology R&D Project, Ministry of Health and Welfare, Republic of Korea (project no. HI14C2258, to B.-J.K.), and from the Bio & Medical Technology Development Program of the National Research Foundation, funded by the Korean government, MSIP (project no. 2016M3A9E8941329, to B.-J.K.).
Disclosure Summary: The authors have nothing to disclose.
