


Abstract
Standard treatment of hypoglycemia is oral carbohydrate, but it often results in hyperglycemia and entails extra caloric intake.
To evaluate low-dose glucagon to treat mild hypoglycemia in ambulatory adults with type 1 diabetes (T1D).
Randomized crossover trial (two 3-week periods).
Five U.S. diabetes clinics.
Twenty adults with T1D using an insulin pump and continuous glucose monitor (CGM) and experiencing frequent mild hypoglycemia.
Nonaqueous mini-dose glucagon (MDG) (150 µg) to treat nonsevere hypoglycemia.
Successful treatment was defined as blood glucose (BG) ≥50 mg/dL 15 minutes and ≥70 mg/dL 30 minutes after intervention, on the study meter. Two authors, blinded to treatment arm, independently judged each event as a clinical success or failure.
Sixteen participants (mean age 39 years, 75% female, mean diabetes duration 23 years, mean hemoglobin A1c 7.2%) had 118 analyzable events with initial BG of 50 to 69 mg/dL. Successful treatment criteria were met for 58 (94%) of 62 events during the MDG period and 53 (95%) of 56 events during the glucose tablets (TABS) period (adjusted P = 0.99). Clinical assessments of success for these events were 97% and 96%, respectively. CGM-measured time in range did not differ between treatment groups during the 2 hours after events, but TABS resulted in higher maximum glucose (116 vs 102 mg/dL; P = 0.01) over the first hour.
Low-dose glucagon can successfully treat mild hypoglycemia and may be a useful alternative to treatment with oral carbohydrate when trying to avoid unnecessary caloric intake.
Many people with type 1 diabetes (T1D), particularly those under tight metabolic control, experience mild hypoglycemia on a daily or near-daily basis (1–4), for which treatment consists of oral carbohydrate and is generally successful. However, carbohydrate treatment often results in hyperglycemia (5), prompting additional insulin administration, which can result in more hypoglycemia. Thus, regaining glycemic control may take hours. Additionally, treatment with oral carbohydrate leads to consumption of extra calories by people who may be trying to maintain or decrease their body weight (6).
Rescue dose (1 mg) glucagon preparations are commercially available for treatment of severe hypoglycemia. Smaller doses (20 to 150 µg) of glucagon have been useful when a person with T1D is unable to eat (e.g., young children who refuse or people with gastroenteritis or other illnesses). Haymond et al. first reported that administration of glucagon by the subcutaneous route at a dosage of 10 µg per year of age up to 150 µg was sufficient to increase plasma glucose transiently (over 30 minutes) by 60 to 80 mg/dL and that repeated doses could be used for subsequent mild hypoglycemic events without a worsening of nausea or vomiting (7). This approach was confirmed in reports of the use of mini-dose glucagon (MDG) in a pediatric practice in Australia (8), a summer camp for children with diabetes (9), and inpatient settings (10–12).
The use of small doses of glucagon for nonsevere hypoglycemia has been limited by the need to reconstitute the glucagon preparation before injection and the limited time during which it can be used once reconstituted. Xeris Pharmaceuticals, Inc. (Austin, TX) has developed a room temperature–stable, nonaqueous liquid form of glucagon for subcutaneous injection. Xeris’ glucagon formulation has been tested for ability to increase blood glucose (BG) in healthy, nondiabetic fasted adults, and therapeutic equivalence was demonstrated between 1-mg doses of Xeris’ G-Pen™ (glucagon injection) and Eli Lilly Glucagon (Eli Lilly and Company, Indianapolis, IN) (10). This preparation also was studied in adults with T1D at doses of 75, 150, and 300 µg. The 150-µg dose appeared optimal for treating mild hypoglycemia because it resulted in a consistent glycemic response of 60 to 70 mg/dL after both an overnight fast and mild insulin-induced hypoglycemia. Additionally, it was not accompanied by complaints of nausea, as observed in some participants using the 300-µg dose (11). This investigation was conducted under rigorously controlled inpatient conditions that do not necessarily reflect how this new formulation of glucagon might be effective under more clinically relevant conditions in the outpatient setting.
Therefore, the current study was conducted to assess the use of nonaqueous MDG compared with oral glucose tablets (TABS) for treatment of nonsevere hypoglycemia in an outpatient randomized crossover design clinical trial.
Study Design and Methods
The study was conducted at five centers in the T1D Exchange Clinic Network with an investigational new drug approval from the US Food and Drug Administration to conduct the study. The institutional review board of each center approved the protocol, and written informed consent was obtained from each participant. The protocol is listed on clinicaltrials.gov (NCT02411578).
Study participants
Major inclusion criteria included a clinical diagnosis of presumed autoimmune T1D for ≥2 years, age 18 to <65 years, hemoglobin A1c level <8.5%, use of a continuous glucose monitor (CGM) ≥6 days per week during the previous 4 weeks, use of an insulin pump for ≥3 months (with no use of active low-glucose suspend feature within the previous month), and CGM glucose concentration <70 mg/dL during daytime hours on ≥7 of the past 28 days (see Supplemental Table 1 for full eligibility criteria).
Synopsis of study protocol
The study included a 2-week run-in phase, followed by a 6-week randomized crossover trial, and then a 3-week extension phase. A study-provided Bayer Contour Next EZ meter (Bayer Corporation, Seattle, WA) was used during the run-in phase for the first six participants, and a Roche Accu-Chek Aviva Connect meter (Roche Holding AG, Basel, Switzerland) was used during the run-in phase, crossover trial, and extension phase.
The run-in phase was conducted to assess frequency of hypoglycemia and compliance with study procedures. To continue into the crossover trial, the participant had to have ≥3 of 14 days with at least one CGM value <70 mg/dL during daytime hours and to have complied with the study treatment protocol for BG testing and use of assigned study treatment to prevent or correct low BG. Two participants did not successfully meet the hypoglycemia criteria, and three additional participants withdrew.
The crossover trial consisted of two randomly assigned 3-week periods. During one period the participant used MDG and during the other period TABS.
During the extension phase, the participant could choose to use either MDG or TABS for each hypoglycemic event. All other aspects of this phase were identical to those of the other treatment periods.
A questionnaire regarding both treatments was completed at the end of the crossover trial and again at the end of the extension phase.
Study medication
Vials of nonaqueous, liquid, ready-to-use G-Pen Mini™ (glucagon injection) were provided by Xeris Pharmaceuticals, Inc. The glucagon was self-administered by study participants subcutaneously via a disposable, off-the-shelf, 0.3-mL CE-marked insulin syringe called Insulution™ Daily Dose (Insulution AB, Stockholm, Sweden), which was previously confirmed to be compatible with Xeris’ glucagon formulation. Dex4™ TABS (4 g) (CanAm Care LLC, Alpharetta, GA) were provided for the TABS phase.
Treatment of hypoglycemia or impending hypoglycemia
Criteria for treatment were the same in the run-in phase, crossover trial, and extension phase. Participants were instructed to obtain a BG meter (BGM) measurement when the CGM glucose concentration was <70 mg/dL, when they experienced hypoglycemic symptoms, or when the CGM glucose was trending down and the participant intended to treat to prevent hypoglycemia. In these situations when BG was ≥40 mg/dL, study treatment was used (referred to as a study treatment event) assuming none of the following situations were present, for which participants were advised to treat with oral carbohydrates: the start of a meal was within 30 minutes, exercise was being performed or about to commence, or it was overnight (30 minutes before sleep until awakening the next morning). Severe hypoglycemia necessitating third-party assistance or BG concentrations <40 mg/dL were treated as needed with carbohydrates or commercially available rescue glucagon preparations.
When the BG was 50 to 69 mg/dL, treatment was 150 µg of glucagon or 16 g of TABS (depending on study period). The glucagon dosage was based on the results of the clinical research center study of Haymond et al. (11), and the TABS dosage was the dosage recommended for treating mild hypoglycemia (13). When the BG was 40 to 49 mg/dL, treatment was doubled (300 µg of glucagon or 32 g of TABS). After 15 minutes, the BG concentration was to be rechecked on the BGM. If the BG was 60 to 69 mg/dL, participants were to provide no further treatment. If the BG was 50 to 59 mg/dL, participants were to retreat with a single dose of study treatment. If BG was <50 mg/dL, participants were to use their preferred oral carbohydrate (for both periods). Thirty minutes after treatment, the BG concentration was to be checked again on the BGM. If <70 mg/dL, treatment was participant’s preferred oral carbohydrate. A low BG concentration occurring within 2 hours of the initial low BG was considered part of that same event.
If the glucose concentration was trending down on the CGM and the participant was considering treatment to prevent hypoglycemia, a BGM measurement was to be made. If the participant decided to treat, the protocol dosage was 150 µg of glucagon or 16 g of TABS (dependent on the period). BG was to be checked again after 30 minutes.
Hypoglycemic event data collection
Hypoglycemic event information was entered by the participant in real time via the Glooko Device System (Glooko Inc., Palo Alto, CA) on a smartphone. The Glooko mobile application contained the Joslin HypoMapTM, which was customized for the study and used to capture symptoms, causes, and treatment (time and dose) associated with the hypoglycemic event. A BG measurement <70 mg/dL on the study meter prompted the participant to complete a survey and provided reminders 15 minutes and 30 minutes after treatment to recheck the glucose on the study meter.
Clinical grading of outcome
Two authors (M.W.H., R.W.B.), blinded to treatment arm, independently graded each event as a clinical failure or success based on all available BG concentrations within 1 hour of initial treatment. All BG values, along with corresponding time elapsed since treatment, were reviewed to determine whether the response would be considered a treatment success, in a clinical setting. Discordant gradings (6% of events) were adjudicated by the graders to achieve a consensus grading.
Statistical analyses
The sample size was selected for feasibility and not based on statistical principles. For the crossover trial primary analysis, analyzed events were study treatment events meeting the following criteria: a HypoMap survey was completed, the initial BG measurement was 40 to 69 mg/dL, BG measurements were performed at both the 15-minute (in a window of 13 to 20 minutes) and 30-minute (28 to 40 minutes) time points, and appropriate treatment including dose was taken both at the initial and 15-minute time points. Prevention events were considered analyzable if a BG measurement was performed at the 30-minute (in a window of 29 to 40 minutes) time point, and appropriate treatment including dose was taken at the initial time point.
The primary outcome was the proportion of events in which the BG concentration was both ≥50 mg/dL 15 minutes after and ≥70 mg/dL 30 minutes after the initial treatment of a hypoglycemic event, limited to events with an initial BG of 50 to <70 mg/dL. The proportions of successes in each treatment arm were compared via a generalized linear mixed model with a logistic link function, random participant effect to account for correlated data from some participants having multiple events, and adjustment for baseline BG. As a sensitivity analysis, the primary analysis was repeated excluding participants who had analyzable events during only one of the two periods of the crossover trial. The analysis also was repeated with the consensus clinical gradings for the same events used in the primary analysis. In addition, two other analyses were conducted with the clinical gradings; one included all events in which the initial treatment and dosage were correct, irrespective of the timing of the BG measurements, and the other limited the events to those in which both the initial and 15-minute treatment and dosage were correct.
CGM metrics [mean glucose, time in range (70 to 180 mg/dL), time <70 mg/dL, and coefficient of variation] were computed over the 3 weeks of each treatment period (including all available CGM data) for participants who had ≥72 hours of CGM data during each period and then again limited to participants who had ≥252 hours of CGM data for each period. CGM metrics also were computed on the event level, including all CGM readings 1 hour after and 2 hours after the initial treatment of a hypoglycemic event (for events with an initial BG concentration of 50 to 69 mg/dL). To be included in the event-based analyses, the participant had to have sufficient calibration BG measurements on the study BGM to compare BGM and CGM data to ensure matching dates and times. Additionally, the following requirements had to be met on the event level for CGM data to be included: the initial treatment and dosage had to be correct, ≥6 CGM readings had to be available within 1 hour after the initial treatment, and the first CGM glucose after the start of the hypoglycemic event had to be <80 mg/dL. CGM metrics were analyzed with an analogous generalized linear mixed model with an identity link for continuous outcomes. Because of violations of normality, rank transformations (van der Waerden scores) were used in the models.
Results
Participant characteristics
Twenty participants entered the crossover trial between November 2015 and March 2016, 19 of whom completed both treatment periods. One participant completed the TABS period of the crossover trial and then dropped from the study because of a positive pregnancy test (see Supplemental Figure 1 for flowchart of study enrollment and completion). A total of 16 participants had one or more hypoglycemic events that met criteria for analysis during the crossover trial; mean ± standard deviation age was 39 ± 11 years, 75% were female, and all were non-Hispanic white. Duration of T1D was 23 ± 15 years, and hemoglobin A1c was 7.2 ± 0.8% (Supplemental Table 2). Of the 123 analyzable events, 118 events had an initial BG of 50 to 69 mg/dL, and 5 had an initial BG of 40 to 49 mg/dL. Figure 1 indicates the reasons for exclusion of events.
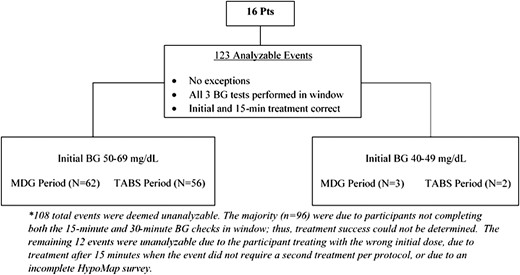
Accounting of hypoglycemic events in crossover trial analysis. Pts, participants.
BG outcome analyses
Among the 118 analyzable events with an initial BG of 50 to 69 mg/dL, success criteria were met for 58 (94%) of the 62 events during the MDG period and 53 (95%) of the 56 events during the TABS period (adjusted P = 0.99). Results were similar when limited to the 12 participants who had analyzable events during both periods of the crossover trial (data not shown). Events from both periods started with similar median initial BG concentrations (60 mg/dL for MDG-treated events and 62 mg/dL for TABS-treated events), but the TABS period had higher median 15-minute (P < 0.001) and 30-minute BG concentrations (P < 0.001, Figure 2). Table 1 shows the results of the consensus clinical gradings of success, which largely paralleled the results described previously. Insulin on board (IOB) at the start of each hypoglycemic event with available pump data appeared to be similar for both periods [median = 0.6 for MDG (n = 51) and median = 0.8 for TABS (n = 25)]. Among available data, median IOB was 0.6 units among successes (n = 71) and 2.3 units among failures (n = 5). IOB was available for all four failures during the MDG period (0.1, 2.3, 2.5, and 1.5 units) and for one of three failures during the TABS period (3.4 units).
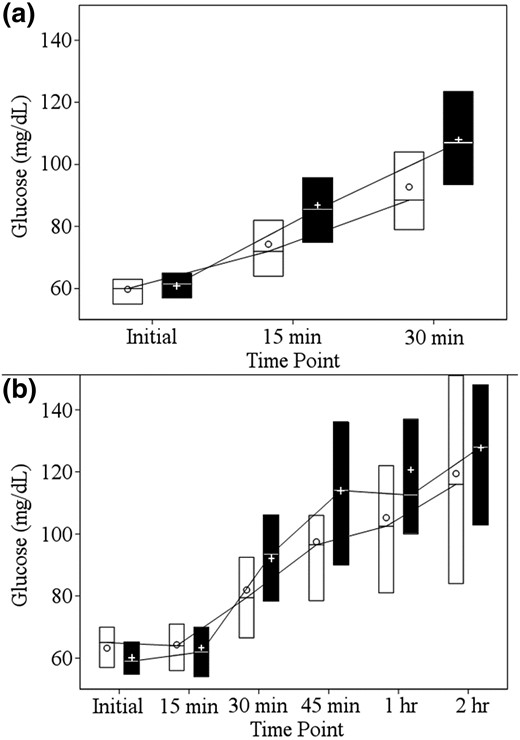
Glucose concentrations by treatment arm after hypoglycemia treatment. (a) BGM data from the primary analysis. (b) CGM data 2 hours after each hypoglycemic event. The white boxes represent summary data from events during the MDG period, and the black boxes represent summary data from events during the TABS period. The lower and upper limits of each box denote the 25th and 75th percentiles, respectively. The line dividing each box denotes the median. The circles represent the mean for events during the MDG period and the plus signs represent the mean for events during the TABS period.
Successes in Each Treatment Period
| MDG Period | TABS Period | P | |
|---|---|---|---|
| Primary outcome | (N = 62) | (N = 56) | |
| Success, n (%) | 58 (94%) | 53 (95%) | 0.99 |
| Clinical grading: primary analysis eventsa | (N = 59) | (N = 56) | |
| Success, n (%) | 57 (97%) | 54 (96%) | 0.93 |
| Clinical grading: initial and 15-min treatment correctb | (N = 69) | (N = 67) | |
| Success, n (%) | 66 (96%) | 63 (94%) | 0.66 |
| Clinical grading: initial treatment correctc | (N = 95) | (N = 92) | |
| Success, n (%) | 84 (88%) | 88 (96%) | 0.08 |
Three hypoglycemic events deemed indeterminate during MDG period and zero during TABS period.
Four hypoglycemic events deemed indeterminate during MDG period and zero during TABS period.
Eight hypoglycemic events deemed indeterminate during MDG period and four during TABS period.
Among the five analyzable events with an initial BG of 40 to 49 mg/dL, success criteria were met for two of three events during the MDG period and both events during the TABS period. Among the prevention events, success criteria were met for three of four events during the MDG period and all five during the TABS period.
CGM glucose analyses
CGM data were available for 15 participants [8 Dexcom G4 (Dexcom Inc., San Diego, CA), 2 Dexcom G5, 5 Medtronic Enlite (Medtronic, Northridge, CA)]. For the CGM metrics computed over the course of each 3-week treatment period, results did not differ by treatment period for mean glucose concentration, time in range (70 to 180 mg/dL), time <70 mg/dL, or coefficient of variation (all Ps ≥ 0.13; Supplemental Table 3). Results were similar when we excluded the two participants who did not have ≥252 hours of CGM data during each period of the crossover trial (data not shown).
CGM glucose concentrations 1 hour and 2 hours after hypoglycemic events (BGM 50 to 69 mg/dL) were available for 84 events. Over the first hour after the start of each hypoglycemic event, no statistically significant difference was found between events treated with MDG or TABS for the minimum CGM glucose concentration, time at 70 to 180 mg/dL, and time <70 mg/dL. Events treated with TABS had a higher maximum CGM glucose concentration (median 116 vs 102 mg/dL; P = 0.01) and a higher mean glucose concentration (median 87 vs 79 mg/dL; P = 0.02) compared with events treated with MDG (Table 2). CGM glucose concentration reached 100 mg/dL or increased by 30 mg/dL within 1 hour after a hypoglycemic event for 31 (65%) of 48 events during the MDG period and 30 (83%) of 36 events during the TABS period (P = 0.03).
CGM Metrics by Treatment Arm After Each Hypoglycemic Event With Starting BG Concentration 50 to 69 mg/dL
| MDG Period (N = 48 Events) | TABS Period (N = 36 Events) | P | |
|---|---|---|---|
| During first 1 hour after start of hypoglycemic event, median (25th, 75th percentile) | |||
| Minimum glucose, mg/dL | 59 (52, 66) | 56 (52, 60) | 0.34 |
| Maximum glucose, mg/dL | 102 (83, 119) | 116 (98, 143) | 0.01 |
| Mean glucose, mg/dL | 79 (69, 91) | 87 (77, 102) | 0.02 |
| Percentage time in range | 62% (42%, 79%) | 67% (58%, 71%) | 0.86 |
| Percentage time <70 mg/dL | 35% (13%, 58%) | 33% (26%, 42%) | 0.95 |
| During first 2 hours after start of hypoglycemic event, median (25th, 75th percentile) | |||
| Minimum glucose, mg/dL | 57 (51, 65) | 56 (52, 60) | 0.78 |
| Maximum glucose, mg/dL | 122 (102, 159) | 139 (116, 161) | 0.21 |
| Mean glucose, mg/dL | 95 (77, 113) | 108 (89, 119) | 0.09 |
| Percentage time in range | 79% (50%, 88%) | 79% (69%, 86%) | 0.49 |
| Percentage time <70 mg/dL | 20% (9%, 40%) | 19% (13%, 25%) | 0.63 |
Results were similar when we evaluated CGM data over the 2 hours after the start of each hypoglycemic event, although the differences in maximum glucose concentration and mean glucose were no longer statistically significant (Table 2).
Extension phase
Seventeen participants continued in the extension phase. During this 3-week period, 15 of the 17 participants had a total of 62 study treatment events in which a HypoMap survey was initiated and the initial BG was 40 to 69 mg/dL. Of these, participants chose to treat 40% of events with MDG and 60% with TABS. Five participants reported a total of 16 events treated to prevent hypoglycemia; half of prevention events were treated with MDG and half with TABS.
Participant questionnaire data
At the end of the crossover trial, 17 participants reported using MDG at least once and 15 reported using TABS at least once. Of those who had used MDG, 1 participant reported no discomfort from the injections, 11 participants reported tolerable discomfort, and 5 participants indicated that the discomfort was sufficient to warrant not using it. The majority of participants reported no nausea with the MDG (14 out of 17; 82%) or TABS (14 out of 15; 93%). At the end of the extension phase, 100% reported no nausea for both treatments. In a free text field inquiring about likes and dislikes of the glucagon, there were a few recurring comments. Participants disliked the injection site discomfort and having to give injections in public but liked not having to consume extra calories and that the glucagon did not cause a spike in BG.
Safety outcomes
No serious adverse events were reported during the study. Adverse events included an unintended pregnancy, upper respiratory infection, and streptococcal sore throat. None were related to study drug or procedures.
Discussion
Whereas previous studies conducted in controlled environments have demonstrated an adequate glucose rise after administration of MDG, the current study provided a real-world, outpatient comparison of MDG with TABS in adults with T1D using both insulin pump delivery and CGM systems. Responses to both therapies were found to be similar as assessed by both BGM and CGM measurements. In addition, two observers, blinded to the therapy used, evaluated the glycemic responses in each event and found general concordance with the results of the primary analysis. Despite the overall similarities in responses between TABS and MDG, subtle differences were observed between the two. Oral TABS (16 g) resulted in a slightly earlier and higher maximum glycemic response than observed with MDG. There was no evidence of hyperglycemia with either therapy, based on both BGM and CGM data. Both treatments resulted in similar peak glucose concentrations at 2 hours (Figure 1). Thirteen percent (8 of 62) of the analyzable hypoglycemic events during the glucagon period necessitated repeat dosing due to failure to achieve a BG concentration ≥60 mg/dL within 15 minutes, compared with 5% (3 of 56) with TABS. There were too few occurrences of treatment of impending hypoglycemia for a meaningful analysis. The association of treatment failure with IOB suggests a lower response with higher IOB, which is in keeping with a smaller glycemic response to MDG after insulin injection (11).
We were surprised at the absence of significant hyperglycemia with the use of oral glucose. Although 16 g of TABS was effective in this study, patients commonly use a variety of carbohydrate sources at hand, with less attention to the composition or amount of carbohydrate ingested. Perhaps because of the uncomfortable feelings associated with symptomatic hypoglycemia or the fear of progression to severe hypoglycemia, most people overtreat mild to moderate hypoglycemic episodes, consuming two or more times the equivalent to the 16 g used in the current study, resulting in loss of targeted glycemic control over the course of hours or even longer.
Despite the potential advantage of using MDG to treat mild hypoglycemia in this proof of principle study, there were detractors. Participants experienced inconsistent and transient discomfort at the injection sites, not only in this study but in a previous report (11). In addition, participants reported the inconvenience of filling disposable syringes and the embarrassment of taking an injection in public. Although some reported mild nausea with the use of this glucagon preparation, it is of interest that one participant also experienced mild nausea after the use of TABS. Therefore, it is not clear whether this symptom is the result of the hypoglycemia or an independent effect of either oral glucose or the glucagon preparation. When given the choice of oral glucose or MDG during the extension phase, about half of the participants chose MDG and half TABS, suggesting that the discomfort and inconvenience of MDG were not sufficient to exclude its elective use. Because the Xeris glucagon product is stable for up to several years, the development of a reusable device (e.g., pen injector) and a reduction in the inconsistent and transient discomfort with injections could overcome nearly all perceived drawbacks of this product.
There are several limitations of the study to be considered. The first is that the participants in this study routinely used both an insulin pump and CGM device and therefore are not representative of most adults with T1D. Participants had to demonstrate frequent mild hypoglycemia before the trial so that sufficient numbers of hypoglycemic episodes would be expected to occur to meet the objective of the study protocol. Sample size was also a limitation. Although studying a larger number of participants would have been ideal, the sample size was selected for feasibility. The study could have been longer, but two 3-week periods were chosen for the crossover trial to reduce the possibility of participant fatigue and dropout, which would have hindered the overall objective. Another limitation of the study is that both limbs of the interventions were tightly controlled, limiting the amount and composition of oral carbohydrate used for the hypoglycemic episodes, and the TABS period was probably not representative of how patients usually treat hypoglycemic episodes. The potential detrimental practice of overtreatment resulting in hyperglycemia and additional caloric intake could not be assessed with this study design. Additional studies of participants’ usual treatment of mild to moderate hypoglycemia compared with MDG are necessary to demonstrate the true clinical benefit of MDG.
If the need for additional calorie intake is minimized, patients with T1D using MDG may be more apt to achieve their body weight goals. Importantly, recent data from the T1D Exchange demonstrate that two-thirds of adults >26 years of age are classified as overweight or obese, highlighting the need to determine strategies to minimize weight gain while allowing these individuals to achieve targeted control (14).
Conclusions
MDG was demonstrated to provide generally effective glycemic responses while avoiding unnecessary caloric intake. Although it was well tolerated, there remain areas for improvement: reducing or eliminating the inconsistent transient discomfort at injections sites, packaging in a patient-friendly reusable device, and refining the dosage to be used to optimize the glycemic response in a variety of clinical conditions while minimizing the occurrence of transient mild nausea. The current study demonstrates the potential for MDG use as an alternative to TABS in clinical practice.
Abbreviations:
- BG
blood glucose
- BGM
blood glucose meter
- CGM
continuous glucose monitor
- IOB
insulin on board
- MDG
mini-dose glucagon
- T1D
type 1 diabetes
- TABS
glucose tablets.
Acknowledgments
Mini-Dose Glucagon Study Group Members and Participating Sites are as follows. Participating T1D Exchange Clinic Network sites with principal investigators (PI), co-investigators (I), and coordinators (C) ordered by the number of participants recruited per site are as follows: Aurora, Colorado University of Colorado/Denver, Barbara Davis Center Adult Clinic (n = 9): Viral Shah (PI), Sarit Polsky (I), Christie Beatson (C), Scott Brackett (C); Boston, Massachusetts Joslin Diabetes Center (n = 6): Howard Wolpert (PI), Elena Toschi (I), Stephanie Edwards (C), Astrid Atakov Castillo (C); Syracuse, New York SUNY Upstate Medical University (n = 4): Ruth Weinstock (PI), Suzan Bzdick (C); New Haven, Connecticut Yale School of Medicine (n = 4): Jennifer Sherr (PI), Eileen Tichy (I), Melinda Zgorski (C), Amy Steffen (C); Philadelphia, Pennsylvania University of Pennsylvania Perelman School of Medicine/Smilow Center for Translational Research (n = 3): Michael Rickels (PI), Shivani Agarwal (I), Eileen Markman (C), Cornelia Dalton-Bakes (C), Amy Peleckis (C); Coordinating Center: Jaeb Center for Health Research, Tampa Florida: Stephanie N. DuBose (coordinating center director), Roy W. Beck, Alandra S. Verdejo (protocol manager); Xeris Pharmaceuticals: Martin Cummins, Brett Newswanger, Steve Prestrelski, and Poul Strange contributed to protocol development and manuscript review.
Funding was provided by the Leona M. and Harry B. Helmsley Charitable Trust, and Xeris provided the study drug.
Author contributions: M.W.H. contributed to data interpretation and wrote and edited the manuscript. S.N.D. performed statistical analyses and wrote and edited the manuscript. M.R.R., H.W., V.N.S., J.L.S., R.S.W., S.A., A.S.V., M.J.C., B.N., and R.W.B. contributed to data interpretation and reviewed and edited the manuscript.
Clinical trial registry: ClinicalTrials.gov no. NCT02411578 (registered 27 March 2015).
Disclosure Summary: V.N.S. has received speaking fees from Dexcom. Because M.W.H. works at a US Department of Agriculture (USDA) facility, the contents of this publication do not necessarily reflect the views or policies of the USDA, nor does mention of trade names, commercial products, or organization imply endorsement from the US government. J.L.S. has received speaking fees from Medtronic. R.S.W.’s employer has received research support from Sanofi, Medtronic, Mylan, Calibra, NovoNordisk, Intarcia, and Eli Lilly. M.J.C. is vice president of drug development at Xeris Pharmaceuticals. B.N. is senior director of Glucagon Products at Xeris Pharmaceuticals. R.W.B.’s employer has received research support and study supplies from Dexcom and Abbott Diabetes Care. The remaining authors have nothing to disclose.
References
Author notes
Address all correspondence and requests for reprints to: Stephanie N. DuBose, MPH, Jaeb Center for Health Research, 15310 Amberly Drive, Suite 350, Tampa, Florida 33647. E-mail: [email protected].
