


Abstract
Vitamin D–deficiency patients have an increased cardiovascular (CV) morbidity and mortality. Carotid intima-media thickness (IMT) and carotid plaques are markers of subclinical atherosclerosis and predictors of CV events.
To perform a meta-analysis of studies evaluating the impact of vitamin D deficiency on common carotid artery IMT (CCA-IMT) and prevalence of carotid plaques.
Studies were systematically searched in the PubMed, Web of Science, Scopus, and EMBASE databases.
Twenty-one studies (3777 vitamin D–deficiency patients and 4792 controls) with data on CCA-IMT and six studies (1889 vitamin D–deficiency patients and 2883 controls) on the prevalence of carotid plaques were included. Compared with controls, vitamin D–deficiency patients showed a significantly higher CCA-IMT [mean difference (MD): 0.043 mm; 95% confidence interval (CI): 0.030, 0.056; P < 0.001] and an increased prevalence of carotid plaques [odds ratio (OR): 2.29; 95% CI: 1.03 to 5.11; P = 0.043] with an attributable risk of 35.9%. Selecting studies specifically including patients with diabetes, the prevalence of carotid plaques resulted higher in vitamin D–deficiency patients than in controls (OR: 3.27; 95% CI: 1.62 to 6.62; P = 0.001). A significant difference in CCA-IMT was confirmed when comparing patients with vitamin D insufficiency with controls (MD: 0.011; 95% CI: 0.010 to 0.012; P < 0.001). Sensitivity analyses substantially confirmed results, and regression models showed that with the exception of low-density lipoprotein cholesterol, high-density lipoprotein cholesterol, triglycerides, and the prevalence of hypercholesterolemia, all of the other clinical and demographic covariates significantly impacted on the difference in CCA-IMT between vitamin D–deficiency patients and controls.
Both vitamin D deficiency and vitamin D insufficiency are associated with subclinical atherosclerosis, potentially suggesting an increased CV risk in these clinical settings.
Deficiency of 25-OH-vitamin D3 (vitamin D) is an often unrecognized and frequently untreated clinical condition, associated with osteopenia, osteoporosis, and an increased risk of fracture. Although the prevalence of vitamin D deficiency is highly variable in different countries and in different clinical subsets, it has been estimated that about one billion people worldwide have vitamin D deficiency (1). Besides its effects on bone health, recent evidence showed an association between vitamin D deficiency and nonskeletal major chronic diseases, especially cardiovascular (CV) diseases (2–4), with poor vitamin D status being associated with CV and overall mortality (5). Indeed, increasing evidence showed the association between vitamin D deficiency and some major CV risk factors, including obesity, low high-density lipoprotein (HDL) cholesterol, diabetes mellitus, hypertension, older age, smoking, and sedentary lifestyle (6–10). Moreover, vitamin D exerts several CV-protective effects such as anti-inflammatory effects, inhibition of vascular smooth muscle cells proliferation, suppression of proatherogenic T lymphocytes, preservation of endothelial function (11–14), and protection against advanced glycation products (15). To further address this issue, a growing attention has been given to the evaluation of the association between vitamin D deficiency and subclinical atherosclerosis, a recognized marker of CV disease.
In particular, carotid intima-media thickness (IMT) assessment is a noninvasive imaging test for subclinical atherosclerosis (16, 17), and it has been widely accepted as one of the strongest predictors of major CV events (18, 19). The presence of carotid plaques is considered an even more reliable predictor of CV events than IMT (20). Overall, these surrogate markers of subclinical atherosclerosis are able to provide important prognostic information over and above traditional CV risk factors. Several studies documented accelerated atherosclerosis in patients with vitamin D deficiency (21, 22). However, this finding has been challenged and no meta-analytical data providing an overall information about this issue are currently available (23, 24). To provide a comprehensive overview of the relationship between vitamin D deficiency and subclinical atherosclerosis, we performed a systematic review with meta-analysis of literature studies.
Methods
Search strategy
To identify all available studies, a detailed search pertaining to vitamin D status and the markers of CV risk (i.e., carotid IMT and plaques) was conducted according to Preferred Reporting Items for Systematic Reviews and Meta-Analyses guidelines (25). A systematic search was performed in the electronic databases (PubMed, Web of Science, Scopus, EMBASE), using the following search terms in all possible combinations: vitamin D, 25(OH)vitamin D, 25-hydroxy-vitamin D3, carotid IMT, carotid plaques, atherosclerosis, and atheroma. The last search was performed on 13 January 2017. The search strategy was developed without any language restriction.
In addition, the reference lists of all retrieved articles were manually reviewed. In case of missing data, study authors were contacted by e-mail to try to retrieve original data. Two independent authors (A.V. and M.A.) analyzed each article and performed the data extraction independently. In case of disagreement, a third investigator was consulted (R.L.). Discrepancies were resolved by consensus. Selection results showed a high interreader agreement (κ = 0.96) and have been reported according to Preferred Reporting Items for Systematic Reviews and Meta-Analyses flowchart (Supplemental Fig. 1).
Data extraction and quality assessment
According to the prespecified protocol, all studies evaluating the impact of vitamin D status on the markers of CV risk were included. Case reports, case series without a control group, reviews, and animal studies were excluded. We included in the analysis all studies providing values (means with standard deviation or standard error) of common carotid artery IMT (CCA-IMT) and/or the prevalence of carotid plaques in subjects stratified according to vitamin D status (1). Vitamin D deficiency was defined as 25(OH)D levels <20 ng/mL, vitamin D insufficiency as 25(OH)D levels from 20 to 30 ng/mL, and normal vitamin D status when 25(OH)D levels were >30 ng/mL. In each study, data regarding sample size, major clinical and demographic variables, values of IMT, and prevalence of carotid plaques in subjects with vitamin D deficiency/insufficiency and controls were extracted.
As primary analysis, we evaluated CCA-IMT and the prevalence of carotid plaques in patients with vitamin D deficiency [i.e., 25(OH)D <20 ng/mL] compared with those with 25(OH)D ≥20 ng/mL. As secondary analysis, we also evaluated CCA-IMT in patients with vitamin D insufficiency [i.e., 25(OH)D from 21 to 29 ng/mL] compared with subjects with 25(OH)D ≥30 ng/mL.
Formal quality score adjudication was not used, because previous investigations failed to demonstrate its usefulness (26).
Statistical analysis and risk of bias assessment
Statistical analysis was carried out using Comprehensive Meta-Analysis [Version 2, Biostat, Englewood, NJ (2005)].
Differences among cases and controls were expressed as mean difference (MD) with pertinent 95% confidence intervals (CIs) for continuous variables, and as odds ratio (OR) with pertinent 95% CI for dichotomous variables. CCA-IMT has been expressed in millimeters (mm).
The overall effect was tested using Z scores, and significance was set at P < 0.05. Statistical heterogeneity between studies was assessed with χ2 Cochran’s Q test and with I2 statistic, which measures the inconsistency across study results and describes the proportion of total variation in study estimates that is due to heterogeneity rather than sampling error. In detail, I2 values of 0% indicate no heterogeneity, 25% low, 25% to 50% moderate, and 50% high heterogeneity (27).
Absolute risk of carotid plaques presence in subjects with vitamin D deficiency and controls was calculated as (number of subjects with carotid plaques)/(total number of subjects) in each group. The attributable risk was defined as (risk of carotid plaques presence in subjects with vitamin D deficiency − risk of carotid plaques presence in controls)/(risk of carotid plaques presence in subjects with vitamin D deficiency).
Publication bias was assessed by the Egger’s test and represented graphically by funnel plots of the standard difference in means vs the standard error. Visual inspection of funnel plot asymmetry was performed to address for possible small-study effect, as well as Egger’s test to address publication bias, over and above any subjective evaluation. A P < 0.10 was considered statistically significant (28). In case of a significant publication bias, the Duval and Tweedie’s trim and fill method was used to allow for the estimation of an adjusted effect size (29). To be as conservative as possible, the random-effect method was used to take into account the variability among included studies.
Sensitivity analyses
In the frame of a sensitivity analysis, we evaluated the outcome after excluding studies specifically including patients with the following: kidney failure, coronary artery disease, systemic lupus erythematosus, and HIV infection. Further analyses have been performed only selecting studies enrolling patients with an age <20 years and stratifying studies according to the design (prospective or retrospective).
Meta regression analyses
We hypothesized that differences among included studies may be affected by demographic variables (mean age, female sex) and clinical data [body mass index; waist circumference; low-density lipoprotein (LDL) cholesterol; HDL cholesterol; triglycerides; systolic blood pressure; diastolic blood pressure; glomerular filtration rate; and prevalence of diabetes, of hypertension, of hypercholesterolemia, of smoking habit, and of coronary artery disease]. To assess the possible effect of such variables in explaining different results observed across studies, we planned to perform meta-regression analyses after implementing a regression model with changes in CCA-IMT or presence of carotid plaques as dependent variables (y) and the aforementioned covariates as independent variables (x). This analysis was performed with Comprehensive Meta-Analysis [Version 2, Biostat, Englewood, NJ (2005)].
Results
After excluding duplicate results, the search retrieved 254 articles. Of these studies, 220 were excluded because they were off the topic after scanning the title and/or the abstract, because they were reviews/comments/case reports, or they lacked data of interest. Thirteen studies were excluded after full-length paper evaluation. One study (30) provided separate data on males and females, and it was considered as two separate datasets.
Thus, 21 articles (22 datasets, 3777 vitamin D–deficiency patients, and 4792 controls) were included in the final analysis (21–24, 31–46) (Supplemental Fig. 1). All of the 21 studies reported data on CCA-IMT, and six studies (21, 32, 33, 37, 39, 44) on the prevalence of carotid plaques (1889 vitamin D–deficiency patients and 2883 controls). In addition, six studies (30, 32, 33, 42, 45, 46) provided data on CCA-IMT in 2308 patients with vitamin D insufficiency (i.e., 25(OH)D from 21 to 29 ng/mL) as compared with 1736 subjects with 25(OH)D ≥30 ng/mL.
Study characteristics
With the only exception of four retrospective studies (31, 39, 41, 43), all included studies had a prospective design. Major characteristics of study populations are shown in Table 1. The number of patients varied from 50 to 3226, the mean age from 13.7 to 66.8 years, and the prevalence of female gender from 0% to 100%.
Demographic and Clinical Data of Subjects Enrolled in Studies Included in the Meta-Analysis
| Author | Subjects (n) | Age (y) | Females (%) | BMI (kg/m2) | WC (cm) | LDL-C (mg/dL) | HDL-C (mg/dL) | HTN (%) | SBP (mm Hg) | DBP (mm Hg) | eGFR (mL/min/L, 73m2) | DM (%) | Smokers (%) | CAD (%) |
|---|---|---|---|---|---|---|---|---|---|---|---|---|---|---|
| Ameri 2014 | 165 | 46.7 | 31.4 | 26.2 | NR | 136.6 | NR | NR | 153.8 | NR | 91.1 | NR | 36.8 | NR |
| Bhadra 2016a | 78 | 49.8 | 35.1 | 24.0 | NR | 94.4 | 43.8 | 21.0 | NR | NR | 80.7 | 100 | 10.7 | NR |
| Blondon 2013 | 3226 | 60.3 | 54.5 | 28.2 | NR | 117.0 | 51.1 | 38.2 | 124.2 | 71.8 | 86.0 | 8.1 | 11.5 | NR |
| Chen 2014 | 350 | 58.5 | 55.5 | 25.8 | 87.1 | 115.5 | 52.4 | 61.1 | 134.5 | 84.8 | 108.9 | 100 | 19.1 | 0 |
| Cheraghi 2012 | 74 | 13.7 | 30.9 | NR | NR | NR | 46.4 | NR | NR | NR | NR | NR | NR | NR |
| Dadoniene 2016 | 100 | 57.5 | 62 | NR | NR | 169.2 | 48.1 | NR | NR | NR | NR | NR | NR | 0 |
| Ezzat 2011b,c | 50 | 28.38 | 100 | 25.8 | NR | 137.6 | 61.2 | 30 | 132.2 | 87.4 | 68.2 | 14 | 24 | 2 |
| Gurses 2014 | 58 | 33.6 | 100 | 23.1 | 77.4 | 106.9 | 341.8 | 0 | 111.3 | 69.2 | NR | 0 | 0 | 0 |
| Hamdy Al-Said 2015a | 78 | 48.2 | NR | 33.1 | NR | 134 | 40 | NR | 131.8 | 85.7 | NR | 100 | NR | NR |
| Jung 2014b,c | 102 | 38.8 | 100 | 21.1 | NR | NR | NR | NR | NR | NR | NR | 0 | 2.9 | 0 |
| Kang (F) 2016 | 650 | 57.3 | 100 | 37.4 | 84.0 | 128.3 | 45.7 | 0 | 118.9 | 77.7 | NR | 0 | 1.5 | 0 |
| Kang (M) 2016 | 404 | 60.3 | 0 | 23.9 | 88.2 | 117.6 | 44.4 | 0 | 123.6 | 80.6 | NR | 0 | 31.2 | 0 |
| Ma 2014 | 671 | 58.8 | 100 | 22.8 | NR | 116.0 | 62 | 0 | 120.0 | 70.4 | 96.9 | 0 | 1.5 | 0 |
| Oz 2013a | 222 | 60.4 | 34.4 | NR | NR | NR | NR | 32.5 | 132.3 | 79.1 | NR | 18.9 | 17.9 | 0 |
| Portilla 2014a,d | 89 | 42 | 0 | 24.8 | NR | 126 | 49 | NR | NR | NR | NR | 0 | 60.7 | NR |
| Robinson 2014 | 201 | 15.7 | 83.1 | NR | NR | 86.0 | 46.0 | 33.3 | NR | NR | 138.7 | NR | 2.9 | 0 |
| Sachs 2013 | 643 | 32.1 | 33.1 | 25.5 | NR | 109.1 | 50 | NR | 114.1 | 73.5 | 123.2 | 100 | 14.0 | NR |
| Serra-planas 2015 | 150 | NR | NR | NR | NR | NR | NR | NR | NR | NR | NR | NR | NR | 0 |
| Targher 2006e | 390 | 58.1 | 35.1 | 28.5 | 105 | 130 | 52 | 41.3 | 144.7 | 80 | 93 | 100 | 19 | NR |
| van de Luijtgaarden 2012 | 352 | 66.8 | 27.8 | 26.3 | NR | NR | NR | 66.8 | NR | NR | 78.3 | 20.4 | 42.5 | 37.7 |
| Winckler 2015 | 415 | 59.9 | 31.9 | 32.1 | NR | NR | NR | NR | 139.4 | 82.5 | 127.7 | 100 | 15.1 | 0 |
| Yadav 2012a,f | 101 | 51 | 22.8 | 22.8 | NR | 91.4 | 44.6 | 86 | 140.1 | 85.3 | 12.1 | 33.2 | 27 | 0 |
Patients with vitamin D deficiency and controls included in studies.
Abbreviations: BMI, body mass index; CAD, coronary artery disease; CKD, chronic kidney disease; DBP, diastolic blood pressure; DM, diabetes mellitus; eGFR, glomerular filtration rate; HDL-C, HDL cholesterol; HTN, hypertension; LDL-C, LDL cholesterol; LES, lupus erythematosus systemic; NR, not reported; SBP, systolic blood pressure; WC, waist circumference.
Vitamin D deficiency defined as 25(OH)D <30 ng/mL.
All patients have systemic lupus erythematosus.
Vitamin D deficiency defined as 25(OH)D <10 ng/mL.
All patients have HIV infection.
Vitamin D deficiency defined as 25(OH)D <15 ng/mL.
All patients have a chronic kidney disease.
The presence of diabetes mellitus was reported by 0% to 100% of patients, hypertension by 0% to 86%, smoking habit by 0% to 60.7%, and previous coronary artery disease by 0% to 37.8%.
Mean body mass index varied from 21.1 to 37.4 kg/m2 (mean 26.5 kg/m2), and waist circumference from 77.4 cm to 105 cm. Mean values of LDL cholesterol ranged from 86 to 169.2 mg/dL and of HDL cholesterol from 40 to 341.8 mg/dL; systolic blood pressure from 111.3 to 153.8 mm Hg; and diastolic blood pressure from 69.1 to 87.4 mm Hg. Glomerular filtration rate ranged from 12.1 to 138.7 mL/min/L, 73 m2.
CCA-IMT
In the 21 studies reporting data on CCA-IMT, we found that the 3777 vitamin D–deficiency patients showed a significantly higher CCA-IMT than the 4792 controls (MD: 0.043 mm; 95% CI: 0.030, 0.056, P < 0.001; Fig. 1). Heterogeneity among these studies was statistically significant (I2 = 98.9%, P < 0.001), and no reduction in the overall heterogeneity was found after excluding one study at a time. A significant difference in CCA-IMT was also found when we excluded the five studies defining vitamin D deficiency as 25(OH)D levels <30 ng/mL (21, 22, 38, 41, 47) (MD: 0.020; 95% CI: 0.008 to 0.031, P < 0.001; I2 = 98.2%, P < 0.001; Supplemental Fig. 2). Interestingly, a significant difference in CCA-IMT was also found in the six studies (30, 32, 33, 42, 45, 46) comparing patients with vitamin D insufficiency [i.e., 25(OH)D from 21 to 29 ng/mL] and those with 25(OH)D ≥30 ng/mL (MD: 0.011; 95% CI: 0.010 to 0.012, P < 0.001; I2 = 97.8%, P < 0.001; Supplemental Fig. 3). In particular, we found a progressive increase in CCA-IMT for decreasing levels of vitamin D (Fig. 2).
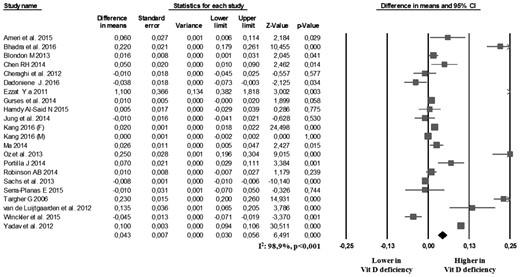
CCA-IMT in vitamin D–deficiency patients and controls.
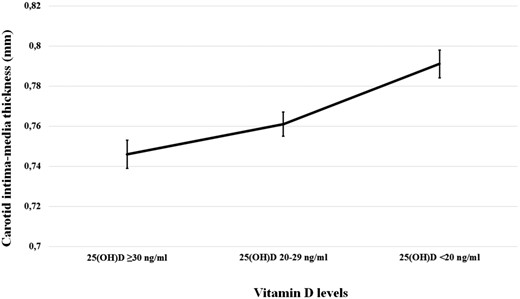
CCA-IMT according to vitamin D levels.
Carotid plaques
The analysis of the six studies reporting on the prevalence of carotid plaques (21, 32, 33, 37, 39, 44) showed that the absolute risk of carotid plaque presence was 37.0% (95% CI: 20.8 to 56.7) in 1889 vitamin D–deficiency patients and 23.7% (95% CI: 14.1 to 37.1) in 2883 controls with a corresponding OR of 2.29 (95% CI: 1.03 to 5.11, P = 0.043; I2 = 93.1%, P < 0.001; Fig. 3) and with an attributable risk of 35.9%. When selecting the four studies specifically including patients with diabetes (21, 33, 37, 44), the prevalence of carotid plaques resulted even higher in vitamin D–deficiency patients than in controls (OR: 4.38; 95% CI: 1.95 to 9.83, P < 0.001; I2 = 68.8%, P = 0.019). The prevalence of carotid plaques in patients with vitamin D insufficiency [i.e., 25(OH)D from 21 to 29 ng/mL] compared with those with 25(OH)D ≥30 ng/mL was not evaluated because of the low number of studies reporting this outcome.
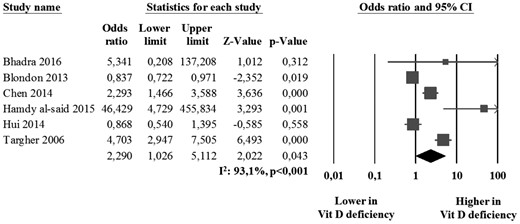
Prevalence of carotid plaques in vitamin D–deficiency patients and controls.
Sensitivity analyses
The significant difference in CCA-IMT between vitamin D deficiency patients and controls was confirmed after excluding studies including patients with kidney failure (46) (MD: 0.035; 95% CI: 0.024 to 0.046, P < 0.001; I2 = 98.2%, P < 0.001); patients with coronary artery disease (36, 46) (MD: 0.038; 95% CI: 0.026 to 0.049, P < 0.001; I2 = 98.6%, P < 0.001); patients with systemic lupus erythematosus (35, 38) (MD: 0.042; 95% CI: 0.030 to 0.054, P < 0.001; I2 = 98.6%, P < 0.001); and patients with HIV (40) (MD: 0.039; 95% CI: 0.027 to 0.050, P < 0.001; I2 = 98.5%, P < 0.001). Interestingly, results were confirmed both in prospective studies (MD: 0.044; 95% CI: 0.031 to 0.056, P < 0.001; I2 = 98.7%, P < 0.001) and in the four studies (31, 39, 41, 43) with a retrospective design (MD: 0.019; 95% CI: 0.001 to 0.037, P = 0.037; I2 = 34.9%, P = 0.203).
In contrast, when specifically selecting studies enrolling patients with an age <20 years (34, 41), the difference in CCA-IMT was no longer significant (MD: 0.006; 95% CI: −0.009 to 0.022, P = 0.423; I2 = 1.46%, P = 0.314).
No sensitivity analysis was performed for studies on carotid plaques because of the limited number of studies reporting this outcome.
Publication bias
Because it is recognized that publication bias can affect the results of meta-analyses, we attempted to assess this potential bias using funnel plots analysis.
Visual inspection of funnel plots for studies evaluating CCA-IMT and the prevalence of carotid plaques suggested the absence of publication bias and of small-study effect (Supplemental Fig. 4), confirmed by the Egger’s test (P = 0.102 and P = 0.117, respectively).
Meta-regression analyses
Regression models (Table 2) showed that increasing age, systolic blood pressure, diastolic blood pressure, and a higher prevalence of smoking habit, hypertension, and diabetes were associated with a higher difference in CCA-IMT between vitamin D–deficient patients and controls. In contrast, a higher prevalence of female sex, increasing body mass index, waist circumference, and glomerular filtration rate was associated with a lower difference in CCA-IMT between vitamin D–deficiency patients and controls.
Meta-Regression Analyses
| Variable | Z Score | P Value |
|---|---|---|
| Age | 2.93 | 0.003 |
| Female sex | −2.97 | 0.003 |
| BMI | −4.70 | 0.000 |
| Smoking habit | 2.60 | 0.009 |
| LDL | −1.75 | 0.080 |
| HDL | −1.32 | 0.187 |
| Triglycerides | 1.69 | 0.093 |
| SBP | 5.35 | 0.000 |
| DBP | 2.03 | 0.042 |
| eGFR | −2.10 | 0.035 |
| Diabetes | 2.08 | 0.038 |
| Hypertension | 4.03 | <0.001 |
| Hypercholesterolemia | −0.32 | 0.747 |
| Waist circumference | −4.28 | <0.001 |
Impact of major clinical and demographic characteristics on the difference in carotid IMT between patients with vitamin D deficiency and controls.
Abbreviations: BMI, body mass index; DPB, diastolic blood pressure; eGFR, glomerular filtration rate; SBP, systolic blood pressure.
No meta-regression analysis was performed for studies on carotid plaques because of the limited number of studies reporting this outcome.
Discussion
Results of the present meta-analysis consistently show that vitamin D deficiency is associated with subclinical atherosclerosis. In particular, we found an increased CCA-IMT and a higher prevalence of carotid plaques in patients with vitamin D deficiency. These findings are confirmed and extended by the sensitivity analyses and regression models. Further supporting the association between vitamin D levels and subclinical atherosclerosis, a significantly higher CCA-IMT was also documented in patients with vitamin D insufficiency when compared with those with normal vitamin D values.
The clinical relevance of our results can be better understood when we consider that the risk of CV events increases 43% every 0.163-mm increase in carotid IMT (47) and that the prevalence of carotid plaques is an even stronger predictor of CV events than IMT (20). Thus, results of our meta-analysis consistently suggest an increased CV risk in patients with vitamin D deficiency, as well as in those with vitamin D insufficiency and suggest the need for a strict monitoring of CV risk factors and of subclinical signs of atherosclerosis in this clinical setting.
Moreover, some results of the current study might suggest the existence of a subset of patients with vitamin D deficiency who exhibit a particularly increased risk of carotid atherosclerosis. Indeed, our regression models showed that age, smoking habit, hypertension, and diabetes are associated with a higher MD in CCA-IMT between vitamin D–deficiency patients and controls. Thus, we might hypothesize an interaction between these CV risk factors and vitamin D deficiency for the progression of the atherosclerotic process, and this can help us identify a high-CV–risk clinical subset.
By a clinical point of view, it is noteworthy that currently available studies showed that vitamin D supplementation failed to demonstrate a reduction in CV events (48). Thus, besides suggesting vitamin D supplementation, we should plan a strict monitoring of CV risk factors and of subclinical signs of atherosclerosis in patients with vitamin D deficiency, especially in those with additional CV risk factors.
Some potential limitations of our study need to be discussed. First, studies included in our meta-analysis have different inclusion and exclusion criteria, and most of the patients included in the analysis had concomitant CV risk factors. Because meta-analysis is performed on aggregate data and some missing information is present in each study, the meta-regression approach allowed for the adjustment for some, but not all, potential confounders. Thus, caution is necessary in overall results interpretation.
Second, heterogeneity among the studies was generally significant. Although it was not possible to conclusively ascertain sources of heterogeneity, the presence of publication bias has been excluded for all of the outcomes assessed. Moreover, we have tried to reduce the heterogeneity by performing a series of sensitivity analyses that confirmed results of the primary analysis.
As a further limitation of this meta-analysis, it should be considered that most studies on nutrient effects are currently performed by applying to nutrients methods specifically developed for drugs (49). Because several studies failed at demonstrating a linear relationship between nutrient intake and biological response, the common mode of reporting associations between nutrient status and specific outcomes might give inadequate results (50). In particular, vitamin D can impact on a wide variety of biological processes by influencing the genetic transcriptional profile (51, 52). This suggests that the relationship between nutrient status and biological response may be more complex. In our meta-analysis, definition of vitamin D deficiency widely varied among included studies. In most of cases, the comparison was performed between those with 25(OH)D <20 ng/mL vs those with 25(OH)D ≥20 ng/mL. To evaluate the impact of different vitamin D levels on our results, we tried to further refine analyses, also providing a comparison between 25(OH)D from 20 to 29 ng/mL vs 25(OH)D ≥30 ng/mL. In particular, we found a progressive increase in CCA-IMT for decreasing levels of vitamin D. However, in five studies (21, 22, 37, 40, 46), data on CCA-IMT were only reported stratifying the population as 25(OH)D <30 ng/mL and 25(OH)D ≥30 ng/mL. To evaluate the potential confounding effect due to these different cutoffs, we also repeated the analysis after excluding the five studies, and all results were confirmed. Overall, these data support the need of specific guidelines for optimizing design and analysis of both clinical studies and meta-analyses on nutrients, including vitamin D (53).
Finally, we have to consider that the definition of carotid plaques widely varied among different studies. However, the presence of atherosclerotic plaques was identified as an IMT >1.2 to 1.5 mm in the larger part of included studies, and this might partially offset the aforementioned limitation.
In conclusion, in our meta-analysis, both vitamin D deficiency and vitamin D insufficiency appeared significantly associated with subclinical atherosclerosis, potentially suggesting an increased CV risk in these clinical settings. Thus, patients with reduced vitamin D may benefit from a more meticulous screening for CV risk factors and more specific CV prevention strategy. However, additional and specifically designed studies are needed to establish the optimal management of these patients.
Abbreviations:
- CCA
common carotid artery
- CI
confidence interval
- CV
cardiovascular
- HDL
high-density lipoprotein
- IMT
intima-media thickness
- LDL
low-density lipoprotein
- MD
mean difference
- OR
odds ratio.
Acknowledgments
Author contributions: R.L. and M.N.D.D.M. conceived and designed the study, performed statistical analysis, interpreted results, and drafted the manuscript. A.V. and M.A. acquired clinical data and drafted the manuscript. P.A. acquired data and drafted the manuscript. All authors read and approved the final version of the manuscript. A.V. had full access to all data in the study and takes responsibility for the integrity of the original data.
Disclosure Summary: The authors have nothing to disclose.
References
Author notes
These authors contributed equally to this study.
Address all correspondence and requests for reprints to: Matteo Nicola Dario Di Minno, MD, PhD, Department of Advanced Biomedical Sciences, Division of Cardiology, Federico II University, Via S. Pansini 5, 80131 Naples, Italy. E-mail: [email protected].
