


Abstract
Parathormone (PTH) resistance is characterized by hypocalcaemia, hyperphosphatemia, and elevated PTH in the absence of vitamin D deficiency. Pseudohypoparathyroidism type 1A [PHP1A, or inactivating parathormone (PTH)/PTHrp signaling disorder 2, according to the new classification (iPPSD2)], is caused by mutations in the maternal GNAS allele.
To assess PTH resistance over time in 20 patients affected by iPPSD2 (PHP1A), diagnosed because of family history, ectopic ossification, or short stature, and carrying a GNAS mutation.
We gathered retrospective data for calcium, phosphate, thyrotropin (TSH), and PTH levels at regular intervals. PTH infusion testing (teriparatide) was performed in 1 patient.
Patients were diagnosed at a mean age of 3.9 years and had a mean follow-up of 2 years. TSH resistance was already present at diagnosis in all patients (TSH, 13.3 ± 9.0 mIU/L). Over time, PTH levels increased (179 to 306 pg/mL; P < 0.05), and calcium levels decreased (2.31 to 2.21 mmol/L; P < 0.05), but phosphate levels did not decrease with age as expected for healthy individuals. One patient born with ectopic ossifications showed an increase in cyclic adenosine monophosphate upon PTH infusion, similar to that of controls, at 7 months of age, but an impaired response at 4 years of age.
In patients with iPPSD2 (PHP1A), PTH resistance and hypocalcemia develop over time. These findings highlight the importance of screening for maternal GNAS mutations in the presence of ectopic ossifications or family history, even in the absence of PTH resistance and hypocalcemia. The follow-up of these patients should include regular assessments of calcium, phosphate, and PTH levels.
Patients affected by pseudohypoparathyroidism type 1A (PHP1A) [or inactivating parathormone (PTH)/PTH-related protein signaling disorder 2 (iPPSD2), according to a recently proposed classification (1)], present with PTH resistance and varying degrees of Albright hereditary osteodystrophy (AHO), including short stature, obesity, ectopic ossification, mental retardation, round face, and brachydactyly. Patients with iPPSD2 (PHP1A) also show resistance to other hormones, including thyroid-stimulating hormone (TSH) and gonadotropins. In about 70% to 80% of cases, maternally inherited heterozygous inactivating mutations in the GNAS gene (exons 1 to 13) are identified in patients with iPPSD2 (PHP1A) (MIM no. 139320) (2, 3). GNAS is a complex imprinted locus that produces coding and noncoding transcripts through the use of alternative promoters and alternative splicing. Exons 1 to 13 of GNAS code for Gsα (4), which mediates the action of several hormones as well as neurotransmitters and other factors via the cyclic adenosine monophosphate (cAMP) pathway. When PTH binds to its Gsα-coupled receptor (PTH1R), which is expressed by osteoblasts, the PTH triggers an increase in bone formation and, indirectly, bone resorption (5). PTH1R is also present in renal tubules: upon PTH binding in renal proximal tubules, the biosynthesis of 1,25-dihydroxy vitamin D is induced and reabsorption of phosphate is inhibited, whereas when PTH binds to renal distal tubules, the tubular reabsorption of calcium is enhanced (6). These events allow a correct homeostasis of calcium and phosphate. In iPPSD2 (PHP1A), endogenous PTH is secreted by the parathyroid glands: however, the signaling pathway in the proximal renal tubules, initiated by the interaction between PTH and PTH1R, is impaired. This defect can be observed in vivo; in fact, upon PTH injection, urinary cAMP and phosphate fail to increase (7).
As previously reported, the expression of the GNAS transcripts is determined in a parent-of-origin manner. Indeed, the paternal Gsα allele is silenced at the level of the renal proximal tubule, but not in bone cells or the distal part of the nephron (5, 8–10). Therefore, when inactivating mutations or abnormalities occur in the imprinting process of the maternal GNAS, the signaling pathway mediated by PTH at the level of the proximal tubule is affected and calcium/phosphate homeostasis is compromised.
The clinical diagnosis of iPPSD2 (PHP1A) relies on the discovery of PTH resistance associated with features of AHO (11). One of the primary clinical findings in patients with iPPSD2 (PHP1A) is hypocalcemia, which is caused by impaired PTH signaling. However, patients often do not present with hypocalcemia or elevated levels of PTH until after the first few years of life (12, 13). Recent studies using knockout mouse models show that the appearance of PTH resistance is delayed and develops with age, despite the presence of the molecular defect since conception (14). The results presented in this study support the hypothesis that PTH resistance develops gradually in humans affected with an inactivating mutation of the maternal allele of the GNAS gene. This is in accordance with a gradual silencing of the paternal Gsα in the renal proximal tubule.
To better understand the potential importance of an early diagnosis of iPPSD2 (PHP1A) on the basis of criteria other than PTH resistance and hypocalcemia, we analyzed 20 patients with iPPSD2 (PHP1A) who were diagnosed because of family history, ectopic ossification, or short stature and were carrying maternal GNAS mutations. Measurements of PTH, calcium, and phosphate levels over a mean follow-up of 2 years and before the introduction of vitamin D analog therapy clearly showed a marked increase in PTH and a decrease in calcium that developed over time after the diagnosis of the disease.
Methods
We analyzed the medical records of 20 patients with confirmed mutations in the GNAS gene and available medical history data that included diagnosis, and serum calcium, phosphate, urinary calcium, urinary phosphate, urinary creatinine, TSH, and PTH levels. Patients or their guardians were informed and consented to this retrospective study, and the study was registered with the Commission Nationale de l'Informatique et des Libertés French regulatory body (registration number 1915180). We recorded the age of the patient at diagnosis (when the clinical diagnosis was made and recorded in the medical records), age at first available PTH value (henceforth referred to as the study start value), and age at follow-up (corresponding to the last PTH value before alfacalcidol treatment).
Resistance to PTH was defined as the association of an increased serum level of PTH (>60 pg/mL in our study) and high serum phosphate (greater than the normal range for age: birth to 2 years, 1.3 to 2.2 mmol/L; 4 to 10 years, 1.2 to 1.7 mmol/L; 10 to 18 years, 1.1 to 1.8 mmol/L; and ≥18 years, 0.8 to 1.5 mmol/L) and/or low serum calcium (<2.20 mmol/L).
The evaluation of PTH resistance was further documented in 1 patient by the measurement of urinary cAMP before and after recombinant PTH1-34 injection, as previously described (15), and values were adjusted to the creatinine level. Briefly, the patient received an intravenous injection of 5 μg of human recombinant PTH1-34. Urine samples were collected at 0, 30, 60, 120, and 240 minutes.
Results
Patients
We identified 20 patients with iPPSD2 (PHP1A) presenting with inactivating mutations on the maternal allele of the GNAS gene; some of these mutations have been previously described (3, 16–19) and some have not (Table 1; Supplemental Fig. 1). Among this sample, seven patients are from three families (family 1, patients 7 and 12; family 2, patients 15 to 17; and family 3, patients 18 and 19). Mutations were of different types, including frameshift, deletion, nonsense, and missense mutations in exons 1, 2, 4 through 7, 10, and 12, and intron 10. In particular, a mutation was carried in exon 1 in one patient, exon 2 in two patients, exon 4 in five patients, exon 5 in two patients, exon 6 in two patients, exon 7 in three patients, exon 10 in three patients, intron 10 in one patient, and exon 12 in one patient (Supplemental Fig. 1). The patients were diagnosed with iPPSD2 (PHP1A) on average at 3.9 (±4.9) years of age, but diagnoses occurred at ages ranging from birth to 16.2 years old. Initially, patients were referred to the hospital for reasons including family history (n = 7; 35%), ectopic ossifications (n = 6; 30%), short stature (n = 3; 15%), obesity (n = 1; 5%), hand fracture (n = 1; 5%), brachymetacarpia (n = 1; 5%), or hypocalcemia (n = 1; 5%) [Table 1; Fig. 1(a)]. The mean age at first PTH evaluation (study start) was 5.3 (±5.8) years.
Clinical, Biological, and Molecular Profile of the 20 Patients Included in the Study at Diagnosis, Start of Study, and Follow-Up
| Patient | Diagnosis (y) | Study Start (y) | Follow-Up (y) | First Symptom | AHO Featurea | Ca and Ph Metabolism | TSH (mIU/L) | Mutation | Mutation Type | Exon/Intron | Reference | ||||||||
|---|---|---|---|---|---|---|---|---|---|---|---|---|---|---|---|---|---|---|---|
| Study Start | Follow-Up | ||||||||||||||||||
| FH | EO | SS | OB | Ca (mmol/L) | Ph (mmol/L) | PTH (pg/mL) | Ca (mmol/L) | Ph (mmol/L) | PTH (pg/mL) | ||||||||||
| 1 | 0 | 0.58 | 2.67 | FH | + | − | + | − | 2.64 | 2.05 | 58 | 2.35 | 1.89 | 152 | 36 | p.P144S+4fsX | fs | Exon 5 | Current study |
| 2 | 0 | 0.5 | 1.08 | BM | − | − | − | + | 2.35 | 1.84 | 77 | 2.45 | 1.87 | 201 | 13.2 | p.I103T | ns | Exon 4 | Lim et al., 2002 (19) |
| 3 | 0.25 | 0.58 | 3.91 | EO | + | + | − | + | 2.46 | 1.67 | 20 | 2.24 | 1.74 | 81 | 7 | ∆ bp (144) | del | Exon 5 | Linglart et al., 2002 (3) |
| 4 | 0.1 | 0.09 | 0.09 | EO | + | + | + | + | NA | NA | 277 | NA | NA | NA | 27.8 | ∆ 6200bp | del | Exon 4 | Garin et al., 2015 (18) |
| 5 | 0.9 | 0.92 | 1 | EO | − | + | − | − | 2.52 | 2.02 | 129 | NA | NA | 78 | 16.88 | p.I56RfsX2 | fs | Exon 2 | Current study |
| 6 | 1.1 | 1.17 | 2.25 | EO | + | − | + | − | 2.6 | 1.51 | 69 | 2.31 | 1.54 | 172 | 7.6 | p.V65GfsX+1 | fs | Exon 2 | Current study |
| 7 | 0 | 0.25 | 5.58 | FH | + | − | + | + | NA | NA | 98.3 | NA | NA | 70.4 | 5.7 | p.V247M | ms | Exon 10 | Current study |
| 8 | 0 | 1.75 | 8.67 | FH | + | + | + | + | NA | NA | 71.1 | 2.4 | 1.6 | 107 | 5.8 | p.V247M | ms | Exon 10 | Current study |
| 9 | 7.5 | 11.25 | 13.67 | FH | + | + | − | + | 2.05 | 1.93 | 290 | 1.65 | 2.26 | 1 050 | NA | ∆ 4 bp (89-90) | del | Exon 4 | Linglart et al., 2002 (3) |
| 10 | 0.21 | 0.21 | 1.5 | FH | − | + | − | − | 2.11 | 1.38 | 96 | NA | NA | 547 | 28 | ∆ Glu157 | del | Exon 6 | Long et al., 2007 (17) |
| 11 | 9 | 13.17 | 14.83 | EO | − | + | − | − | 2.32 | 1.55 | 90 | NA | NA | 57 | 7.79 | p.M1? | ms | Exon 1 | Current study |
| 12 | 11 | 11 | 21 | EO | − | − | + | + | 2.34 | 1.4 | 113 | NA | NA | 73 | 6.9 | p.V247M | ms | Exon 10 | Current study |
| 13 | 16.2 | 16.2 | 16.2 | SS | + | − | − | − | 2.29 | 1.2 | 358 | NA | NA | NA | 11 | p.V159M | ms | Exon 6 | Linglart et al., 2002 (3) |
| 14 | 0 | 0.92 | 3 | FH | + | − | − | + | 2.43 | 2.34 | 128 | 2.26 | 2.01 | 826 | 14.4 | c.840-2del p.? | del | Intron 10 | Current study |
| 15 | 0.3 | 0.33 | 2 | FH | + | + | − | + | 2.59 | 2.4 | 86 | 2.17 | 2.37 | 684 | 17.14 | p.N189Mfs*14 | fs | Exon 7 | Several references as reported by Lemos et al., 2015 (16); Linglart et al., 2002 (3) |
| 16 | 9 | 9 | 9 | HC | − | + | − | + | NA | NA | 180 | NA | NA | NA | NA | p.N189Mfs*14 | fs | Exon 7 | |
| 17 | 4 | 4.33 | 4.33 | OB | + | − | − | + | 1.51 | 2.77 | 741 | NA | NA | NA | 11.68 | p.N189Mfs*14 | fs | Exon 7 | |
| 18 | 2 | 11 | 11 | SS | + | − | + | + | 2.35 | 1.72 | 182 | NA | NA | NA | 5.8 | p.E104C | ms | Exon 4 | Current study |
| 19 | 9 | 15.5 | 17.8 | SS | + | − | + | + | 2.25 | 1.13 | 104 | 2.40 | 1.12 | 118 | 4.9 | p.E104C | ms | Exon 4 | Current study |
| 20 | 7.1 | 7.08 | 7.58 | HF | − | + | − | + | 2.13 | 2.5 | 414 | 1.93 | 2 | 375 | 11.5 | p.R342* | ns | Exon 12 | Linglart et al., 2002 (3) |
Age at diagnosis corresponds to age at the time that the clinical diagnosis was made and recorded in the medical records. Study start corresponds to age at first available PTH value, and follow-up corresponds to age at time of last PTH value before alfacalcidol treatment.
Abbreviations: BM, brachymetacarpia; bp, base pair; Ca, calcium; del, deletion; EO, ectopic ossifications; FH, family history; fs, frameshift mutation; HC, hypocalcemia; HF, hand fracture; ms, missense mutation; NA, not available or not applicable; ns, nonsense mutation; OB, obesity; p.?, unknown predicted effect on protein; Ph, phosphate; SS, short stature.
Presence or absence of a symptom is indicated by + or −, respectively.
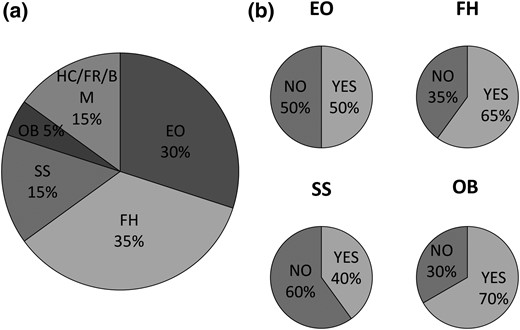
Clinical features of our cohort of 20 patients. (a) Reasons for the first medical consultation. (b) Additional features identified during patient follow-up. BM, brachymetacarpia; EO, ectopic ossification; FH, family history; FR, frameshift mutation; HC, hypocalcemia; OB, obesity; SS, short stature.
Patients were then followed for an average time of 2.1 (±2.6) years before alfacalcidol was administered. During this time, as well as at diagnosis, other AHO features and forms of hormone resistance were characterized by the same team of physicians of the Reference Center for Rare Disorders of Calcium and Phosphate Metabolism, at Bicêtre Paris-Sud Hospital. In fact, 80% of the patients showed at least two AHO features. Family history and obesity were found in ∼60% of the patients, whereas ectopic ossifications and short stature characterized 50% and 40% of patients, respectively [Table 1; Fig. 1(b)].
Interestingly, we observed that all patients had abnormally elevated levels of TSH at diagnosis or study start, with average levels of 13.3 (±9.0) mIU/L even at birth, ranging from 4.9 to 36 mIU/L [Fig. 2(a)]. In contrast, not all patients presented with elevated serum levels of PTH [Fig. 2(b)]. In fact, 2 of 20 patients and 8 of 20 patients had PTH values that were considered normal or modestly increased (≤1.5 upper limit of normal), respectively. Given that previous studies have shown that mice that are heterozygous for disruption of Gnas manifest PTH resistance only after early postnatal life (14), we decided to analyze the PTH, calcium, and phosphate profiles over time of patients diagnosed for reasons other than PTH resistance.
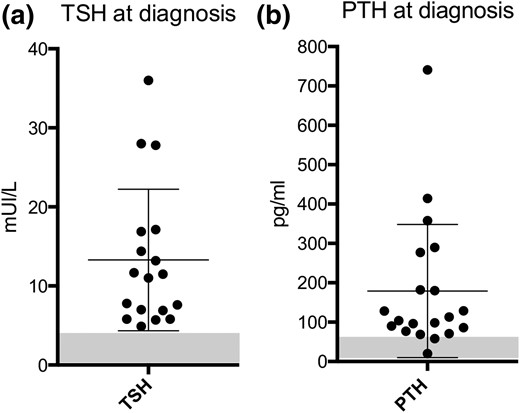
TSH and PTH values at diagnosis. At diagnosis or study start, TSH levels were higher than reference values in all cases (n = 18), whereas PTH values for a subgroup of patients (n = 10) were normal or modestly increased. Normal ranges are indicated by the shadowed rectangle.
Resistance to PTH
We observed that mean values of PTH significantly increased (P < 0.05) from 179 (±169) at study start to 306 (±320) pg/mL at follow-up [Fig. 3(a)]. In accordance with this finding, mean calcium level values significantly decreased (P < 0.05) from 2.31 (±0.27) to 2.21 (±0.24) mmol/L. Phosphate levels were within the normal range at study start for 11 of the 16 patients for whom the value was available (Table 1). During the course of follow-up, the mean serum phosphate level did not change significantly [1.90 (±0.37) to 1.80 (±0.31) mmol/L for patients between 0 and 4 years of age at study start, and 1.78 (±0.60) to 1.70 (±0.52) mmol/L for patients older than 4 years at study start], unlike the decrease with age observed in nonaffected individuals (see Methods section for reference values). At follow-up, the phosphate level was within the normal range for only 6 of 12 available measures. The mean value of urinary calcium did not change significantly during follow-up (expressed as the calcium-to-creatinine ratio: 0.32 (±0.52) to 0.06 (±0.55) mmol calcium per millimole of creatinine; P = 0.06). However, the mean value of urinary phosphate (expressed as the phosphate-to-creatinine ratio) decreased significantly over time despite the limited number of available data (n = 7) from 4.7 (±4.1) to 2.5 (±2.5) mmol phosphate per millimole of creatinine (Supplemental Table 1).
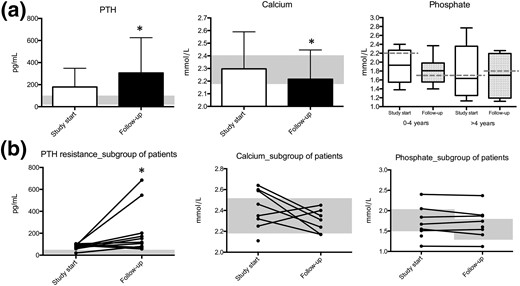
Development of PTH resistance over time in a series of 20 patients affected with iPPSD2 (PHP1A) and a maternal inactivating mutation of the GNAS gene (exons 1 to 13). (a) Levels of PTH, calcium, and phosphate at study start (white bar) and follow-up (black bar). (b) Individual levels of PTH, calcium, and phosphate in a subgroup of patients who had a normal or subnormal PTH value at the time of diagnosis and developed PTH resistance thereafter. Normal ranges are indicated by the shadowed rectangle. Phosphate normal range: birth to 2 years, 1.3 to 2.2 mmol/L; 4 to 10 years, 1.2 to 1.7 mmol/L; 10 to 18 years, 1.1 to 1.8 mmol/L; ≥18 years, 0.8 to 1.5 mmol/L. *P < 0.05, unpaired t test.
The increase in PTH values over time was even more evident in a subgroup of patients (patients 1, 2, 3, 6, 7, 8, 10, 11, 15, and 19; n = 10) that presented with serum PTH values within the normal range (<60 pg/mL; n = 2) or close to the normal range (between 60 and 100 pg/mL; n = 8) at study start [Fig. 3(b)]. This subgroup of patients showed values of serum PTH ranging from 57 pg/mL to 684 pg/mL at follow-up. In line with this, the patient subgroup showed a decrease in calcium levels when PTH resistance increased, ranging from 2.42 mmol/L to 2.31 mmol/L at follow-up. Similarly, phosphate levels did not decrease over time. Notably, when patients were divided into two groups according to their age at study start, it is evident that all patients except one, referred to the hospital before the age of 4 years, developed PTH resistance over time (Fig. 4; Supplemental Fig. 2).
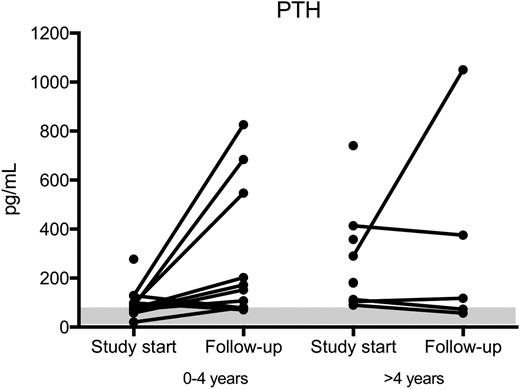
PTH values as a function of patient age. Almost all patients referred to the hospital before 4 years of age developed PTH resistance with time. Levels of PTH at study start and follow-up of patients subdivided into two groups: 0 to 4 years of age and >4 years of age. Normal ranges are indicated by the shadowed rectangle.
cAMP response to PTH
Patient 3 is the second child of a nonconsanguineous couple. His older sister was diagnosed with iPPSD2 (PHP1A) after hypocalcemic seizures. A few years later, a deletion of one base pair at codon 144 of the maternally inherited GNAS gene was identified (3). Patient 3 himself was born with a subcutaneous ossification in the neck area; at 3 months of age, his first hormonal evaluation showed moderate TSH resistance and normal PTH, calcium, and phosphate levels (Table 1). When he was 7 months old, we performed a PTH infusion test to further explore the in vivo response to PTH (Fig. 5). He responded with a normal cAMP increase (more than a 47-fold increase compared with baseline) upon PTH infusion, concordant with the absence of PTH resistance and his biochemical profile. Interestingly, at the age of 3.9 years, his serum PTH had increased to 81 pg/mL, and a blunted response to the PTH infusion test was observed (about a twofold increase compared with baseline). As for his sister, the diagnosis of iPPSD2 (PHP1A) was later confirmed through the molecular identification of the GNAS maternal (one base pair) deletion.
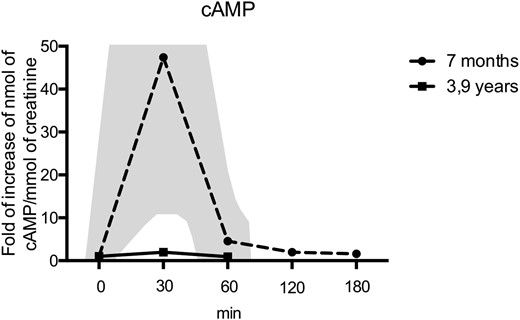
PTH infusion tests in a patient with a GNAS mutation. At the age of 7 months, there was a marked increase in urinary cAMP (dashed line) upon PTH1-34 infusion, yet a lack of increase in urinary cAMP at the age of 3.9 years (solid black line) upon PTH1-34 infusion, demonstrating the development of PTH resistance over time. The normal range of cAMP response is shown by the shadowed area. At the time of the second infusion, a control individual was tested and showed a 15-fold increase in the cAMP/creatinine ratio, confirming the bioactivity of the PTH1-34.
Discussion
In this study, our main goal was to decipher the natural history of PTH resistance presented by patients affected with maternal mutations of the GNAS gene. We refer to these patients as having both PHP1A and iPPSD2, in accordance with our recently published proposal for a new classification (1). First, we report that even if patients with iPPSD2 (PHP1A) do not show specific signs of PTH resistance at diagnosis, they may develop severe complications, such as hypocalcemic seizures, a few years later. For instance, we observed that even if patients are referred to the hospital for short stature, they can later develop hypocalcemia and PTH resistance (as in the case of the patients in family 3 and patient 13). We also showed that patients belonging to the same family and carrying the same mutation (patients 15 and 17 of family 2; p.N189Mfs*14) do not have the same phenotypic characteristics. This evidence highlights the great phenotypic variation of individuals with iPPSD2 and emphasizes the need for further studies, in larger cohorts of patients, to identify a possible genotype/phenotype correlation.
Most importantly, we pinpoint several characteristics of hormone resistance in patients bearing a mutation on the maternal allele of GNAS. We confirmed that TSH resistance is present at diagnosis or study start in our cohort of 20 patients with iPPSD2 (PHP1A), as shown in similar patients in several previous studies (20–24). In line with this, patients with iPPSD2 (PHP1A) and congenital hypothyroidism without goiter have been previously described (25). Therefore, this evidence demonstrates that the discovery of elevated levels of TSH in the context of AHO represents a strong diagnostic argument for iPPSD2 (PHP1A). Conversely, as observed in our study, patients with iPPSD2 (PHP1A) who are diagnosed because they present with different symptoms of the disease and have not yet undertaken treatment with vitamin D analogs can develop PTH resistance over time. In fact, we have shown that, depending on the patient, PTH, calcium, phosphate, and urinary phosphate levels evolve toward a PTH-resistance profile in a 2-year period. In addition, we observed the disappearance of the PTH-induced cAMP response in one patient included in our study. Taken together, these results indicate that in patients with iPPSD2 (PHP1A), calcium levels may be normal at diagnosis, but significantly decrease over time, therefore implying the need for careful monitoring and prevention of hypocalcemic seizures.
In agreement with this finding, a recent study in which data were collected on 120 iPPSD2 (PHP1A) cases from the literature concluded that PTH resistance in these patients appears mostly, but not always, after infancy (14). In the same study, the authors were able to show the increase in Gsα relative expression from the maternal allele during development in a mouse model in which the maternal or paternal Gnas exon 1 was ablated. Remarkably, they observed that this mouse model of iPPSD2 (PHP1A) presented a latency of PTH resistance that was similar to that in humans. Therefore, previous results and our study suggest that Gsα expression from the maternal allele, or the silencing of the paternal allele, may be developmentally regulated in humans. In fact, tissue-specific factors expressed at different stages of development could orchestrate this mechanism (13). Evidently, other mechanisms also need to be explored, such as the possible intervention of other G proteins that compensate for the impaired PTH signaling cascade for a defined period of time (26).
All of this evidence suggests that an early diagnosis of iPPSD2 (PHP1A) could be achieved by screening for maternal GNAS mutation in the presence of ectopic ossifications, TSH resistance, or family history, even in the absence of PTH resistance and hypocalcemia. The ultimate objective of an early diagnosis would be to start vitamin D analog treatment at early stages of the disease to improve the care and quality of life of patients with iPPSD2 (PHP1A).
Abbreviations:
- AHO
Albright hereditary osteodystrophy
- cAMP
cyclic adenosine monophosphate
- iPPSD2
inactivating parathormone/parathormone-related protein signaling disorder 2
- PHP
pseudohypoparathyroidism
- PHP1A
pseudohypoparathyroidism type 1A
- PTH
parathormone
- PTH1R
Gsα-coupled receptor of parathormone
- TSH
thyroid stimulating hormone.
Acknowledgments
We thank the laboratories that performed the analysis for the molecular diagnosis of pseudohypoparathyroidism in the reported patients at the Assistance Publique-Hôpitaux de Paris (APHP) Bicêtre Paris-Sud Hospital (under the direction of A. Mantel), at the University Hospital Center of Caen (under the direction of M. L. Kottler), at the University Hospital of Assistance Publique-Hôpitaux de Marseille (APHM), Hôpital la Conception (under the direction of A. Barlier), and at the APHP Cochin Hospital (under the direction of C. Silve).
Disclosure Summary: The authors have nothing to disclose.
References
Wass JAH, Stewart PM, Amiel SA, Davies MC, eds. Oxford Textbook of Endocrinology and Diabetes. 2nd ed. Oxford, United Kingdom: Oxford University Press; 2011. Available at: http://oted.oxfordmedicine.com. Accessed 10 May 2016. doi:10.1093/med/9780199235292.001.1
Author notes
Address all correspondence and requests for reprints to: Alessia Usardi, PhD, Plateforme d'expertise Paris-Sud, Hôpital Bicêtre, 78 Rue du Général Leclerc, 94270 Le Kremlin-Bicêtre, France. E-mail: [email protected].
