


Abstract
Low bone density is a complication of cystic fibrosis (CF).
Accrual of bone mass is most impaired in the sickest children, as judged by nutritional status and pulmonary function.
Retrospective analysis of correlation between lumbar spine bone mineral density (BMD), body mass index (BMI), and forced expiratory volume in 1 second (FEV1) z scores in children and adolescents with CF.
Pediatric hospital specialist CF service.
Sixty participants aged 5.9 to 18.8 years (24 female) with confirmed CF.
Lumbar spine BMD, BMI, and FEV1 z scores measured at first BMD scan; 40 participants had sequential scans. Change in L1-L4 z scores over time was used as a measure of bone accrual, and BMI as a measure of nutritional status.
Correlations between lumbar spine BMD, BMI, and FEV1 z scores.
Mean BMI and BMD z scores were strongly correlated at the initial scan (P < 0.0001), suggesting that nutritional status is a major determinant of BMD. In the sequential scan at a mean age of 16.1 years, height centile was maintained, indicating normal linear growth. Changes in BMI and BMD z scores were positively correlated (P = 0.001), indicating that patients failing to gain weight appropriately with growth were also failing to acquire bone normally. Change in FEV1 z score was correlated with change in both BMD (P < 0.0001) and BMI z scores (P = 0.02).
Although young people with CF may be maintaining normal growth in height, bone accrual is impaired in those with the poorest nutritional status and lung function.
The median life expectancy of people with cystic fibrosis (CF) is now more than 39 years (1); with this increased longevity, a number of new problems have emerged, including low bone mineral density (BMD), osteoporotic fractures, and kyphosis (2–4). Vertebral and rib fractures, and kyphosis, can further compromise lung function with pain, interfering with airway clearance, and reducing physical activity.
Studies using bone densitometry have suggested that the deficit in bone mass (relative to normal) is minimal in early childhood and most marked in adulthood. Many factors have been implicated, including chronic infection, malabsorption, vitamin D insufficiency, exocrine pancreatic insufficiency, systemic inflammation, hypogonadism, delayed puberty, glucocorticoid treatment, reduced physical activity, and direct effects of impaired CF transmembrane conductance regulator function in osteoblasts (5–7).
A number of cross-sectional studies have linked BMD to lung function and nutritional status, as measured by body mass index (BMI) (8–11). However, most of these studies have included subjects from a wide age range—from young children to adults in their 40s (10–13). This is problematic because it blurs the distinction between the separate processes of failure to accrue bone during growth from loss after attaining peak adult bone mass.
Only a few longitudinal studies have been undertaken, and all have been of short duration (≤2 years) and most included adults as well as children and adolescents, again conflating the issues of failure of bone accrual with later bone loss (14–17). One study reported normal bone density in childhood (proposed to be via adequate nutrition during this period) followed by failure of bone acquisition during the pubertal growth spurt (15), but another reported a uniformly low bone density in CF at all ages, including children, regardless of nutritional status (16). Buntain et al. (17) reported that bone mass accrual over 2 years was significantly reduced in adolescents with CF compared with normal controls, but this could be explained in part by a difference in height gain between CF and control subjects. The European Cystic Fibrosis Society has called for more longitudinal studies to assess bone accrual and the factors that affect it in young people with CF (18).
The aim of this study was to assess long-term bone accrual in children and adolescents with CF. We hypothesized that accrual of bone would be most impaired in the sickest children, as judged by their nutritional status and pulmonary function.
Methods
Subjects
We studied 60 participants aged 5.9 to 18.8 years (24 female, all with at least one bone density scan), with confirmed CF (positive sweat test ± two CF-causing genetic mutations). According to the recommendations of the UK Cystic Fibrosis Trust Bone Mineralization Working Group, bone density scans were measured approximately 2-year intervals (19). Electronic medical records were reviewed with reference to CF genotype, the presence of liver disease or diabetes, the use of pancreatic enzyme supplements and vitamin D supplements at the time of the scan, and corticosteroid use 6 months before the bone density scan.
Anthropometry
Body weight and height were measured at the time of the scan with height, weight, and BMI centiles; z scores were calculated using online calculators (20, 21). BMI was used as a measure of nutritional status.
Bone densitometry
Bone densitometry scans were performed using a Lunar Prodigy dual-energy x-ray absorptiometry scanner (GE Health Care). BMD was measured at the lumbar spine region (L1-L4) and expressed as standard deviation (SD) scores (z score) derived from the manufacturer’s reference ranges. The L1-L4 BMD z score data largely represent trabecular bone.
Thirty-three of the 60 participants also had whole-body scans at the time of the first BMD measurement and 30 had them at the second scan. This procedure involves measuring whole-body bone mineral content (less head) and bone area. The readout includes the bone area centile for chronological age, a measure that is in part related to height (the greater a subject’s height, the greater the bone area). The confounding effect of height can be accounted for by using the method of Molgaard et al. (22) to produce the parameter “bone area–for–height”, generated from the ratio of bone area centile to the height centile. This measure, which is automatically calculated by the densitometer’s software and expressed as a centile, largely reflects the width of long bones, which are composed mainly of cortical bone.
Pulmonary function
Pulmonary function tests were done according to American Thoracic Society/European Respiratory Society criteria (23) using the Global Lung Initiative references (24) and are presented as the forced expiratory volume in 1 second (FEV1) z score.
Longitudinal study
Forty participants had sequential spinal bone density scans. Lung function and BMI data were analyzed for change over time. In those with more than two bone density scans, data were collected from the first to the latest BMD scan. The change in L1-L4 z score over time was used as a measure of bone accrual. All subjects in this study were <20 years old at the time of the final scan.
Statistical methods
For comparison, BMD, FEV1, and BMI centiles were converted to z scores (SD scores) using the BMI calculator and Global Lung Initiatives equations (20, 21, 23). Correlations among lumbar spine BMD, BMI, and FEV1 z scores were calculated using Pearson’s rank correlation test. Student t test for paired samples was used to compare data across sequential scans. Where z scores were compared with the general population, the latter were assumed to have a mean value of 0 with an SD of 1. Statistical analysis was performed using Microsoft® 2010 Excel and GraphPad Prism, version 6.07 (GraphPad Software, Inc). Results are expressed as mean (± SD). P <0.05 was considered statistically significant.
Because we used retrospective data collected in routine clinical practice following international guidelines, ethical approval and informed consent were not required.
Results
Cross-sectional study
The mean age of the 60 children and adolescents (24 female) at the time of the first bone density scan was 12.6 years (range, 5.9 to 18.8). Seventy percent were homozygous and 22% were heterozygous for c.1521_1523delCTT; 8% had other/unknown genetic mutations. Twenty percent had liver disease and 20% had CF-related diabetes. Fifty-seven subjects (95%) took pancreatic enzyme replacement. Six (10%) had used between 2 and 8 weeks of oral glucocorticoids within the 6 months before the scan for treatment of allergic bronchopulmonary aspergillosis. Vitamin D supplementation was prescribed only if the serum calcidiol was <50 nmol/L: 13 subjects (22%) took vitamin D supplementation.
The mean (± SD) z scores at the time of the first BMD scan are listed in Table 1. There was a positive correlation between L1-L4 z score and both BMI (r = 0.68, P < 0.0001) and FEV1 z scores (r = 0.32, P < 0.01). Bone area–for–height z score at time of the first scan (33 of 60 patients) was correlated with the BMI z score (r = 0.56, P = 0.0007, Fig. 1) but not FEV1 (r = 0.1, P = 0.55).
Clinical Data at Time of First Bone Density Scan (n = 60)
| Value | |
|---|---|
| Age, y | 12.6 ± 2.3 |
| Female, % | 40 |
| Liver disease, % | 20 |
| Diabetes, % | 20 |
| Steroid use, % | 10 |
| Height z score | −0.40 ± 0.96 |
| Weight z score | −0.37 ± 1.05 |
| BMI z score | −0.28 ± 1.38 |
| L1-L4 z score | −0.92 ± 1.13 |
| Bone area–for–height z score (n = 33) | −0.72 ± 0.78 |
| FEV1 z score | −1.98 ± 1.90 |
Mean ± SD (not applicable to data expressed as percentage).
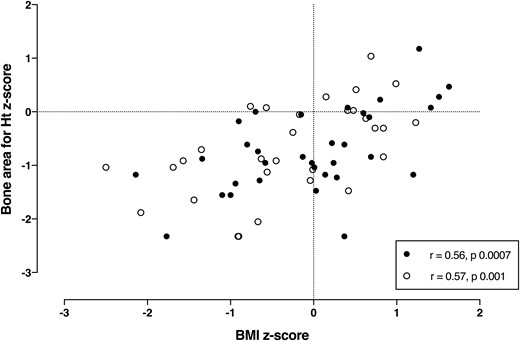
Correlation between bone area–for–height (Ht) z score and BMI z score in children and adolescents with CF at time of the first (n = 33, black symbol) and last (n = 30, open symbol) bone density scans.
Longitudinal study
Forty participants had sequential bone density scans a mean of 4.0 years apart (range, 1.8 to 8.2 years) at a mean age of 16.1 years (range, 10.3 to 19.9 years) at the time of the second scan. In the interval between scans, 12 patients were newly diagnosed with diabetes and 5 with liver disease. The mean z scores for both BMI (−0.17 to −0.45, P = 0.03) and FEV1 (−1.7 to −2.6, P = 0.0003) were significantly lower at the time of the second scan (Table 2). There was no change in mean height z score or the mean L1-L4 z score (−0.94 to −1.13, P = 0.13), but the change in the z score at L1-L4 was positively correlated with the change in BMI z score (r = 0.50, P = 0.001, Fig. 2) and with the change in FEV1 z score (r = 0.63, P < 0.0001, Fig. 3). The changes in FEV1 and BMI z scores were also correlated (r = 0.36, P = 0.02).
Clinical Data for Patients at the Time of the First and Most Recent BMD Scan (n = 40)
| Scan 1 | Scan 2 | P Value (Paired t Test) | |
|---|---|---|---|
| Age, y | 12.1 ± 2.0 | 16.1 ± 2.0 | — |
| Liver disease, % | 12.5 | 25 | — |
| Diabetes, % | 12.5 | 42.5 | — |
| Height z score | −0.49 ± 0.88 | −0.27 ± 1.10 | 0.06 |
| Weight z score | −0.36 ± 0.93 | −0.47 ± 1.07 | 0.37 |
| BMI z score | −0.17 ± 1.05 | −0.45 ± 1.04 | 0.03 |
| L1-L4 z score | −0.94 ± 0.88 | −1.13 ± 1.0 | 0.13 |
| FEV1 z score | −1.7 ± 1.7 | −2.6 ± 1.8 | 0.0003 |
Mean ± SD (not applicable to data expressed as percentage).
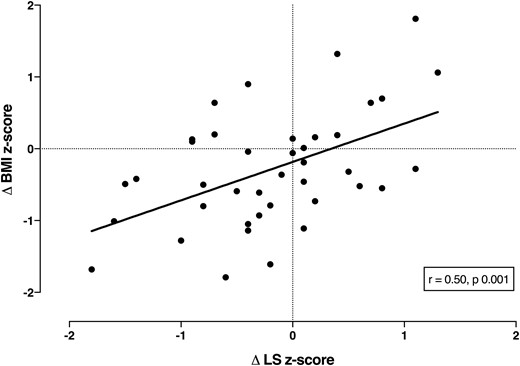
Correlation between change in BMI z score and L1-L4 z score in 40 children and adolescents with CF in bone density scans a mean of 4 years apart.
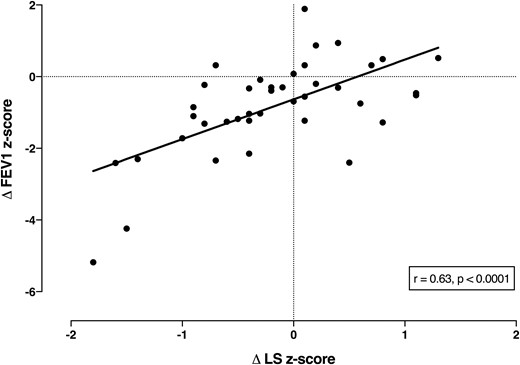
Correlation between change in FEV1 z score and L1-L4 z score in 40 children and adolescents with CF in bone density scans a mean of 4 years apart.
At the time of their first spine BMD scan, 33 patients also had whole-body scans, as did 30 at the time of their second scan, but only 18 had paired whole-body scans. The mean z score for bone area–for–height was −0.72 ± 0.78 on the first scan and −0.68 ± 0.86 on the second scan—both significantly below the expected score (P < 0.0001)—suggesting that the long bones are narrow (22). Bone area–for–height was significantly correlated with BMI z score (Fig. 1), but not with FEV1. In the 18 subjects with paired whole-body scans, the change in bone area–for–height was weakly correlated with the changes in FEV1 (r = 0.50, P = 0.03) and BMI (r = 0.45, P = 0.06).
Discussion
Our results show a positive correlation between BMI and lumbar spine BMD z scores, suggesting that nutritional status is a major determinant of bone mass in children and adolescents with CF. This was strikingly confirmed in the longitudinal study. At a mean follow-up of 4 years, although there was only a minor reduction in the mean BMD z score, strong correlations were present between the changes in BMI and BMD at the lumbar spine. The majority of patients whose BMI centile declined over time also failed to accrue bone normally. We also found a positive correlation between change in lung function with change in BMD and BMI, indicating that patients with declining lung function are likely to be thinner and have lower bone mass.
The failure of bone acquisition seems to affect not only trabecular bone (shown by lumbar spine dual-energy x-ray absorptiometry), but also cortical bone, with whole-body scans showing low bone area–for–height, despite the maintenance of height centile over time. The implication of the low bone area–for–height measure is that the long bones are narrow and therefore less strong (22). Our data demonstrate that patients with improvements in lung function and BMI also tend to have an increase in bone density over sequential scans, suggesting that impaired bone accrual is not an inevitable phenomenon.
Several cross-sectional studies have highlighted the relationship of BMD both to BMI (or lean body mass) (8, 17, 25) and FEV1 (8, 13, 17, 26, 27), although, in some studies, shorter stature in CF patients was a potential confounder (25, 27). Of the longitudinal studies, which were all of short duration, four have linked impaired bone accrual to poor pulmonary function (13–16), but only two to nutritional status (14, 16).
Adolescence is a critical phase for bone accrual. The greatest increases in bone mass occur between the ages of 12 to 15 years for girls and 14 to 17 years for boys (28). Although the exact age when bone accrual stops is debated, recent data suggest that this may be around 18.8 and 20.5 years in females and males, respectively (29). In young people with CF, inadequate nutrition during this period can compromise the peak bone mass that can be attained, even if linear growth is sustained. In addition, poor nutritional status has been associated with decreased lung function (30) and reduced survival in CF patients (31), highlighting the importance of aggressive measures to improve nutrition in this population.
Our study has some limitations. First, pubertal status and the prevalence of hypogonadism were not known. Pubertal delay in some patients may have contributed to poor bone accrual. Second, we have not measured volumetric density using quantitative computed tomography, which is a better indicator than areal BMD of bone density in growing children. Third, this is a retrospective review. Finally, we were unable to demonstrate strong statistical correlations between change in bone area–for–height and change in BMI, probably because of the small number of subjects who had paired scans. The main strength is that, to our knowledge, this is the longest longitudinal study assessing bone density in children and adolescents with CF. The long duration of follow-up enables us to see a clear pattern: bone accrual is impaired in the sickest young people with CF, even if linear growth is minimally affected. Measures to optimize and maintain nutritional status and lung function, especially through adolescence, should help reduce the prevalence of low BMD and fractures.
Abbreviations:
- BMD
bone mineral density
- BMI
body mass index
- CF
cystic fibrosis
- FEV1
forced expiratory volume in 1 second
- SD
standard deviation.
Acknowledgments
We thank Jan Tate, cystic fibrosis nurse specialist, Starship Children’s Health, for coordinating the care for the children and adolescents with cystic fibrosis who took part. We also thank the Health Research Council of New Zealand for their support.
Disclosure Summary: The authors have nothing to disclose.
References
Cystic Fibrosis Foundation Patient Registry. Annual Data Report 2014. https://www.cff.org/2014-Annual-Data-Report.pdf. Accessed 6 January 2016.
The UK Cystic Fibrosis Trust Bone Mineralisation Working Group. Bone mineralisation in cystic fibrosis 2007. http://www.sifc.it/sites/default/files/LineeGuidaSifc_Febbraio2007_BoneMineralisationInCF_UK_CFTrust.pdf. Accessed 10 December 2015
Weight percentile and BMI calculator. http://www.blubberbuster.com/height_weight.html. Accessed 27 March 2016.
Body mass index (BMI) and z-score calculation in children. http://zscore.research.chop.edu. Accessed 28 March 2016.
Author notes
Address all correspondence and requests for reprints to: Sonakshi Sharma, MBBS, Department of Medicine, Taranaki Base Hospital, 23 David Street, Westown, New Plymouth 4310, New Zealand. E-mail: [email protected].
