


Abstract
Increased cortisol levels in obesity may contribute to the associated metabolic syndrome. In obesity, the activated innate immune system leads to increased interleukin (IL)-1β, which is known to stimulate the release of adrenocorticotropin hormone (ACTH).
We hypothesized that in obesity IL-1 antagonism would result in downregulation of the hypothalamo-pituitary-adrenal axis, leading to decreased cortisol levels.
In this prospective intervention study, we included 73 patients with obesity (body mass index [BMI] ≥30 kg/m2) and at least one additional feature of the metabolic syndrome.
The primary end point was change in morning cortisol from baseline to after the administration of the IL-1 receptor antagonist (anakinra/Kineret®, total dose 3 × 100 mg). Secondary end points were effects on salivary cortisol and ACTH.
Median age was 56 years, 50.7% of patients were female, and median BMI was 36.3 kg/m2. Median morning serum cortisol levels (nmol/L) decreased significantly after IL-1 antagonism [from baseline, 452 to 423; absolute difference, −38.7; 95% confidence interval (CI), −64 to −13.4; P = 0.0019]. Similar effects were found for salivary cortisol levels (−2.8; 95% CI, −4.4 to −1.3; P = 0.0007), ACTH levels (−2.2; 95% CI; −4.2 to −0.1; P = 0.038), systolic blood pressure (−5.2, 95% CI, −8.5 to −1.8; P = 0.0006), and heart rate (−2.9; 95% CI, −4.7 to −1.0; P = 0.0029).
IL-1 antagonism in obese individuals with features of the metabolic syndrome leads to a decrease in serum cortisol, salivary cortisol, and ACTH levels along with a reduction in systolic blood pressure and heart rate.
Obesity is a worldwide pandemic, associated with a high prevalence of comorbidities, leading to the metabolic syndrome (1, 2). New treatment strategies are warranted to prevent obesity-related comorbidities and improve their treatment.
Data about cortisol levels in obesity are conflicting (3). Whereas some studies have reported normal baseline cortisol levels and higher urinary cortisol levels resulting from an increased degradation upon an enhanced 11β-hydroxysteroid dehydrogenase type 1 activity (4), other studies have reported increased baseline cortisol levels in patients with central obesity resulting from an overactivated hypothalamo-pituitary-adrenal (HPA) axis (3, 5, 6) and a positive association of cortisol with visceral fat accumulation (7). In patients with the metabolic syndrome, cortisol levels were even higher, according to the amount of the underlying metabolic features (8, 9). Elevated cortisol levels as seen in Cushing syndrome are known to be associated with a metabolic dysregulation and diabetes eventually leading to cardiovascular mortality (10–12).
Obesity leads to a pathological activation of the innate immune system characterized by changes in cytokines, chemokines, and the number and activation state of various leukocyte populations (13). As a result, interleukin-1β (IL-1β) seems to play a central role. Indeed, IL-1β production is increased in several tissues, including the hypothalamus (14–16). After weight loss by lifestyle interventions (17) or bariatric surgery (18, 19), IL-1β and IL-1β–dependent inflammatory factors such as leukocytes, C-reactive protein (CRP), and IL-6 decrease. Clinical studies have shown that IL-1 antagonism may improve insulin secretion or sensitivity and glycemia in obese individuals as well as in patients with type 2 diabetes (20). However, it is unknown whether these effects are associated with changes in the activation of the HPA axis.
Previous studies have evaluated the interaction between the immune and neuroendocrine systems, showing that several cytokines have stimulatory effects on the HPA axis (21). In particular, IL-1β appears to have a strong stimulatory effect on adrenocorticotropin hormone (ACTH) secretion in rodents (22–24). This was explained by the colocalization of IL-1 and corticotropin-releasing hormone producing cells in the hypothalamus (25, 26) but also by a direct stimulatory effect of IL-1 on the ACTH-producing cells at the level of the pituitary (23, 27, 28). Furthermore, a direct effect on cortisol production in the adrenal glands was reported (27, 29). Similarly, in lean, healthy humans, the intravenous or subcutaneous administration of IL-1β led to elevated plasma ACTH and cortisol levels (27, 30, 31).
Based on this information, we hypothesized that the activation of the IL-1 system observed in some obese individuals may stimulate the HPA axis and therefore that IL-1 antagonism would decrease ACTH and cortisol levels in these individuals.
Methods
Study design
This prospective, open-labeled, interventional study involved 76 patients with obesity and at least one additional feature of the metabolic syndrome. All patients were recruited at the University Hospital Basel from October 2014 to January 2016 and received a total of five injections of a recombinant human IL-1 receptor antagonist (100 mg of anakinra/Kineret®) within 3 days. The consecutive injections were started at 8 pm and continued in 12-hour intervals (Figure 1).
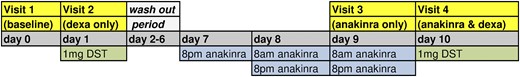
Study schedule for all participating patients. The consecutive injections of anakinra started on day 7 at 8 pm and continued with 12-hour intervals. The primary end point was comparison of baseline cortisol to cortisol levels after three injections of anakinra. DST, dexamethasone suppression test.
Patients
The study was conducted according to the ethical guidelines of the Declaration of Helsinki and the applicable International Conference on Harmonization guidelines on good clinical practice. The local ethical committee approved the study. Written informed consent was obtained from all patients.
Inclusion criteria were age between 18 and 80 years, body mass index (BMI) ≥30 kg/m2, and at least one of the following additional features of the metabolic syndrome: hyperglycemia (hemoglobin A1c ≥5.7%/39 mmol/mol), hypertension (blood pressure ≥130/85mm Hg or treatment of hypertension), or dyslipidemia (high-density lipoprotein <1.0 mmol/L or triglycerides ≥1.7 mmol/L or low-density lipoprotein >3.4 mmol/L or lipid-lowering treatment). Exclusion criteria were medication with glucocorticoids, known Cushing syndrome, chronic inflammatory disease, history of a severe infection within the previous 2 months or an acute infection, severe hematologic, kidney (creatinine clearance <30 mL/min) or liver disease (transaminases more than four times the upper normal range), cancer, history of tuberculosis, chronic alcohol abuse, pregnancy, or breastfeeding.
Study procedures
All patients attended a screening visit in which a study doctor checked medical records and performed blood sampling and a physical examination.
The study sequence consisted of four study visits taking place within 2 weeks for each patient. All visits were scheduled between 7:30 am and 10 am after an overnight fast. To not confound cortisol values by circadian rhythm, study visits for every participant were consistently scheduled at the same time. At each of these four visits, clinical parameters were assessed and blood and salivary samples were taken.
At the first visit (baseline visit) a body impedance analysis was performed. The following day, patients attended the second study visit (dexa only) after a 1-mg dexamethasone suppression test (intake of 1 mg dexamethasone Galepharm® orally at midnight). Between visits two and three, there was a “washout” period of 7 days.
After three injections of anakinra within 2 days, patients attended the third study visit (anakinra only visit) and came the following day for visit four (anakinra plus dexa, with two additional injections of anakinra and intake of 1 mg dexamethasone Galepharm® at midnight). For the detailed study schedule, see Fig. 1.
Laboratory values
Cortisol was measured with an electrochemiluminescence immunoassay (CLIA; Elecsys cortisol test; Roche Diagnostics GmbH, Mannheim, Germany) with an intra-assay coefficient of variation of 1.0% to 1.7% and interassay coefficient of variation of 1.4% to 2.8%. Salivary cortisol was collected with Salivette® Cortisol (article number 51.1534.500; Sarstedt AG & Co., Nümbrecht, Germany). All laboratory analyses were conducted at central laboratories at University Hospital Basel.
IL-6 was measured with CLIA (Elecsys IL-6 test; Roche Diagnostics GmbH) with a reference range <7 pg/mL. CRP was determined with an immunoturbidimetric assay (Tina-quant C-Reactive Protein Gen. 3 Test; Roche Diagnostics GmbH). ACTH was quantified with a CLIA (ACTH Immulite; Siemens Health Care Diagnostics Products Ltd., Gwynedd, UK), with a reference range <46.0 pg/mL. Prolactin was determined with an electro-CLIA (ECLIA) (Elecsys Prolactin II test; Roche Diagnostics GmbH), thyrotropin (TSH) was measured with an ECLIA (Elecsys TSH test; Roche Diagnostics GmbH). Human growth hormone was quantified with a CLIA (Immunlite 2000 hGH; Siemens Health Care Diagnostics Products Ltd.). Luteinizing hormone (LH) and follicle-stimulating hormone (FSH) were determined with an ECLIA (Elecsys LH and FSH Test; Roche Diagnostics GmbH).
Study end points
The predefined primary end point was change in serum morning cortisol levels from baseline to after three injections of anakinra (visit 3). Predefined secondary end points were change in salivary cortisol and ACTH from baseline to after anakinra, changes of CRP and IL-6, and change in serum cortisol levels between a 1-mg dexamethasone suppression test and 1-mg dexamethasone suppression test plus additional administration of anakinra. A further secondary end point was the prediction of inflammatory markers (i.e., IL-6 and CRP) and body composition measurements (e.g., BMI) on treatment response to anakinra.
Power calculation and statistical analysis
Our sample size calculation was based on the assumption that morning cortisol levels would decline from 500 nmol/L (standard deviation ± 90) to 450 nmol/L upon antagonizing IL-1 with anakinra. Sixty-nine participants were needed to give this study a power of 80% to show a significant difference in morning cortisol levels using a paired t test. Assuming a lost to follow-up rate of 10%, we aimed to include a total of 76 patients.
Discrete variables are expressed as counts (percentage) and continuous variables as medians and interquartile ranges (IQRs) unless stated otherwise. For two-group comparison with paired data, we used a Wilcoxon test. We used linear regression models to estimate treatment response of anakinra on changes (Δ) in serum cortisol, salivary cortisol, and ACTH levels before and after treatment of different predefined predictors (i.e., median IL-6 levels, CRP levels, statin use, BMI, waist circumference, age, sex, diabetes, hypertension, low-density lipoprotein cholesterol).
Testing was two-tailed, and P < 0.05 was considered statistically significant. For statistical analysis, we used GraphPad Prism®, version 6.0, for Mac (GraphPad Software, La Jolla, CA) and STATA 12.1 (Stata Corp, College Station, TX).
Results
Baseline characteristics
In total, 212 patients were prescreened. Of these, 136 did not fulfill the eligibility criteria or denied participation. Seventy-six patients were included in the study, but three of these patients did not complete the study: two patients withdrew informed consent after the screening visit and one patient was excluded before receiving the study medication because he suffered an acute cardiac decompensation needing hospitalization. Seventy-three patients received the study medication and completed the trial (Fig. 2).
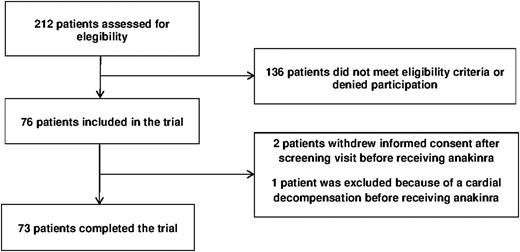
Trial profile. Three of the 76 included patients dropped out before receiving the study medication. All remaining 73 patients completed the trial and were analyzed for the primary end point.
The median age of the 73 patients was 56 years (48 to 63), median BMI was 36.3 kg/m2 (33.3 to 40.9), 50.7% were female, 64.4% of the patients had a type 2 diabetes mellitus, 21.9% suffered from impaired glucose tolerance, 76.7% from hypertension, and 79.5% from dyslipidemia. A complete description of the baseline characteristics is given in Table 1.
Baseline Characteristics of All Patients
| n = 73 | |
|---|---|
| Age, y | 56 (48; 63) |
| BMI, kg/m2 | 36.3 (33.3; 40.9) |
| Weight, kg | 106 (96; 123) |
| Female | 37 (50.7%) |
| Caucasian | 68 (93.2%) |
| Current smoker | 13 (17.8%) |
| Diabetes mellitus type 2 | 47 (64.4%) |
| Impaired glucose tolerance | 16 (21.9%) |
| Arterial hypertension | 56 (76.7%) |
| Dyslipidemia | 58 (79.5%) |
| Comorbidities | |
| Obstructive sleep apnea | 35 (47.9%) |
| Psychiatric diseases | 18 (24.7%) |
| Known hypothyreoidism | 11 (15.1%) |
| Known hypogonadism in men | 2 (5.6%) |
| Medication | |
| Oral anidiabetic drugs | 39 (53.4%) |
| Insulin | 25 (34.2%) |
| GLP-1 analogon | 17 (23.3%) |
| Antihypertensive medication | 53 (72.6%) |
| Statin | 35 (47.9%) |
| NSAID | 4 (5.5%) |
| Antidepressant drugs | 11 (15.1%) |
| Antipsycotic drugs | 1 (1.4%) |
| Anticonvulsive medication | 4 (5.5%) |
| Thyroid hormone substitution | 11 (15.1%) |
| Testosterone Substitution | 2 |
| Contraceptive pill | 1 |
| Clinical features | |
| Visceral obesity | 73 (100%) |
| Abdominal circumference, cm | 121 (112; 131) |
| Purple striae | 4 (5.5%) |
| Moon face | 20 (27.4%) |
| Buffalo hump | 27 (37.0%) |
| Hirsutism | 0 (0%) |
| Easy bruising | 0 (0%) |
| Facial plethora | 3 (4.1%) |
| Akne | 2 (2.7%) |
| Body impedance analysis | |
| Fat mass, % of total body | 36 (26; 42) |
| Muscle mass, % of total body | 45 (39; 53) |
| Fat free mass, % of total body | 64 (58; 74) |
| Body metabolic rate, kcal | 1900 (1700; 2190) |
| Laboratory values | |
| HbA1c (%) | 6.5 (5.8; 8.2) |
| Triglycerides (mmol/L) | 1.7 (1.3; 2.5) |
| Total cholesterol (mmol/L) | 4.6 (3.6; 5.3) |
| LDL-cholesterol (mmol/L) | 2.4 (1.7; 3.1) |
| HDL-cholesterol (mmol/L) | 1.1 (0.9; 1.4) |
Data are median (IQR) or number (%), unless otherwise stated.
Effects of IL-1 antagonism on the HPA axis
Morning serum cortisol levels decreased upon IL-1 antagonism from median (IQR) 452 nmol/L (374; 549) at baseline to 423 nmol/L (337; 491) after three injections of anakinra [absolute difference, −38.7; 95% confidence interval (CI), −64 to −13.4; P < 0.01]. Salivary cortisol levels decreased from 19.2 nmol/L (15; 25.5) to 15.5 nmol/L (11.9, 23.7) (absolute difference, −2.8; 95% CI, −4.4 to −1.3; P < 0.001), and ACTH levels from 26.4 pg/mL (19.5; 32.9) to 23.7 pg/mL (19; 33.2) (absolute difference, −2.2; 95% CI, −4.2 to −0.1; P = 0.038), respectively. In contrast, there was no change in serum cortisol levels after the 1-mg dexamethasone suppression test and the dexamethasone suppression test plus IL-1 antagonism [28 nmol/L (19; 45) and 27.5 nmol/L (20; 45), P = 0.17] [Fig. 3(a–c)].
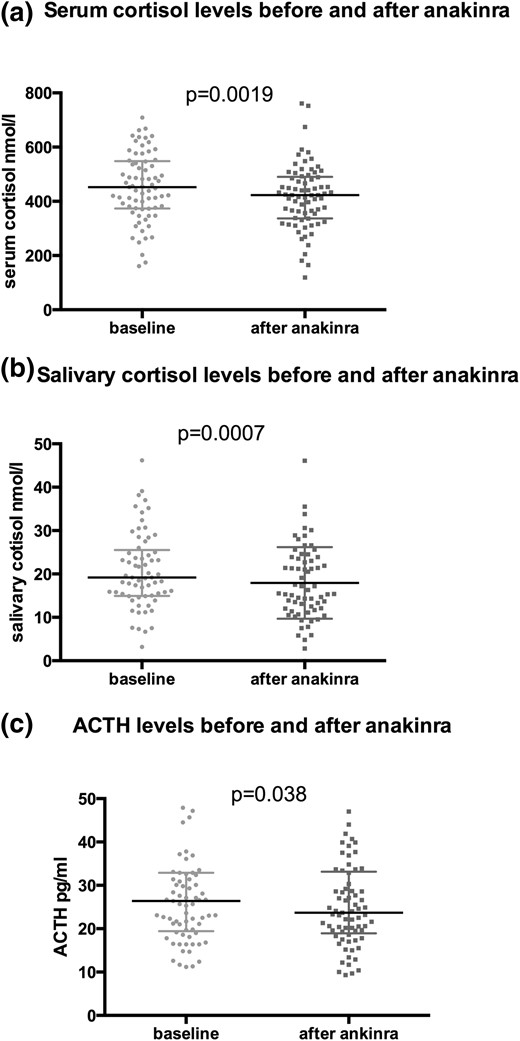
Comparison of serum cortisol, salivary cortisol, and ACTH levels before and after IL-1 antagonism. Comparisons of baseline serum cortisol (a), salivary cortisol (b), and ACTH levels (c) with their equivalent after short-term treatment with anakinra using a Wilcoxon test.
There was no change in other pituitary hormones (i.e., LH, FSH, TSH, growth hormone, and prolactin) upon IL-1 antagonism. As expected, there was a decrease of inflammatory parameters (leukocytes, neutrophile granulocytes, CRP, and IL-6 upon IL-1 antagonism) (Table 2).
Effect of Anakinra
| Before Anakinra (n = 73) Median (IQR) | After Anakinra (n = 73) Median (IQR) | Delta Before/After Anakinra (n = 73) Mean (95% CI) | P Value | |
|---|---|---|---|---|
| Hemoglobin, g/L | 144 (133; 151) | 143 (134; 151) | 2.2 (−2.0; 6.4) | 0.78 |
| Platelets, ×109/L | 244 (206; 276) | 248 (208; 289) | 3.7 (−3.8; 11.1) | 0.28 |
| Leukocytes, ×109/L | 7.1 (6.4; 8.7) | 5.7 (4.8; 6.8) | −1.3 (−2.1; −0.6) | <0.0001 |
| Neutrophil granulocytes, ×109/L | 4.3 (3.4; 5.3) | 2.8 (2.2; 3.7) | −0.4 (−2.2; 1.4) | <0.0001 |
| C-reactive protein, mg/L | 3.4 (1.6; 6.8) | 2.6 (1.2; 4.6) | −1.9 (−3.2; −0.5) | <0.0001 |
| Interleukin-6, pg/mL | 3.7 (2.8; 5.8) | 1.5 (1.5; 2.4) | −2.6 (−3.3; −1.9) | <0.0001 |
| Serum cortisol, nmol/L | 452 (374; 549) | 423 (337; 491) | −38.7 (−64; −13.4) | 0.0019 |
| ACTH, pg/mL | 26.4 (19.5; 32.9) | 23.7 (19; 33.2) | −2.2 (−4.2; −0.1) | 0.038 |
| Salivary cortisol, nmol/L | 19.2 (15; 25.5) | 15.5 (11.9, 23.7) | −2.8 (−4.4; −1.3) | 0.0007 |
| Serum cortisol after 1 mg DST | 28 (19; 45) | 27.5 (20; 45) | 10.6 (−2.5; 23.7) | 0.17 |
| Prolactin, mU/L | 224 (142; 297) | 213 (153; 306) | 10.8 (−7.5; 29.1) | 0.13 |
| TSH, mIU/La | 2.3 (1.5; 3.0) | 2.2 (1.6; 2.9) | −0.1 (−0.2; 0.1) | 0.58 |
| Growth hormone, mU/L | 1.7 (0.4; 4.8) | 1.2 (0.4; 3.7) | −1.5 (−3.6; 0.6) | 0.11 |
| FSH, IU/L | 10 (5.4; 32) | 10 (4.7; 29.5) | −0.4 (−1.5; 0.6) | 0.62 |
| LH, IU/L | 7.8 (4.6; 18.5) | 7.1 (4.2; 19.4) | −0.4 (−2.2; 1.4) | 0.12 |
| Albumin, g/L | 37 (36; 39) | 37 (35; 39) | −0.2 (−0.7; 0.2) | 0.30 |
| Systolic blood pressure, mm Hg | 139 (129; 152) | 135 (125; 148) | −5.2 (−8.5; −1.8) | 0.0006 |
| Diastolic blood pressure, mm Hg | 85 (77; 91) | 84 (78; 91) | 0.0 (−2.0; 1.9) | 0.67 |
| Heart rate, beats/min | 77 (70; 86) | 73 (66; 83) | −2.9 (−4.7; −1.0) | 0.0029 |
| Temperature, C° | 36.4 (36.1; 36.8) | 36.4 (36.1; 36.7) | 0.0 (−0.1; 0.1) | 0.78 |
Data are expressed as median (IQR) or number (%) and absolute differences in mean (95% CI) unless stated otherwise. P values were assessed using the Wilcoxon test.
Only 62 patients without thyroid hormone substitution were included.
Predictors of treatment response
We also investigated treatment response to IL-1 antagonism in different subgroups [Supplemental Fig. 4(a–c)]. As a result, high baseline IL-6 was an important predictor for a positive treatment response to IL-1 antagonism. Compared with patients with IL-6 levels below the median (i.e., 3.7 pg/mL), patients with baseline IL-6 ≥3.7 pg/mL had a more pronounced decrease in salivary cortisol (mean difference, −3.40; 95% CI, −6.49 to −0.31; P = 0.03) and in ACTH (mean difference, −3.87; 95% CI, −7.93 to 0.18; P = 0.06). In contrast, CRP did not predict the IL-1 receptor antagonist treatment response (data not shown). Patients on statin therapy showed a poorer treatment response with regard to delta salivary cortisol levels compared with patients without statin treatment (mean difference, 3.02; 95% CI, −0.01 to 6.13; P = 0.057).
A BMI lower than the median (i.e., 36.6 kg/m2) was associated with a more pronounced effect on delta serum cortisol levels (mean difference 48.0; 95% CI, −1.65 to 97.7; P = 0.06). Conversely, a higher percentage of body fat mass [above median (i.e., 36%)] tended to be associated with a better treatment response concerning delta serum cortisol (mean difference, −36.45; 95% CI, −86.80 to 13.89; P = 0.15). We did not find a more pronounced effect in the subgroup of obese patients with a psychiatric diagnosis (n = 18) (data not shown).
Side effects/adverse events
No patient withdrew from the study because of drug-related adverse events. There were no severe and no unexpected adverse events related to the study drug anakinra, especially no neutropenia. Main side effects were mild headache (n = 10) and mild transient injection site reaction such as pain and local reddening (n = 10). Three patients developed an exanthema 7 to 10 days after the first injection of anakinra, with a complete resolution after a maximum of 3 weeks. All reported adverse events are listed in Table 3.
Adverse Events Associated With Anakinra/Kineret®
| N = 73 | |
|---|---|
| Mild transient injection site reactions | 10 (13.6%) |
| Exanthema | 3 (4.1%) |
| Mild headache | 10 (13.6%) |
| Nausea | 1 (1.4%) |
| Malaise | 3 (4.1%) |
| Vertigo | 5 (6.8%) |
| N = 73 | |
|---|---|
| Mild transient injection site reactions | 10 (13.6%) |
| Exanthema | 3 (4.1%) |
| Mild headache | 10 (13.6%) |
| Nausea | 1 (1.4%) |
| Malaise | 3 (4.1%) |
| Vertigo | 5 (6.8%) |
Data are number (%).There were no severe and no unexpected adverse events related to the study drug anakinra, especially no neutropenia.
Discussion
The main finding of this study is that IL-1 antagonism leads to an inhibition of the HPA axis decrease in ACTH and cortisol levels as well as a decrease in systolic blood pressure and heart rate in obese individuals with at least one additional feature of the metabolic syndrome. This suggests a direct interaction between the pathologic activation of the innate immune system and stimulation of the HPA axis in obesity. The inhibition of the HPA axis upon IL-1 antagonism seems to depend on the extent of inflammation. It was especially pronounced in patients with a high inflammatory state (i.e., high IL-6) and was reduced in patients on statin therapy, which is known to have anti-inflammatory effects (32).
IL-1 antagonism has been shown to improve glucose metabolism (33) and is currently under investigation in the Cardiovascular Risk Reduction Study (Reduction in Recurrent Major CV Disease Events) (CANTOS) Trial (NCT01327846) as an anti-inflammatory agent for secondary prevention of cardiovascular disease and new onset or progression of type 2 diabetes in patients with recent myocardial infarction (34). Our data add a possible mechanism of how IL-1 antagonists may improve glucose metabolism and thus reduce cardiovascular risk. Although the magnitude of the effects is mild, this may still have profound consequence over the years. Moreover, cortisol levels might be a predictor for treatment response of IL-1 antagonism in diabetic patients.
Notably, we found an important decrease in systolic blood pressure and heart rate upon IL-1 antagonism. To our knowledge, this effect of IL-1 antagonism has not yet been described in humans; however, in rodents, it has been reported that IL-1 antagonism attenuated hypertension. The authors postulated a mechanism via salt retention in the kidney, which is regulated by a nitric oxide–dependent mechanism (35). Our data suggest an additional effect via cortisol, which is known to increase blood pressure. We speculate that the decrease in heart rate might be explained by the permissive effect of glucocorticoids on catecholamines (36). As a result, the decrease of cortisol levels upon IL-1 antagonism might lead to a decline in the action of catecholamines and to a negative chronotropic effect. This finding might point to a causal treatment approach of IL-1 antagonism for arterial hypertension via reduction of cortisol levels.
The inhibition of the HPA axis upon IL-1 antagonism seems to depend on the extent of activation of the innate immune system. Patients with high IL-6 levels had a better treatment response, whereas patients on statins showed a less pronounced effect. In contrast and unexpectedly, BMI was a negative predictor for treatment response. It is possible that the underlying mechanism of treatment is a dose-dependent effect of the study drug, anakinra, with a reduced effect in patients with increased body volume. Increased body fat mass, in contrast, was associated with a more pronounced treatment effect, suggesting that the stimulatory effect on the HPA axis via inflammation is dependent on the amount of adipose tissue in obese individuals.
That there was not only an effect of IL-1 antagonism on cortisol levels, but also on ACTH levels, suggests a central effect on the HPA axis via hypothalamus or the pituitary gland. An additional direct effect on the adrenal glands is also possible.
There was no difference in cortisol levels after the 1-mg dexamethasone suppression test only in comparison with the 1-mg dexamethasone suppression test plus IL-1 antagonism. It is possible that dexamethasone, with its strong immunosuppressive properties, overrode the effect of IL-1 antagonism. In addition, the chronic inflammation state of obesity involves different cytokines. Dexamethasone might have a broader effect on other cytokines possibly involved in the stimulation of the HPA axis.
Apart from the HPA axis, we found no effect of IL-1 antagonism on other pituitary hormones. IL-1 has been reported to have an inhibitory effect on growth hormone, TSH, LH, and FSH in vitro and in rats (37). However, we are not aware of data evaluating effects of IL-1 antagonism on pituitary hormones in humans. The lack of effect of IL-1 antagonism on other pituitary hormones in our trial might be due to the rather short treatment duration.
Our study has limitations. First, the study was not conducted as a randomized placebo-controlled, but rather as a prospective open-label, trial. However, we investigated robust end points, and the observed anti-inflammatory effects of anakinra, which correlated with the decrease in cortisol, are unlikely from “placebo effects.” Second, patients had only a short treatment exposure of three injections of anakinra. It is possible that longer treatment duration would have resulted in a more pronounced treatment effect. In line with this reasoning, improvement of glucose metabolism upon IL-1 antagonism requires several weeks of treatment to reach a maximal effect (20).
We herein show that IL-1 antagonism in obese patients reduced the overactivated HPA axis leading to a decrease in ACTH and cortisol levels as well as a decrease in systolic blood pressure and heart rate. If our findings are confirmed in a placebo-controlled, double-blind study, IL-1 antagonism could be a treatment option to improve cortisol levels in obesity and thereby prevent metabolic and cardiovascular complications.
Abbreviations:
- ACTH
adrenocorticotropin hormone
- BMI
body mass index
- CI
confidence interval
- CLIA
electrochemiluminescence immunoassay
- CRP
C-reactive protein
- ECLIA
electro-electrochemiluminescence immunoassay
- FSH
follicle-stimulating hormone
- HPA
hypothalamo-pituitary-adrenal
- IL
interleukin
- IQR
interquartile range
- LH
luteinizing hormone
- TSH
thyrotropin.
Acknowledgments
We thank all patients for their participation in this study, the staff of the laboratory and the Department of Endocrinology, Diabetology & Metabolism of University Hospital Basel, and our study nurses for their most helpful support during the study, especially Cemile Bathelt and Nina Hutter.
This work was supported by the Swiss National Foundation (Grant no. PP00P3-12346) (to M.C.-C.), the “Wissenschaftspool 2014” of the University Hospital Basel (to S.A.U.), and the University of Basel (Nachwuchsförderung 2015) (to S.A.U.). The funding sources were neither involved in the design of the study nor in writing of the manuscript. The authors have no conflicts of interest to declare.
Author contributions: S.A.U., P.S., M.Y.D., and M.C.-C. designed the study. S.A.U. recruited the participating patients; S.A.U. and P.S. did the statistical analyses; S.A.U., P.S., M.Y.D., and M.C.-C. interpreted the data; and S.A.U., P.S., F.E., M.Y.D., and M.C.-C. were involved in the writing of the manuscript.
Clinical trial registry: ClinicalTrials.gov no. NCT02227420 (registered 26 August 2014).
Disclosure Summary: The authors have nothing to disclose.
References
World Health Organization. Fact sheet No 311, obesity and overweight (online). http://www.who.int/mediacentre/factsheets/fs311/en/.Accessed 21 February 2017.
Author notes
Address all correspondence to: Sandrine Urwyler, MD, University Hospital, Petersgraben 4, CH-4031 Basel, Switzerland. E-mail: [email protected].
