


Abstract
Growth hormone (GH) is known to be diabetogenic, but the risk of diabetes in individuals treated with GH in childhood has been little evaluated, and conflicting results have been obtained.
To investigate the prevalence of diabetes and gestational diabetes in a population-based cohort of patients treated with GH for short stature in childhood in France.
Participants were a population-based cohort of 5100 children with idiopathic isolated GH deficiency, idiopathic short stature, or short stature in children born short for gestational age who started GH treatment between 1985 and 1996. Data on the delivery of diabetes drugs in 2009 and 2010 were obtained from the French national health insurance database. Cases in patients and controls were identified from diabetes drugs deliveries.
The prevalence of diabetes was calculated and compared with that in the general population, determined on the basis of data from the same source, with the same definition.
At a mean age of 30 years, no difference in the prevalence of treated diabetes (oral drugs or insulin) was found between subjects treated with GH and the general population in France, regardless of sex. Similarly, the risk of insulin-treated gestational diabetes was similar in patients and in the reference population.
No difference in the risk of diabetes was found between GH-treated patients and the reference population. These results are reassuring, but further studies with a longer follow-up are required to evaluate the risk of diabetes with age in these patients.
The effects of growth hormone (GH) on carbohydrate metabolism have been known for almost a century, but the underlying physiological mechanisms are complex and involve a number of different pathways (1). Indeed, GH directly induces insulin resistance in muscle and fat, while exerting a metabolic effect on the adipose tissue, liver, skeletal muscle, and protein metabolism that is probably mediated by substrate competition between intermediates of glucose and fatty acids. Moreover, insulin-like growth factor 1 (IGF-1), which has insulin-like activity, can act as an insulin antagonist, increasing this diabetogenic effect (2–4). In patients with acromegaly, an increase in GH levels increases the risk of impaired glucose tolerance and overt diabetes mellitus, with reported prevalence values of 15 to 37%, depending on the series considered (5, 6).
Little is known about the risk of diabetes during or after GH treatment in childhood, and the available data are conflicting. In 2001, the Growth Hormone Research Society concluded that GH treatment resulted in no increase in the incidence of type 1 or type 2 diabetes but that some subgroups of patients with a higher inherent risk of developing diabetes [Turner and Prader–Willi syndromes and children born small for gestational age (SGA)] should be monitored carefully (7). The findings of a recent workshop on GH safety were also reassuring (8). In 2010, the incidence of diabetes in the National Cooperative Growth Study cohort was reported to be about 14 per 100,000 GH treatment-years, but no standardized incidence ratio was assigned to these events due to the absence of reference data for the pediatric population (9). By contrast, Cutfield et al. (10) showed that the risk of type 2 diabetes in children treated with GH was six times higher than expected from data for age-matched children from two studies. In a small group of young adults who had been born SGA and were evaluated 6.5 years after the cessation of GH treatment, insulin resistance was shown to be reversible, and no detectable increase in the risk of diabetes was identified (11). Findings concerning the incidence of diabetes after GH replacement treatment in adults are also discordant, with some studies indicating an increase in diabetes prevalence and others indicating no effect (12).
The Safety and Appropriateness of Growth Hormone Treatments in Europe (SAGhE) project is a multinational European study aiming to evaluate long-term mortality and cancer morbidity in subjects treated with GH in childhood. We used the French SAGhE study database, which includes extensive morbidity data obtained with patient identifiers from the French national health insurance information database to evaluate the prevalence of diabetes including gestational diabetes in a population-based cohort of patients treated with GH for short stature during childhood and to compare this prevalence with that for the general population in France over the same period.
Methods
Patients
As previously described (13, 14), we used the mandatory register of all patients treated with GH in France until 1996 (Association France-Hypophyse); we selected those patients treated only with recombinant GH, and not with pituitary-derived GH, who were born before 1 January 1990. Patients were assigned to three risk categories for long-term morbidity and mortality on the basis of the clinical condition leading to the initiation of GH treatment (Fig. 1). Patients were considered to be at high risk if they had been treated for serious conditions, such as cancer or chronic renal failure. Patients were assigned to the intermediate-risk group if they had been treated for multiple pituitary hormone deficiency or pediatric syndromes, such as the Turner, Prader–Willi, or Fanconi syndromes. The low-risk group included patients treated for idiopathic isolated GH deficiency, idiopathic short stature, short stature in children born short for gestational age, or isolated GH deficiency associated with a minor craniofacial malformation, such as cleft lip. We included only the low-risk patients in this study, because their baseline risk of the principal morbid conditions is thought to be similar to that of the general population, with the exception of the higher frequency of metabolic syndrome in children born SGA. There were 6874 eligible patients, as in our previous study (14).
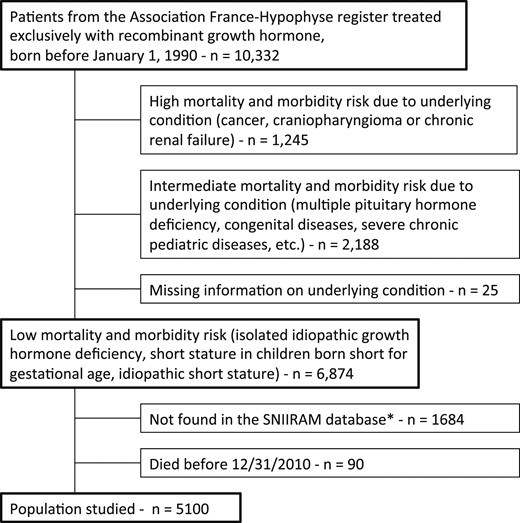
Flowchart of the SAGhE study in France, with risk group for mortality and morbidity, and population studied. *Patients not found in the SNIIRAM database are those covered by the National Health Insurance Fund for Agricultural Workers and Farmers (Mutualité Sociale Agricole), the National Health Insurance Fund for the Self-used (Régime Social des Indépendants), or others minor additional insurances not affiliated to national Health Insurance Fund for Salaried Workers (Caisse Nationale d'Assurance Maladie des Travailleurs Salaries). In addition, some patients might have been missed by the matching scheme used to identify patients from the France-Hypophyse cohort in the SNIIRAM database.
As described in the flowchart, patients not identified by the French national health insurance information database [Système National d'Information Interrégimes de l'Assurance Maladie (SNIIRAM)] were excluded to facilitate comparison between our findings and references rates for the same population (comparison with reference values from SNIIRAM data, covering about 90% of the general population in France). As this was a prevalence study, we also excluded patients who died before 31 December 2010 (n = 90), as described before (13). The final analysis therefore included 5100 patients.
Data collected
Childhood data
Data for patient characteristics, GH and associated treatments, and growth progression were routinely collected at baseline and at regular follow-up visits and were obtained from pediatric endocrinologists until 1996, when the national compulsory France-Hypophyse register was abolished. Additional follow-up data for GH treatment were collected from clinical centers in 2008 to 2010. Birth weight and birth length are expressed as z scores for gestational age according to the Usher and McLean charts (15), and height and weight are expressed as z scores for age. The mean and maximum dose of GH was calculated in micrograms per kilogram per day. Body mass index was calculated from the latest height and weight known (close to or at the end of treatment, or at adult age as available) and expressed in standard deviation score for age (16).
Follow-up data
We used data from the SNIIRAM (17, 18), which records all drugs delivered to outpatients nationwide, to identify prevalent cases of diabetes in patients who had received at least three deliveries of an antidiabetic drug (oral or insulin) within the year 2010 (see the Supplemental Appendix for the list of drugs used). Patients who had received at least one delivery of insulin were considered to have been treated with insulin, regardless of whether they also received oral antidiabetic agents. It was not possible to differentiate between type 1 and type 2 diabetes on the basis of the available data, and no data on family history of diabetes was available.
An ancillary study on gestational diabetes was also carried out. All pregnancies leading to deliveries between January 2008 and December 2010 were identified in the French SAGhE cohort on the basis of the International Classification of Diseases–10 codes corresponding to delivery (060 to 084). Cases of gestational diabetes treated with insulin were identified by cross-referencing with insulin delivery data (insulin delivered only once or twice in the course of a year or during a period straddling 2 years, with the birth occurring less than 3 months after the last insulin delivery).
Statistical analyses
We evaluated the risk of diabetes by calculating standardized prevalence ratios (SPRs), with adjustment for age and sex, using reference rates of the prevalence of diabetes treatment in French patients in 2010 from SNIIRAM, including separate subtypes (diabetes treated with insulin and diabetes treated exclusively with oral antidiabetic drugs). These reference rates were derived from the same source of information (SNIIRAM) and were based on the same definitions applied to the general population during 2010 in France. The number of GH-treated subjects at risk was calculated for each 5-year age class, separately for men and women, after excluding those who had died before the end of 2010. A similar calculation was also performed for 2009 (observed prevalent cases and reference rates). We then calculated the expected number of prevalent cases for GH-treated subjects, by multiplying the age- and sex-specific prevalence rates by the number of people at risk. SPRs were estimated by dividing the number of observed prevalent cases by the number of expected prevalent cases. Significance tests were performed and 95% confidence intervals (CIs) for the SPR were calculated with Byar’s approximation to the exact Poisson test and exact Poisson limits.
The expected proportion of subjects presenting insulin-treated gestational diabetes was calculated from the reference rates for the French general population in 2011, by 5-year age class, with SNIIRAM. This made it possible to compare the proportion of subjects displaying insulin-treated gestational diabetes in our cohort with the proportion expected on the basis of references rates.
Standard protocol approvals, registrations, and patient consent
This study was approved by the Comité Consultatif sur le Traitement de l’Information en Matière de Recherche dans le Domaine de la Santé and the Commission Nationale de l’Informatique et des Libertés (the national data protection agency). The use of the Registre National Interrégimes de l’Assurance Maladie was approved by a specific statute.
Results
There were 6874 patients in the group of patients at low risk of mortality and morbidity, 5100 of whom could be traced via the SNIIRAM database. The data for these 5100 patients were analyzed (Table 1). These patients did not differ significantly from the 1774 not identified in the SNIIRAM database or who died before the end of 2010. Most of the patients had isolated GH deficiency, as determined by GH stimulation tests (peak <10 ng/mL; n = 3440, 67%). Some of the subjects with a peak GH >10 ng/mL were considered to have neurosecretory dysfunction on the basis of nocturnal GH profiles, whereas the others were considered to be treated for short stature associated with being short for gestational age (n = 250, 3%) or for idiopathic short stature (n = 643, 13%), although this is not an approved indication in France. The mean interval between the beginning of GH treatment and the follow-up evaluation was 19.2 years, and the mean chronological age of the patients on 31 December 2010 was 30.1 years. The mean duration of treatment was four years, with mean doses slightly below the current recommendations for isolated GH deficiency.
Main Characteristics of Patients and GH Treatment in the Low-Risk Group
| Studied Sample, N = 5100 | Excluded Patients, N = 1774 | |
|---|---|---|
| Male patients, n (%) | 3293 (65) | 1217 (69) |
| Indication for GH treatment, n (%) | ||
| Isolated GH deficiency | ||
| Maximum peak GH <3 µg/L | 221 (4) | 74 (4) |
| Maximum peak GH ≥3 µg/L and <7 µg/L | 1175 (23) | 382 (22) |
| Maximum peak GH ≥7 µg/L and <10 µg/L | 2044 (40) | 704 (40) |
| Missing value for maximum peak GH | 370 (7) | 146 (8) |
| Maximum peak GH ≥10 µg/L | ||
| Neurosecretory dysfunction | 397 (8) | 150 (8) |
| Idiopathic short stature | 643 (13) | 225 (13) |
| SGA | 250 (3) | 93 (5) |
| Year of treatment initiation, n (%) | ||
| 1985 to 1987 | 347 (6) | 159 (9) |
| 1988 to 1990 | 1780 (35) | 690 (38) |
| 1991 to 1993 | 1761 (35) | 601 (34) |
| 1994 to 1997 | 1212 (24) | 324 (18) |
| Birth length (SDS for gestational age) | −1.2 ± 1.2 (n = 3689) | −1.2 ± 1.3 (n = 1186) |
| Birth weight (SDS for gestational age) | −0.6 ± 1.2 (n = 3865) | −0.6 ± 1.2 (n = 1205) |
| Birth weight (g) | 3047 (n = 4301) | 3033 (n = 1459) |
| Children born SGA, n (%) | ||
| (birth weight or length ≤–2 SDS for gestational age) | ||
| Yes | 969 (20) | 329 (18) |
| No | 2925 (57) | 939 (53) |
| Missing data | 1206 (23) | 506 (29) |
| Children with a birth weight under 2500 g (%) | 527 (10) | 198 (11) |
| Chronological age at treatment initiation (y) | 10.9 ± 3.4 (n = 5100) | 11.3 ± 3.3 (n = 1774) |
| Height at start of treatment (SDS) | −2.7 ± 0.8 (n = 4678) | −2.7 ± 0.8 (n = 1607) |
| Weight at start of treatment (SDS) | −1.6 ± 0.9 (n = 4656) | −1.6 ± 0.9 (n = 1586) |
| Mean dose (µg/kg/d) | 24.7 ± 12.2 (n = 4627) | 23.8 ± 12.6 (n = 1585) |
| Treatment duration (y) | 4.0 ± 2.7 (n = 4712) | 3.6 ± 2.4 (n = 1665) |
| Chronological age at end of treatment (y) | 15.1 ± 2.7 (n = 4712) | 15.1 ± 2.7 (n = 1665) |
| Chronological age at 12/31/2010 (y) | 30.1 ± 4.3 | |
| Duration of follow-up from start of GH treatment to 12/31/2010 (y) | 19.2 ± 2.7 (n = 5100) |
Values are expressed as the mean ± SD or n (%).
Abbreviation: SDS, standard deviation score.
We identified 26 cases of diabetes during the year 2010 (Table 2): 17 of these patients were treated with insulin, and the other nine were treated with oral drugs only. Four of the subjects were born SGA, and data for birth characteristics were missing for five patients. The mean (±SD) dose of GH for these patients was 27.9 (17.7) µg/kg/d, with two patients having mean doses above 50 µg/kg/d. The body mass index after the start of GH treatment was available for 23 patients, 12 of whom were at adult age, and six of whom were above +2 SD.
Clinical Characteristics and Characteristics of GH Treatment of the 26 Cases of Diabetes
| Sex | Birth Length (cm) | Birth Weight (g) | Birth Length - SDS Usher | Birth Weight - SDS Usher | SGA | GH Peak Maximum (µg/L) | Age at Start of GH Treatment (y) | Treatment Duration (y) | Mean Dose (µg/kg/d) | Dose Maximum (µg/kg/d) | BMI SDS (Adult Age or Latest Visit) | Type of Diabetes Treatment | Age at Diabetes Diagnosis | |
|---|---|---|---|---|---|---|---|---|---|---|---|---|---|---|
| 1 | F | 49.0 | 2500 | −1.2 | −2.1 | Yes | 2.8 | 17.0 | 0.8 | 18.1 | 24.5 | +3.6 | Insulin | U |
| 2 | M | 51.5 | 3500 | 0.2 | 0.0 | No | 7.5 | 8.7 | 8.2 | 27.8 | 32.5 | +1.3 | Insulin | 21.4 |
| 3 | F | 48.0 | 3600 | 0.3 | 2.9 | No | 9.6 | 13.4 | 1.9 | 27.5 | 32.4 | +1.4 | Insulin | 4.2a |
| 4 | F | 51.0 | 3370 | −0.1 | −0.2 | No | 5.1 | 15.4 | 1.4 | 19.8 | 21.7 | +1.5 | Insulin | 12.6a |
| 5 | M | — | — | — | — | U | — | 15.1 | 1.3 | — | — | — | Insulin | 13.9a |
| 6 | F | 49.0 | 3000 | −1.2 | −1.0 | No | 11.1 | 12.4 | — | 31.8 | 33.1 | +1 | Insulin | 23.3 |
| 7 | M | 47.0 | 2620 | −1.5 | −1.3 | No | 3.6 | 12.8 | — | 24.2 | 26 | −1.2 | Insulin | 25.5 |
| 8 | F | — | — | — | — | U | — | 13.9 | 1.0 | — | — | — | Insulin | 20.7 |
| 9 | M | 50.0 | 3630 | −0.6 | 0.3 | No | 21.7 | 6.4 | 5.5 | 23.1 | 27 | +0.8 | Insulin | 19.4 |
| 10 | F | 51.0 | 3500 | −0.4 | −0.1 | No | 10.7 | 12.5 | 3.0 | 23.1 | 28.2 | −2.2 | Insulin | 30.4 |
| 11 | F | 48.0 | 3650 | −1.5 | 0.7 | No | 5.1 | 6.5 | 3.8 | 21.5 | 20.4 | +3 | Insulin | 17.0 |
| 12 | M | 48.5 | 3500 | −1.7 | −0.1 | No | 9.8 | 9.3 | 2.6 | 21.7 | 23.2 | +0.3 | Insulin | 25.6 |
| 13 | M | 50.0 | 3500 | −0.9 | −0.1 | No | 14.0 | 6.1 | 6.8 | 20.5 | 24.2 | −0.1 | Insulin | 23.4 |
| 14 | M | 47.0 | 2450 | −2.0 | −2.1 | Yes | 8.4 | 13.8 | 1.0 | 24.6 | 24.6 | −1.8 | Insulin | 5.6a |
| 15 | M | 47.5 | 3300 | −1.9 | −0.4 | No | 4.0 | 10.7 | 7.3 | 30.8 | 36.1 | −0.3 | Insulin | 11.8 |
| 16 | M | 48.0 | 3260 | −1.9 | −0.6 | No | 4.2 | 8.8 | 3.8 | 22.2 | 23 | −0.7 | Insulin | 25.4 |
| 17 | F | 42.0 | 2200 | −3.0 | −1.1 | Yes | 6.2 | 8.7 | . | 33.8 | 44.3 | +1.5 | Insulin | 22.7 |
| 18 | M | — | — | — | — | U | — | 6.6 | 2.9 | 63.6 | 72.5 | −0.2 | Oral antidiabetic | U |
| 19 | M | — | — | — | — | U | — | 14.9 | 3.0 | 95.2 | 95.2 | +3.3 | Oral antidiabetic | U |
| 20 | M | 47.0 | 3050 | −1.5 | −0.2 | No | 8.1 | 13.5 | 1.8 | 17.3 | 18 | +3.5 | Oral antidiabetic | U |
| 21 | F | — | — | — | — | U | — | 6.7 | 5.0 | — | — | — | Oral antidiabetic | U |
| 22 | M | 56.0 | 3080 | 2.5 | −0.9 | No | 3.6 | 11.7 | 5.5 | 27.4 | 33.3 | −0.3 | Oral antidiabetic | U |
| 23 | F | 47.0 | 2500 | −1.5 | −1.6 | No | 2.8 | 8.5 | 2.1 | 21.9 | 23.8 | +2.3 | Oral antidiabetic | U |
| 24 | F | 50.0 | 3250 | −0.4 | −0.3 | No | 2.1 | 12.6 | 2.1 | 13.6 | 13.2 | +3.7 | Oral antidiabetic | U |
| 25 | M | 47.0 | 3530 | −2.2 | 0.1 | Yes | 4.3 | 11.4 | 2.7 | 20.0 | 21.2 | −0.5 | Oral antidiabetic | U |
| 26 | F | 50.0 | 3850 | −0.9 | 0.6 | No | 2.3 | 1.5 | 0.2 | 12.7 | 13.1 | −0.2 | Oral antidiabetic | U |
Abbreviations: —, not available in the database; BMI, body mass index; F, female; M, male; SDS, standard deviation score; U, unknown.
Patients who were already on insulin before the start of GH treatment.
SPRs, calculated with the national reference values derived from the SNIIRAM database for the same year, are reported in Table 3. We observed no overall difference in the risk of diabetes between the GH-treated and general population (SPR = 1.0, 95% CI, 0.7 to 1.5). We also found no difference between these two populations in analyses considering insulin-treated patients and patients treated exclusively with oral drugs separately. The prevalence of insulin-treated cases of diabetes was significantly higher in patients aged between 25 and 29 years than in the other age groups considered (SPR = 2.3, 95% CI, 1.1 to 4.0). We did not exclude patients treated with antidiabetic drugs before GH treatment from this prevalence study, but we did evaluate the possible influence of including these patients on our results. When we excluded the four patients concerned (all treated with insulin, none with oral antidiabetic drugs), the excess of risk of insulin-treated diabetes in this age-class disappeared (SPR = 1.8, 95% CI, 0.8 to 3.5). A similar analysis on the data extracted for 2009 yielded similar results (Supplemental Table 1).
SPR for Diabetes for the Year 2010, Calculated With Reference Rates From the SNIIRAM Database for the Same Year
| Oral Antidiabetic | Insulin | All | ||||||||||
|---|---|---|---|---|---|---|---|---|---|---|---|---|
| Cases Observed, n | Prevalence Rates SNIIRAM (%) | Cases Expected, n | SPR (95% CI) | Cases Observed, n | Prevalence Rates SNIIRAM (%) | Cases Expected, n | SPR (95% CI) | Cases Observed, n | Prevalence Rates SNIIRAM (%) | Cases Expected, n | SPR (95% CI) | |
| All patients | 9 | 9.5 | 1.0 (0.4 to 1.8) | 17 | 16.1 | 1.1 (0.6 to 1.7) | 26 | 25.6 | 1.0 (0.7 to 1.5) | |||
| Sex | ||||||||||||
| Male | 5 | 6 | 0.8 (0.3 to 1.9) | 9 | 10.8 | 0.8 (0.4 to 1.6) | 14 | 16.9 | 0.8 (0.5 to 1.4) | |||
| Female | 4 | 3.4 | 1.2 (0.3 to 3.0) | 8 | 5.3 | 1.5 (0.7 to 3.0) | 12 | 8.7 | 1.4 (0.7 to 2.4) | |||
| Age class (y) | ||||||||||||
| 20 to 24, n = 720 | 2 | 0.09 | 0.3 | 7.2 (0.8 to 25.9) | 1 | 0.50 | 1.8 | 0.6 (0.01 to 3.1) | 3 | 0.58 | 2.1 | 1.4 (0.3 to 4.2) |
| 25 to 29, n = 1701 | 1 | 0.21 | 1.7 | 0.6 (0.01 to 3.4) | 11 | 0.57 | 4.9 | 2.3 (1.1 to 4.0)a | 12 | 0.78 | 6.6 | 1.8 (0.9 to 3.2) |
| 30 to 34, n = 1944 | 5 | 0.43 | 4.0 | 1.2 (0.4 to 2.9) | 2 | 0.66 | 6.4 | 0.3 (0.04 to 1.1) | 7 | 1.09 | 10.4 | 0.7 (0.3 to 1.4) |
| 35 to 39, n = 721 | 1 | 0.91 | 3.3 | 0.3 (0 to 1.7) | 3 | 0.78 | 2.9 | 1.0 (0.2 to 3.0) | 4 | 1.70 | 6.2 | 0.6 (0.2 to 1.6) |
| 40 to 44, n = 14 | 0 | 2.06 | 0.2 | 0.0 | 0 | 1.00 | 0.1 | 0.00 | 0 | 3.06 | 0.2 | 0.00 |
Significant difference with P < 0.05.
We also compared the number of observed cases of insulin-treated gestational diabetes with the number of cases expected for this population. We found no significant difference between women treated with GH during childhood and the general population (four cases for the 256 deliveries in our cohort, vs the 3.47 expected on the basis of the prevalence of gestational diabetes in deliveries in the general population, not significant).
Discussion
Using a large register of patients treated with GH during childhood and data extracted from SNIIRAM we found no difference in the long-term risk of prevalent treated diabetes (oral drugs or insulin) in subjects treated with GH for idiopathic isolated GH deficiency, idiopathic short stature, or short stature in children born short for gestational age, regardless of sex. The prevalence of insulin-treated diabetes was slightly higher in subjects aged 25 to 29 years inclusive, in both 2009 and 2010. There was no significant difference in the frequency of insulin-treated gestational diabetes between women treated with GH during childhood and the general population. These results are reassuring as they suggest that GH treatment does not increase the risk of diabetes, but further studies are required to confirm their validity.
We found a slightly higher risk of insulin-treated diabetes in patients aged 25 to 29 years in 2010 than in the other age groups. This small, apparently random effect is unlikely to be real. It resulted mostly from the inclusion of four patients already on insulin treatment before the initiation of GH treatment. Indeed, adolescents with poorly controlled type 1 diabetes frequently display growth retardation and delayed puberty, typically with high GH and low IGF-1 levels (19, 20). We have no information about diabetes control in our cohort of patients, but it seems likely that these diabetic children were treated with GH in this context, accounting for the apparently higher prevalence in our study population. No excess risk was found in an analysis excluding these four patients, demonstrating that this effect was not due to GH treatment.
Otherwise, we detected no increase in the risk of diabetes with GH treatment, despite the presence of several potential risk factors in our population. Indeed, diabetes risk is higher in individuals born SGA (21, 22), which was the case for at least 20% of our patients. Moreover, excess GH is known to increase the risk of impaired glucose tolerance and type 2 diabetes in patients with acromegaly. Birth weight is associated with the risk of diabetes (23–25), with an approximate 25% decrease in risk for each additional kilogram at birth, and a 30% to 60% increase in risk for individuals with birth weights below 2500 g. Our population, with a mean birth weight of 3050 g—about 500 g below the mean for the French population, in which at least 10% of individuals had a birth weight below 2500 g—would be expected to have a higher risk of diabetes than the general population. However, our study population had a mean age of 30.1 years and the oldest patient was under the age of 43 years, whereas most of the studies identifying an increase in diabetes risk reported this increase in much older patients. In the US Nurses’ Health Study 2, on 81,732 women with a mean age of 35 years, an increase in risk was identified, with relative risks of 1.67 for birth weights below 2500 g and 1.27 for birth weights between 2500 and 3150 g (25). In France, the prevalence rates of diabetes show a sharp increase after the age of 45 years (26). Furthermore, no excess risk of type 2 diabetes was detected in a study of individuals with a mean age of 29.5 years who had been born SGA, confirming that this risk occurs later in life (27). The size and low mean age of our cohort may account for the lack of detection of an increase in the risk of diabetes due to birth characteristics in this population, but our results suggest, at least, that GH treatment has not amplified the risk at this age.
The effect of GH on insulin sensitivity and diabetes risk is well established (1). The risk of diabetes is markedly increased in patients with acromegaly, with a prevalence of 15% to 37% (5, 6), independently of GH or IGF-1 levels, but with an effect of age and disease duration. The remission of acromegaly leads to an improvement in insulin sensitivity (28). The metabolic effects of GH treatment have mostly been evaluated in children born SGA, who display an increase in insulin secretion and a decrease in insulin sensitivity during treatment (22). Fewer data are available for patients after the completion of GH treatment, but there seems to be a trend toward the normalization of insulin sensitivity and insulin secretion, at both 6 months and 6 years after the cessation of treatment (29, 30). These observations suggest that, in cases in which GH excess leads to diabetes, a remission of diabetes is observed in only a few cases. By contrast, if GH treatment alters only insulin and glucose metabolism parameters, these effects are mostly reversible, consistent with our findings for this study, in which no increase in the risk of diabetes was observed. Our analysis of gestational diabetes suggests that, even in the diabetogenic situation of pregnancy, our population was at no higher risk than the general population. However, caution is required in the interpretation of our results, because this analysis was clearly underpowered.
Studies on large pharmaceutical company-sponsored databases have addressed the risk of diabetes during GH treatment in children, but have been limited by the duration of follow-up and the lack of an appropriate control group. Cutfield et al. (10) reported a six times higher risk of type 2 diabetes in the Kabi International Growth Study database than in published data for highly selected patient populations. However, these findings were limited by the highly heterogeneous nature of the population, and the study did not exclude syndromes associated with a higher risk of diabetes, such as the Turner and Prader–Willi syndromes. In the National Cooperative Growth Study cohort, diabetes cases were recorded, but no comparison with the expected number of type 2 diabetes cases was performed (9). Our study is, thus, the first to compare the prevalence of diabetes in the general population with that in a large and relatively homogeneous group of GH-treated patients with long-term follow-up.
Our study has several limitations. Firstly, the delivery of diabetes drugs, as recorded in the SNIIRAM database, was used to identify cases. Latent cases and cases managed by lifestyle changes were, therefore, not included. In individuals between the ages of 30 and 54 years living in mainland France in 2006, the prevalence of undiagnosed cases was estimated at 30% of the total number of cases of diabetes (31). We, therefore, cannot rule out the possibility that latent diabetes or other preclinical metabolic alterations are more prevalent in our patients than in the general population. Secondly, due to the population coverage of the SNIIRAM database, we were unable to ascertain cases in a substantial proportion (1774/6874, 26%) of our population (26). However, the characteristics of the excluded patients were very similar to those of the patients included. Moreover, we used the SNIIRAM database as a comparator, to eliminate any confounders reflecting differences in insurance affiliation coverage. In addition, the algorithm used to identify cases of diabetes on the basis of drug delivery has been validated by various studies of the SNIIRAM database (32, 33).
In conclusion, we found no increase in the risk of treated diabetes in subjects receiving GH treatment during childhood, with a mean follow-up of 19 years, despite the inclusion of subjects born SGA in the cohort. Further studies are required, on groups at higher risk of diabetes and groups with a longer follow-up. This study demonstrates the value of the long-term follow-up of selected groups of patients through epidemiological studies on medical administrative databases.
Abbreviations:
- CI
confidence interval
- GH
growth hormone
- IGF-1
insulin-like growth factor 1
- SAGhE
Safety and Appropriateness of Growth Hormone Treatments in Europe
- SGA
small for gestational age
- SNIIRAM
Système National d'Information Interrégimes de l'Assurance Maladie (French national health insurance information database)
- SPR
standardized prevalence ratio.
Acknowledgments
We thank Fabienne Landier for data collection and organization of the study, Philippe Ricordeau for assistance with the data from the French national health insurance information database [Système National d’Information Interrégimes de l’Assurance Maladie (SNIIRAM)], and Cécile Billionnet for the reference data for gestational diabetes.
This study was supported by Agence Française de Sécurité Sanitaire des Produits de Santé (the French drug safety agency), Direction Générale de la Santé (French Ministry of Health), Institut National du Cancer, and a Commission of European Communities Grant (HEALTH-F2-2009-223497). The funding sources had no role in study design, data collection, data interpretation, data analysis, or the writing of the report.
Author contributions: J.C., A.W., and J.-C.C. designed the study. E.E. and A.W. oversaw data collection. A.P. and E.E. performed the statistical analysis. A.P. wrote the manuscript. All authors contributed to data interpretation and reviewed the article.
Disclosure Summary: A.P. received a grant for her master’s degree from the French Endocrine Society (Société Française d'Endocrinologie), funded by Lilly, and support for travel to an international meeting from Pfizer, outside the scope of this work. A.W., E.E., and J.C. have no conflicts of interest relevant to this manuscript to disclose. J.-C.C. has the following conflicts of interest to declare, all outside the scope of this work: investigator in clinical trials using GH sponsored by Pfizer and Lilly and in postmarketing studies with several brands of GH, as well as support for travel to international meetings from several GH manufacturers.
References
Giannini C, Mohn A, Chiarelli F. Growth abnormalities in children with type 1 diabetes, juvenile chronic arthritis, and asthma. Int. J. Endocrinol. 2014;2014:265954.
Ricci P, Blotière P-O, Weill A. Diabète traité: quelles évolutions entre 2000 et 2009 en France? 2010. Available at: http://www.invs.sante.fr/beh/2010/42_43/BEH_42_43.pdf. Accessed 27 January 2017.
Author notes
Address all correspondence and requests for reprints to: Jean-Claude Carel, MD, Hôpital Robert Debré, Service d'Endocrinologie Diabétologie Pédiatrique et Centre de Référence des Maladies Endocriniennes Rares de la Croissance, Paris 75019, France. E-mail: [email protected].
