


Abstract
Adipose tissue insulin resistance may cause hepatic and skeletal muscle insulin resistance by releasing excess free fatty acids (FFAs). Because no consensus exists on how to quantify adipose tissue insulin sensitivity we compared three methods for measuring adipose tissue insulin sensitivity: the single step insulin clamp, the multistep pancreatic clamp, and the adipose tissue insulin resistance index (Adipo-IR).
We studied insulin sensitivity in 25 adults by measuring the insulin concentration resulting in 50% suppression of palmitate flux (IC50) using both a multistep pancreatic clamp and a one-step hyperinsulinemic-euglycemic clamp. Palmitate kinetics were measured using a continuous infusion of [U-13C]palmitate. Adipo-IR was calculated from fasting insulin and fasting FFA concentrations.
Adipo-IR was reproducible (sample coefficient of variability, 10.0%) and correlated with the IC50 measured by the multistep pancreatic clamp technique (r, 0.86; P < 0.001). Age and physical fitness were significant predictors of the residual variation between Adipo-IR and IC50, with a positive relationship with age (r, 0.47; P = 0.02) and a negative association with VO2 peak (r, −0.46; P = 0.02). Likewise, IC50 measured by the multistep pancreatic clamp technique correlated with IC50 measured using the one-step hyperinsulinemic-euglycemic clamp technique (r, 0.73; P < 0.001).
Adipo-IR and the one-step hyperinsulinemic-euglycemic clamp technique using a palmitate tracer are good predictors of a gold standard measure of adipose tissue insulin sensitivity. However, age and physical fitness systematically affect the predictive values. Although Adipo-IR is suitable for larger population studies, the multistep pancreatic clamp technique is probably needed for mechanistic studies of adipose tissue insulin action.
Insulin suppresses lipolysis efficiently in lean insulin-sensitive humans, but less so in individuals with obesity and type 2 diabetes (1). This adipose insulin resistance results in excess free fatty acid (FFA) delivery to other tissues, which may contribute to ectopic fat deposition and insulin resistance (lipotoxicity) (2). Therefore, adipose tissue insulin resistance may be an early metabolic defect in development of whole-body insulin resistance and precede insulin resistance in skeletal muscle and liver (3). Identifying robust methods for quantification of adipose tissue insulin sensitivity could help to determine the long-term effects of isolated adipose tissue insulin resistance.
No consensus exists on how to quantify adipose tissue insulin sensitivity (4). However, the multistep pancreatic clamp approach offers the advantage of determining the full dose-response relationship of insulin’s effects on lipolysis (1, 5). By using somatostatin to inhibit endogenous insulin secretion, near zero insulin concentrations can be achieved, which provides a uniform baseline condition from which to calculate the insulin concentration required for a 50% suppression of lipolysis (IC50) (6). However, the complexity and workload involved in performing multistep pancreatic clamp studies limits the number of subjects and therefore makes large-scale studies difficult. Instead, application of more readily available and simpler approaches in larger populations would render determination of the long-term consequences of adipose tissue insulin resistance possible. One potential method is the adipose tissue insulin resistance index (Adipo-IR), which is a measure of adipose tissue insulin resistance that is equivalent to the Homeostatic Model Assessment of Insulin Resistance (HOMA-IR) index for glucose metabolism (7, 8). Adipo-IR is calculated from a single measurement of postabsorptive concentrations of FFAs and insulin (7). The Adipo-IR is associated with hepatic fat content, a marker of ectopic fat deposition (7), and improvements in nonalcoholic steatohepatitis after treatment (9). However, validation and comparison with other measures of adipose tissue insulin sensitivity is lacking.
Another approach is to measure the insulin-mediated suppression of lipolysis before and during a one-step hyperinsulinemic-euglycemic clamp (10). This does not require somatostatin infusion and takes much less time. However, because adipose tissue can be very responsive to insulin, the insulin dose used may be greater than the dose required for a maximal suppression of lipolysis. This would lead to an underestimation of adipose tissue insulin sensitivity. In addition, differences in postabsorptive insulin concentrations between subjects provide different baselines for measuring the insulin-mediated suppression of lipolysis. Until now, no studies have compared estimates of adipose tissue insulin sensitivity obtained with the multistep pancreatic clamp technique vs the one-step hyperinsulinemic-euglycemic clamp technique.
The aim of the current study was to compare different methods for quantifying adipose tissue insulin sensitivity. Our objective was to determine how well the simple and readily accessible Adipo-IR index and the one-step hyperinsulinemic-euglycemic clamp technique performed relative to the multistep pancreatic clamp technique.
Methods
Subjects
This study was approved by the Mayo Clinic Institutional Review Board. Participants were men and premenopausal women with or without type 2 diabetes with a body mass index (BMI) of 20 to 37 kg/m2 who had been weight stable for three or more months. Participants without type 2 diabetes were not taking medications that could affect lipid metabolism. Participants with type 2 diabetes had a hemoglobin A1c of 53 to 78 mmol/mol, and oral hypoglycemic agents and statins were discontinued two weeks prior to the study. Blood glucose concentrations were controlled using subcutaneous injections of rapid acting insulin (Novorapid; Novo Nordisk, Bagsvaerd, Denmark). After signing informed consent, a history was taken and a physical examination was performed, dietary instructions were given, and a blood sample was collected for laboratory screening to exclude chronic medical conditions.
Protocol
Each participant underwent two metabolic studies performed two to three weeks apart. For three days prior to each study day, patients consumed an isocaloric diet (45% carbohydrates, 20% protein, and 35% fat) provided by the Mayo Clinic Research and Trials Unit (CRTU) to ensure consistency of energy intake and nutrient composition. Participants were instructed to taper off caffeine-containing beverages (tea, coffee, and soda) to reduce the likelihood of a caffeine withdrawal headache during the study. The evening prior to the studies, the volunteers were admitted to the CRTU. Volunteers with type 2 diabetes were started on a variable overnight intravenous infusion of insulin to maintain blood glucose concentrations < 8.3 mmol/L. The insulin infusion was discontinued two hours before the start of the study to allow for the complete clearance of the exogenous insulin.
During the first metabolic study (day 1), insulin regulations of lipolysis was measured during a multistep pancreatic clamp procedure with a somatostatin infusion to suppress endogenous insulin secretion. In the morning, volunteers had an intravenous catheter placed in a retrograde fashion in a hand vein for blood sampling and an intravenous catheter placed in a contralateral forearm vein for infusions. A baseline blood sample was collected to measure background palmitate enrichment and to measure FFA and insulin concentrations for calculation of Adipo-IR. At ∼0800 hours (0 minutes), an infusion of somatostatin (60 ng⋅kg−1⋅min−1) and replacement doses of glucagon (0.30 ng⋅kg−1⋅min−1) and growth hormone (0.25 ng⋅kg−1⋅min−1) were initiated and maintained for the duration of study day 1. Insulin regulation of lipolysis was assessed using three sequential, two-hour infusion insulin doses of 0, 0.25, and 1.0 mU⋅kg−1⋅min−1; the 0.25 and 1.0 mU⋅kg−1⋅min−1 doses were given as primed, constant infusions. [U-13C]palmitate (300 nmol/min) was infused beginning one hour before the clamp and during the last hour of each insulin dose to allow measurement of FFA kinetics over the last 30 minutes of each dose. This approach provides three dose-response points and sufficient information to define the insulin concentration for a 50% suppression of lipolysis (IC50) even in very insulin-sensitive subjects (6, 10). A 50% dextrose infusion was given as needed to prevent blood glucose from decreasing to below ∼5.0 mmol/L, with measurement of blood glucose every 10 minutes. Arterialized venous blood samples were collected using the “hot box” approach with a temperature of 131°F, to allow measurement of hormone, tracer, and substrate concentrations during the last 30 minutes of each 120-minute insulin dose interval. At ∼1400 hours (after 360 minutes), infusions were stopped and the participants were provided with lunch.
In the second metabolic study (day 2), insulin-mediated suppression of lipolysis was measured during a one-step hyperinsulinemic-euglycemic clamp with intravenous catheters, blood sampling, and [U-13C]palmitate infusions as on day 1. The participants received a primed, constant infusion of insulin (1 mU⋅kg−1⋅min−1) that was continued for 2 hours, together with 50% dextrose to maintain euglycemia (∼5.0 mmol/L). After the infusions were stopped, the participants consumed lunch and were dismissed from the CRTU.
Body composition
Participants underwent dual energy x-ray absorptiometry and a computed tomography scan of L2–3 interspace to measure fat-free mass, total body fat, and regional fat masses, as previously described (11).
Physical fitness
An exercise bike test was performed to determine peak oxygen consumption (VO2peak). This was expressed per kilogram of fat-free mass (12).
Plasma fatty acid concentrations and enrichment
Individual FFA concentrations of palmitic, oleic, linoleic, linolenic, eicosapentaenoic, docosahexaenoic, palmitoleic, palmiteladic, arachidonic, myristic, elaidic, and stearic acid (added to calculate total FFA) and plasma [U-13C]palmitate enrichment were measured using liquid chromatography/mass spectrometry (13).
Calculations
Steady-state palmitate flux (µmol/min) was calculated by dividing the [U-13C]palmitate infusion rate (µmol/min) by steady-state plasma enrichment (%), as previously described (13). To linearize the relationship between plasma insulin concentrations and palmitate flux, we log transformed both variables, which allowed us to calculate the IC50 (pmol/L) for suppression of lipolysis for each study day (Fig. 1) (10). Adipo-IR (mmol × pmol/L) was calculated for each study day by multiplying the fasting FFA concentration (mmol/L) by the fasting insulin concentration (pmol/L). HOMA-IR was calculated as previously reported (8).
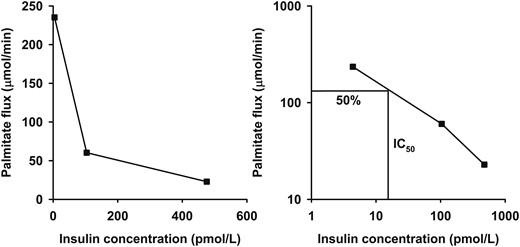
The dose-response relationship between insulin concentration and palmitate flux (left) for a single representative insulin-sensitive subject. The insulin concentration required for a 50% suppression of palmitate flux (IC50) is used as an estimate of adipose tissue insulin sensitivity. This is calculated after linearization of the relationship by logarithmic transformation (right).
Statistics
Data were analyzed using SPSS 21.0 (IBM) and expressed as mean (95% confidence interval) or median [interquartile range (IQR)]. When possible, nonnormally distributed data were logarithmically transformed to ensure normal distribution. Adipo-IR was logarithmically transformed to obtain normally distributed data for calculation of coefficient of variation (CV). For linear regression analyses, residuals were normally distributed and plotted against predicted values to check assumptions. Bland-Altman plots of the z-scores of the estimates were evaluated for Adipo-IR and IC50 to ensure a similar spread across the range of measurements.
Results
Subject characteristics
Twenty-five subjects were included in the study (14 men, 11 women) (Table 1). Subjects with wide ranges in age, adiposity, and physical fitness were included to gain a representative sample. Two participants had type 2 diabetes. All comparisons between the different methods were performed with estimates on separate days to avoid potential dependency between measurements of fasting FFA concentration for Adipo-IR and subsequent measures of insulin-mediated suppression of lipolysis (IC50). On day 1, palmitate flux rates were 204 (IQR, 177 to 234), 36 (IQR, 28 to 47), and 19 (IQR, 17 to 23) µmol/min for zero, low, and high insulin concentrations, respectively. On day 2, palmitate flux rates were 106 (IQR, 95 to 119) and 27 (IQR, 22 to 31) µmol/min for basal and high insulin concentrations. The IC50 calculated from the data obtained on day 2 was much greater than the IC50 calculated from the data obtained on day 1 because fasting insulin concentrations often suppress palmitate flux to less than 50% of what is observed under insulin withdrawal (somatostatin) conditions. Adipo-IR was reproducible with a sample CV of 10.0%.
Subject Characteristics
| Characteristic | Variablea |
|---|---|
| No. of subjects | 25 |
| Sex (male/female) | 14/11 |
| Age, y | 43 (22–55) |
| BMI, kg/m2 | 30.9 (21.2–38.2) |
| FFM, kg | 58.3 (52.7, 63.9) |
| Fat percentage, % | 35.1 (31.6, 38.7) |
| Visceral fat, kg | 4.3 (3.1, 5.6) |
| Upper body subcutaneous fat, kg | 16.5 (13.5, 19.6) |
| Lower body fat, kg | 10.6 (9.1, 12.0) |
| VO2peak, mL/kg FFM/min | 43.5 (40.7, 46.3) |
| REE, kcal/24 h | 1690 (1518, 1861) |
| Triglycerides, mmol/L | 1.0 (0.8, 1.2) |
| Total cholesterol, mmol/L | 4.6 (4.4, 4.7) |
| LDL cholesterol, mmol/L | 2.6 (2.3, 2.8) |
| HDL cholesterol, mmol/L | 1.5 (1.3, 1.7) |
| Glucose, mmol/L | 4.9 (3.5–13.1) |
| Insulin, pmol/L | 37.9 (30.3, 45.6) |
| HOMA-IR | 1.1 (0.8, 1.4) |
| FFA, mmol/L | 0.45 (0.40, 0.52) |
| IC50 (day 1), pmol/L | 7.9 (5.9, 10.7) |
| IC50 (day 2), pmol/L | 113 (90, 142) |
| Adipo-IR (day 1), pmol/L × mmol/L | 15.3 (11.9, 19.6) |
| Adipo-IR (day 2), pmol/L × mmol/L | 16.9 (12.8, 22.2) |
Abbreviation: FFM, fat-free mass.
Data are expressed as mean (95% confidence interval) for normally distributed variables or median (range) for variables that were not normally distributed.
Multistep pancreatic clamp technique [IC50 (day 1)] vs Adipo-IR (day 2)
The IC50 measured by the multistep pancreatic clamp technique was well correlated with the Adipo-IR calculated from data obtained on day 2 (r, 0.86; P < 0.001) (Fig. 2). To test for factors that might account for systematic variations between Adipo-IR and IC50 from day 1, we examined the correlation between the residuals from the relationship between day 2 Adipo-IR and day 1 IC50 and the potential confounding variables of sex, age, BMI, VO2peak, resting energy expenditure (REE), fat percent, and regional fat masses (visceral, upper body subcutaneous, and lower body fat). We found a positive relationship between age (r, 0.47; P = 0.02) and the residuals and a negative association between VO2peak (r, −0.46; P = 0.02) and the residuals. This indicates that Adipo-IR overestimates adipose tissue insulin sensitivity with older age [Fig. 3(a)] and underestimates adipose tissue insulin sensitivity in those with better physical fitness [Fig. 3(b)]. There was no difference between sexes and no association with BMI, REE, fat percent, or regional fat masses. If age and VO2peak were included in a multiple linear regression model along with Adipo-IR, the ability to predict IC50 was improved compared with Adipo-IR by itself (R2, 0.83 vs R2, 0.75).
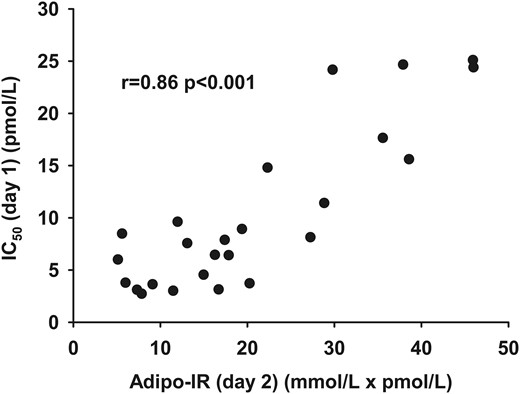
The relationship between Adipo-IR (day 2) (mmol/L × pmol/L) and IC50 (day 1) (pmol/L) as measured by the multistep clamp technique.
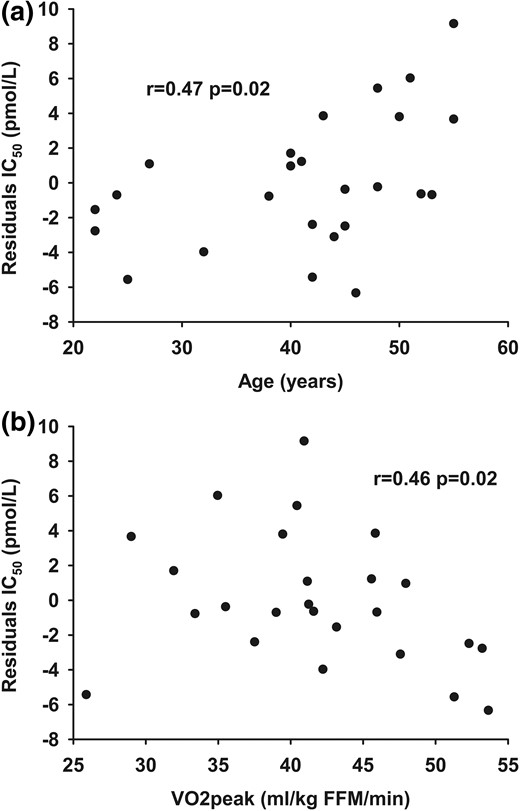
The relationship between (a) age and (b) VO2peak and the residuals from the relationship between Adipo-IR (day 2) (pmol/L × mmol/L) and IC50 (day 1) (pmol/L).
One-step hyperinsulinemic-euglycemic clamp technique [IC50 (day 2)] vs Adipo-IR (day 1)
The IC50 measured using the one-step hyperinsulinemic-euglycemic clamp on day 2 was correlated with Adipo-IR calculated from data obtained on day 1 (r, 0.71; P < 0.001) (Fig. 4). There was no association between the residuals from the relationship and sex, age, BMI, VO2peak, REE, fat percent, and regional fat mass.
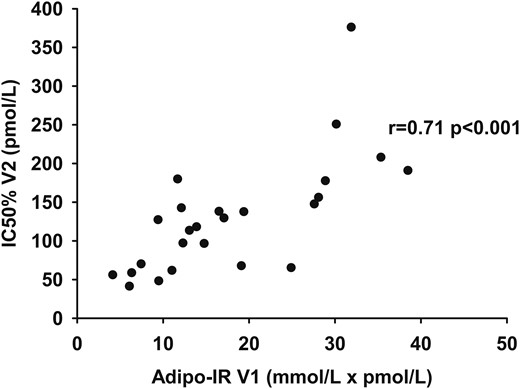
The relationship between Adipo-IR (day 1) (pmol/L × mmol/L) and IC50 (day 2) (pmol/L) as measured by the one-step clamp technique.
Multistep pancreatic vs one-step hyperinsulinemic-euglycemic clamp
The IC50 calculated from the multistep pancreatic clamp performed on day 1 was correlated with the IC50 calculated from the one-step insulin clamp performed on day 2 (r, 0.73; P < 0.001; Fig. 5). A trend was observed between the residual variances between IC50 from day 2 and IC50 from day 1 and age (r, 0.33; P = 0.10). The variables of sex, VO2peak, BMI, REE, fat percent, and regional fat mass were not correlated with the residual differences between the two IC50 values. If age and IC50 from day 2 were included in a multiple linear regression model, the ability to predict the day 1 IC50 was modestly better than using the day 2 IC50 alone (R2, 0.61 vs R2, 0.54).
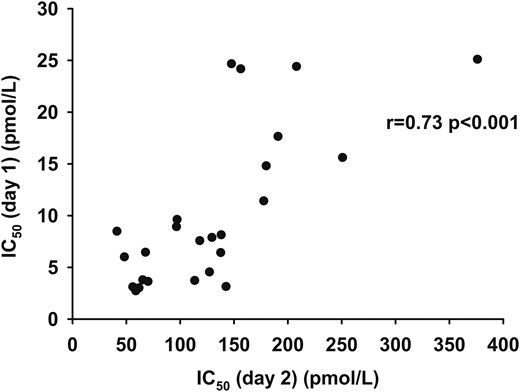
The relationship between IC50 (day 2) (pmol/L) as measured by the one-step clamp technique and IC50 (day 1) (pmol/L) as measured by the multistep clamp technique.
Discussion
In the current study, we compared measures of adipose tissue insulin sensitivity using the multistep pancreatic clamp technique, the single-step insulin clamp technique, and Adipo-IR. Because adipose tissue insulin resistance may cause hepatic and skeletal muscle insulin resistance by excess delivery of FFAs (2, 3), reliable assessment of adipose tissue insulin sensitivity is needed. We found that the Adipo-IR index provided a reproducible and comparable measure of adipose tissue insulin resistance, but that age and physical fitness affect the estimates. In addition, we found a good relationship between adipose tissue insulin sensitivity measured by a one-step hyperinsulinemic-euglycemic and a multistep pancreatic clamp technique.
Insulin inhibits lipolysis quite efficiently, and there is a close, inverse relationship between insulin concentration and palmitate flux for each individual. In obesity and type 2 diabetes, this relationship is shifted upward, with higher rates of lipolysis at any given insulin concentration (5). Therefore, multiplying the fasting insulin concentration by the fasting FFA concentration provides a measure of adipose tissue insulin sensitivity (Adipo-IR) (14). This is related to the HOMA-IR for glucose metabolism (8). However, for glucose, a tightly regulated feedback loop exists wherein glucose is generally maintained within a narrow range (1), whereas no such feedback loop is strongly operative for FFA. Although insulin efficiently suppresses lipolysis (1), circulating FFA can act to amplify glucose-stimulated insulin secretion (15, 16). One might conclude that Adipo-IR is a less robust measure of insulin sensitivity than the HOMA-IR; however, Adipo-IR is elevated in subjects with impaired fasting glucose and impaired glucose tolerance (17) and is associated with an impaired suppression of lipolysis (18). In addition, Adipo-IR is associated with hepatic fat content and with the improvement in histological parameters following treatment of nonalcoholic steatohepatitis (7, 14). Because it was not entirely clear whether Adipo-IR reflects a physiological defect in adipose tissue or is merely a surrogate marker, we compared Adipo-IR to direct measures of adipose tissue insulin action. There was a good correlation between Adipo-IR and insulin sensitivity as determined by a multistep pancreatic clamp technique; however, the association was less robust in insulin-sensitive subjects and, therefore, may limit the use in this population. In addition, Adipo-IR was reproducible with a CV of only 10%. However, this CV may not apply to studies in larger populations without a controlled diet. In the current study, subjects consumed a three-day isoenergetic diet provided by our metabolic kitchen, which reduces variation in FFA concentration and kinetics by ∼50% (6, 19). Whether insulin concentration varies concordantly with FFA concentration, thereby minimizing the impact on Adipo-IR estimates, remains unknown. We suggest that Adipo- IR is a reasonable measure of adipose tissue insulin sensitivity for use in larger populations. It does not appear to be able to substitute for the clamp technique in mechanistic studies of adipose insulin action, especially over more narrow ranges of insulin sensitivity.
In the current study, we found that age and VO2peak accounted for some of the variability in the relationship between Adipo-IR and IC50 from the multistep clamp. A similar trend was observed for age in the relationship between IC50 from the one-step and the multistep clamp. This leads us to suggest that age and/or physical fitness differences between subjects may systematically alter the adipose tissue insulin sensitivity estimates when using these methods. The most likely explanation is the less standardized conditions for measuring Adipo-IR and the single-step clamp IC50, with potential differences in other hormones that affect lipolysis. The differences in estimates of adipose tissue insulin sensitivity could arise from differences in growth hormone (GH) (20) or catecholamines. GH secretion and catecholamine sensitivity decrease with age (21, 22), which could explain lower fasting FFA concentrations for any given insulin concentration in older subjects. Similarly, exercise and physical fitness increase GH secretion and catecholamine responsiveness and therefore explain greater fasting FFA concentration at a certain insulin level in subjects with better physical fitness (23, 24). The impact of GH on lipolysis argues in favor of using the pancreatic clamp technique, in which somatostatins inhibit GH secretion, thereby circumventing the effects of differences in GH secretion and GH-mediated lipolytic action. In addition, somatostatins could also have inhibitory effects on epinephrine secretion (25). In contrast with GH and catecholamines, glucagon is unlikely to explain the effects of age and physical fitness, because glucagon has little effect on lipolysis at physiological concentrations (26).
We also found a good correlation between IC50 estimated by the multistep pancreatic and the one-step hyperinsulinemic-euglycemic clamp technique. Therefore, the one-step hyperinsulinemic-euglycemic clamp is a reasonable alternative to the multistep pancreatic clamp. The one-step hyperinsulinemic-euglycemic clamp is more widely available and reduced the duration of the study. In addition, in studies applying the one-step hyperinsulinemic-euglycemic clamp for other primary outcomes, estimates of adipose tissue insulin sensitivity can be obtained as a secondary outcome. However, the insulin dose applied for the clamp is crucial. The dose-response relationship between insulin concentration and lipolysis is very steep in insulin-sensitive individuals; therefore, the dose applied may be greater than necessary for a maximal suppression of lipolysis outside the linear part of the log-log curve. This would lead to an underestimation of adipose tissue insulin sensitivity, which may also have been the case for some of the subjects in the current study, thereby explaining the less than ideal agreement between IC50 as measured by the multistep and the one-step clamp. This could potentially be overcome by selecting an insulin dose of approximately one-half of that used for our day 2 study. However, this cannot be determined from our current data, because the dose-response relationship is determined from only two data points (basal and clamp), whereas the multistep clamp with three data points would reveal a lack of linearity. We acknowledge that when studying a population with large variations in adipose tissue insulin sensitivity, it may be difficult to obtain useful data for all subjects with only a single insulin dose.
There are limitations to our study. First, although our study covered wide ranges in age, adiposity, physical fitness, and adipose tissue insulin sensitivity, we included only two subjects with type 2 diabetes. This limits our ability to extend our findings to patients with this disease. Second, our subjects consumed a controlled three-day diet before each study day, and our data may not apply to studies that do not include a carefully controlled diet. Third, we studied 27 subjects, but somatostatin failed to suppress insulin secretion sufficiently (<1 pmol/L) to calculate a valid IC50 in two subjects. If our subjects represent a typical population, then ∼5% to 10% of the time, the multistep pancreatic clamp will fail to provide the expected data.
In conclusion, Adipo-IR estimates adipose tissue insulin sensitivity reasonably well compared with a multistep pancreatic clamp with FFA tracers. This supports the use of Adipo-IR for larger population studies. However, Adipo-IR cannot substitute the direct measurements of insulin action in adipose tissue obtained by the clamp techniques, and this direct measurement is preferred for mechanistic studies of insulin action in adipose tissue. In addition, if our findings can be reproduced, we suggest that age and physical fitness might be needed as part of more robust models of adipose tissue insulin sensitivity when using Adipo-IR. Finally, the one-step hyperinsulinemic-euglycemic clamp technique is a reasonable and more convenient alternative to the multistep pancreatic clamp technique in studies with other primary outcomes.
Abbreviations:
- Adipo-IR
adipose tissue insulin resistance index
- BMI
body mass index
- CRTU
Mayo Clinic Research and Trials Unit
- CV
coefficient of variation
- DXA
dichromatic x-ray absorptiometry
- FFA
free fatty acid
- GH
growth hormone
- HOMA-IR
Homeostatic Model Assessment of Insulin Resistance
- IC50
50% suppression of lipolysis
- IQR
interquartile range
- REE
resting energy expenditure
- VO2peak
peak oxygen consumption.
Acknowledgments
We are grateful for the excellent assistance provided by Barbara Norby and Pamela Reich with respect to subject recruitment and performance of the studies. We acknowledge the excellent technical assistance provided by Christy Allred, Debra Harteneck, and Lendia Zhou.
This work was supported by National Center for Research Resources Grant 1UL1RR024150; National Institutes of Health Grants DK45343, DK40484, DK50456; and grants from The Danish Diabetes Academy supported by the Novo Nordisk Foundation, Danish Diabetes Association, Augustinus Foundation, and the Research Council Aarhus University Hospital.
Author contributions: E.S. performed the studies, analyzed the data, and wrote the manuscript. A.E.E.D.Y. and M.M.-B. performed the studies, contributed to the discussion, and reviewed and edited the manuscript. M.D.J. designed and oversaw the study, and reviewed and edited the manuscript.
Disclosure Summary: The authors have nothing to disclose.
References
Hershkop K, Besor O, Santoro N, Pierpont B, Caprio S, Weiss R. Adipose insulin resistance in obese adolescents across the spectrum of glucose tolerance. J Clin Endocrinol Metab 2016;101(6)2423–2431.
Author notes
Address all correspondence and requests for reprints to: Michael D. Jensen, MD, Mayo Clinic, Endocrine Research Unit, 200 1st Street SW, Room 5-194 Joseph, Rochester, Minnesota 55905. E-mail: [email protected].
