


Abstract
Multiple interventions are available to reduce excess body weight in children. We appraised the quality of evidence supporting each intervention and assessed the effectiveness on different obesity-related outcomes.
We conducted a systematic search for systematic reviews of randomized controlled trials evaluating pediatric obesity interventions applied for ≥6 months. We assessed the quality of evidence for each intervention using GRADE (Grading of Recommendation, Assessment, Development, and Evaluation) approach.
From 16 systematic reviews, we identified 133 eligible randomized controlled trials. Physical activity interventions reduced systolic blood pressure and fasting glucose (low to moderate quality of evidence). Dietary interventions with low-carbohydrate diets had a similar effect to low-fat diets in terms of body mass index (BMI) reduction (moderate quality of evidence). Educational interventions reduced waist circumference, BMI, and diastolic blood pressure (low quality of evidence). Pharmacological interventions reduced BMI (metformin, sibutramine, orlistat) and waist circumference (sibutramine, orlistat) and increased high-density lipoprotein cholesterol (sibutramine) but also raised systolic and diastolic blood pressure (sibutramine). Surgical interventions (laparoscopic adjustable gastric banding, Roux-en-Y gastric bypass, sleeve gastrectomy) resulted in the largest BMI reduction (moderate quality of evidence). Combined interventions consisting of dietary modification, physical activity, behavioral therapy, and education significantly reduced systolic and diastolic blood pressure, BMI, and triglycerides. Combined parent–child interventions and parent-only interventions had similar effects on BMI (low quality of evidence).
Several childhood obesity interventions are effective in improving metabolic and anthropometric measures. A comprehensive multicomponent intervention, however, appears to have the best overall outcomes.
Childhood obesity is a serious public health problem, not only in the United States, but also worldwide. According to the Centers for Disease Control and Prevention, the prevalence of obesity in children aged 6 to 11 years has increased substantially from 7% in 1980 to nearly 18% in 2012. Likewise, the prevalence of obesity in adolescents aged 12 to 19 years has increased from 5% to nearly 21% during the same period (1). Strong evidence showed the persistence of childhood obesity into adults. The estimates showed that the risk of adult obesity was ≥2 times greater for obese children than for nonobese children (2).
Childhood obesity is considered as a multisystem disease (3). Several studies have reported many short- and long-term comorbidities associated with childhood obesity, including type 2 diabetes mellitus, hypertension, early puberty, menstrual irregularities and polycystic ovary syndrome, steatohepatitis, sleep apnea, asthma, benign intracranial hypertension, musculoskeletal disorders, and psychological problems. It has also recently been linked to increased cardiovascular mortality in adulthood (4–6).
Interventions to treat obesity can occur at multiple levels. Such interventions include behavioral, pharmacological, and surgical treatments. Evidence-based guidance is needed to help clinicians recommend an intervention that will be effective and consistent with the values and preferences of the patients and their families. The first step in developing such recommendations is to assess the quality of evidence (i.e., certainty in the evidence). The Endocrine Society task force charged with developing guidelines on the management of obesity in children commissioned the present systematic review. The aim of the present review was to appraise and summarize the evidence supporting the various interventions used to treat pediatric obesity.
Methods
We followed a predefined protocol developed by a taskforce from the Endocrine Society to conduct the present systematic review. The reporting of the review followed the standards set in the Preferred Reporting Items for Systematic Reviews and Meta-Analysis statement (7).
Because of the availability of multiple systematic reviews comparing interventions of weight loss for obese children, we used an “umbrella” approach or “a systematic review of systematic reviews” (8, 9). This approach, also termed by the Cochrane Collaboration as an “overview of systematic reviews,” relies on search strategies of well-conducted systematic reviews to identify primary studies that fit specific inclusion criteria. An a priori protocol defines which systematic reviews are chosen, how their credibility is evaluated, and how the quality of the body of evidence is rated.
Eligibility criteria for trials
For randomized controlled trials (RCTs), we sought trials that had enrolled overweight or obese children (>2 years old) and adolescents and evaluated interventions to treat pediatric obesity (medication, surgery, lifestyle interventions, and community-based interventions).; RCTs were eligible if they had compared any of these interventions against usual care or each other and had follow-up data for ≥6 months available.; RCTs published in any language were included.
Eligibility criteria for systematic reviews
The reviews had to have included explicit inclusion and exclusion criteria and to have searched >1 database. Their title or methods had to have explicitly identified the study as a systematic review and not a narrative review, and they were required to be published in English. If multiple systematic reviews were available for 1 intervention and outcome, we first chose the most recent and next the one with the greatest credibility as judged using the A Measurement Tool to Assess Systematic Reviews (AMSTAR) criteria (10, 11). We included ≥1 systematic review per intervention.
Outcomes
We evaluated the change in body mass index (BMI; absolute change, percentage of change, percentile of change, or z-score change) and change in weight (absolute change, percentage of change, or percentile of change). We also evaluated the change in metabolic outcomes, including glycosylated hemoglobin A1c, fasting blood glucose, oral glucose tolerance test, systolic and diastolic blood pressure, lipids panel (total cholesterol, low-density lipoprotein cholesterol, high-density lipoprotein cholesterol, triglycerides), and liver function tests (alanine transaminase, aspartate transaminase, gamma-glutamyl transpeptidase).
Search strategy
A comprehensive search of several databases from each database’s earliest inception to February 12, 2015, was conducted. The databases included Medline In-Process and Other Non-Indexed Citations, MEDLINE, EMBASE, Cochrane Database of Systematic Reviews, and Scopus. The search strategy was designed and conducted by an experienced librarian with input from the study’s principle investigators. Controlled vocabulary supplemented with keywords was used to search for systematic reviews and meta-analyses of interventions for pediatric obesity. The search strategy is detailed in Supplemental Table 1.
Data synthesis and selection of systematic reviews
The search output was uploaded into an online reference management system (DistillerSR; Evidence Partners, Ottawa, ON, Canada) to allow for fast and transparent processing with real-time tracking and evaluation of inter-reviewer agreement and the progress of the reviewers. Two reviewers working independently considered the potential eligibility of each of the abstracts and titles that resulted from executing the search strategy. The reviewers requested the full text versions of all potentially eligible studies. Full text manuscripts of the references on which reviewers disagreed were also retrieved for evaluation. Two reviewers working independently considered the full text reports for eligibility. Subsequently, the disagreements were resolved by consensus, and if not possible, by arbitration by a third reviewer. Agreement was measured using the kappa statistic. The data extracted included the description of the participants, details of the interventions, the effect sizes reported with confidence intervals for the outcomes of interest, and risk of bias indicators.
Assessment of methodological quality of systematic reviews and quality of evidence
We used AMSTAR (10, 11) to assess the credibility of the included systematic reviews (Supplemental Table 2). The AMSTAR tool has 11 items that evaluate whether a systematic review had a protocol, followed appropriate procedures in study selection and analysis, explicitly reported study characteristics and quality, and evaluated publication bias. From these items, a semiquantitative score (0 to 11) or a global judgment can be used to describe credibility (10, 11). We evaluated the quality of evidence using the Grading of Recommendations Assessment, Development, and Evaluation approach (12, 13).
Statistical analysis
For each outcome of interest, we extracted the pooled estimates, if available. If not available, we conducted a random effects meta-analysis to produce them. We extracted the mean differences from all but 2 studies (14, 15), in which the standardized mean differences were reported. The selection of the standardized approach resulted from the different methods used in reporting the outcomes of interest. We used the DerSimonian and Laird method with the heterogeneity estimated from the Mantel-Haenszel model. The I2 statistic was used as a measure of heterogeneity, where I2 >50% indicated high heterogeneity. All analyses were conducted using STATA, version 13 (StataCorp LP, College Station, TX).
Results
Study selection
A total of 1245 citations for systematic reviews were identified by the electronic search strategy, of which 388 were eligible for full text screening. Of the 388, 16 systematic reviews summarizing data from 133; RCTs (30,445 participants) were included in the present analysis. The screening process is presented in Figure 1. Table 1 presents the selected characteristics of the systematic reviews, including the description of the intervention, comparison, and outcomes; length of follow-up; and credibility score.
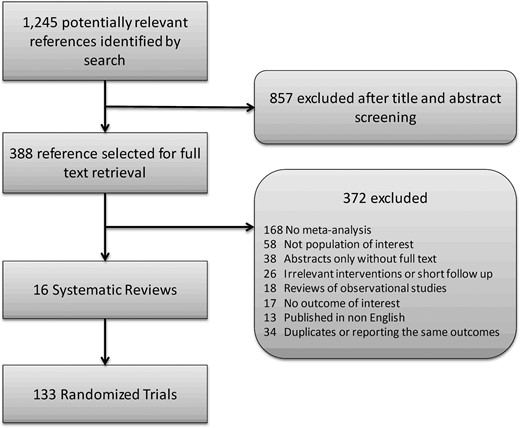
The process of study selection.
Characteristics of Included Systematic Reviews
| Investigator | Participants; RCTsa | Intervention | Comparison | FU (mo) | Outcomes Reported | AMSTAR Scoreb |
|---|---|---|---|---|---|---|
| Physical activity interventions | ||||||
| Cesa, 2014 (27) | 10,748; 11 | Any physical activity program >6 mo, with ≥150 min/wk:; RCTs of after school sports and 3×/wk (1 h each) football training | Less-intensive program or no intervention group | 6–24 | BMI | 10 |
| Kelley, 2014 (26) | 835; 2 | Exercise-only (no diet intervention) lasting ≥4 wk, 60–90 min, 3–4×/wk | Comparative control group (nonintervention, attention control, usual care, placebo) | 2–6 | BMI z score | 10 |
| Garcia-Hermoso, 2013 (16) | 410; 9 | ≥8 wk of physical exercise, principally aerobic exercise, but not as part of multicomponent therapy involving a combination of aerobic and psychological therapy:; RCT included multisport activities | Control group received no type of physical exercise, nutrition, education, or dietary restriction intervention | 2–6 | Systolic BP | 10 |
| Garcia-Hermoso, 2014 (28) | 367; 9 | Aerobic exercise not part of multicomponent therapy involving combination of aerobic exercise plus educational and/or nutritional therapy:; RCTs included multisports and walking activities | Control group received no physical exercise or dietary restriction intervention | 2–9 | Fasting glucose | 10 |
| Dietary interventions | ||||||
| Gow, 2014 (17) | 998; 14 | Diet: dietary interventions of varying macronutrient content to improve weight status; low-carbohydrate diet or increased-protein diet | Standard low-fat diet or standard-protein diet | 1–24 | BMI | 9 |
| Educational interventions | ||||||
| Sbruzzi, 2013 (18) | 724; 8 | Education: delivered in school-based program with aim of addressing overweight and obesity in target population; behavioral strategies to increase physical activity, decrease sedentary behavior, and improve eating habits | No intervention or usual care | 6–72 | Waist circumference, BMI, systolic and diastolic BP | 11 |
| Pharmacological interventions | ||||||
| Czernichow, 2010 (19) | 1391; 8 | Sibutramine vs placebo: dosing started at 5 mg, increased ≤15 mg plus comprehensive family-based behavioral weight loss program or dietary counseling/behavioral therapy Orlistat vs placebo: 120 mg TID with lifestyle changes, including mildly hypocaloric diet, meeting with dietician monthly, exercise, and behavioral therapy | Placebo plus same lifestyle modifications | 5–12 | Weight, BMI, waist circumference, HDL, LDL, total Cholesterol, triglycerides, systolic and diastolic BP, insulin level | 10 |
| McGovern, 2008 (15) | 1745; 3 | Orlistat vs placebo: 120 mg TID plus lifestyle modification program | Placebo plus same lifestyle modifications | 6–12 | BMI | 9 |
| McDonagh, 2014 (20) | 773; 10 | Metformin: dosing range, 1000–2000 mg divided into twice daily doses or once daily for extended-release formulation | Placebo | 2-24 | BMI, total cholesterol | 9 |
| Onakpoya, 2012 (21) | 183; 7 | Conjugated linoleic acid: dosing range, 2400–6000 mg/d | Placebo | 6–12 | Weight, BMI, body fat | 10 |
| Surgical interventions | ||||||
| Black, 2013 (22) | 636; 1 | Bariatric surgery: laparoscopic adjustable gastric banding, sleeve gastrectomy, Roux-en-Y gastric bypass, biliopancreatic diversion | Lifestyle interventions | 6–120 | BMI | 8 |
| Combined interventions | ||||||
| Friedrich, 2012 (14) | 9097; 19 | Exercise plus education: interventions using nutritional education or physical activity, or both, for minimal duration of 3 mo | Control | 3–72 | BMI | 10 |
| Ho, 2012 (24) | 683; 5 | Combined diet, physical activity, education, behavioral therapy: Traffic Light or modified Traffic Light diet or hypocaloric diet or calorie restriction approach plus supervised physical activity sessions or exercise training, with total duration of 20 min/mo to 6 h/wk | Control/ no treatment | 2–120 | BMI, systolic and diastolic BP, HDL, LDL, triglycerides, fasting glucose | 9 |
| Ho, 2013 (23) | 574; 12 | Compared effectiveness of dietary intervention programs and diet plus exercise or exercise-only intervention:; RCTs included 120–270 min/wk physical activity, aerobic exercise and resistance training for 6–24 weeks plus diet intervention | Diet only: hypocaloric diet (900–1200 kcal/d) with regular individual or group face-to-face visits with dietitian or nutritionist | 2–24 | BMI, body fat, triglycerides, LDL, HDL, fasting glucose, and insulin level | 9 |
| Jull, 2013 (25) | 266; 4 | Family based (parent–child): weekly, biweekly, monthly sessions of 40–120 min, aimed at dietary modification (healthy eating, reduced exposure to obesogenic foods, designated meal times, ≥1 family meal/d, allocated individual portions), increased physical activity, decreased sedentary activity, behavioral change skills, parenting skills; dietary change addressed via Traffic Light diet; behavioral change skills included self-monitoring, positive reinforcement, stimulus control, preplanning, and modeling; treatment model and etiology of obesity also addressed | Parent only: similar sessions but with parents only attending | 4–11 | BMI | 10 |
| van Hoek, 2014 (29) | 1015; 11 | Combined diet, physical activity, education, behavioral therapy | Control | 3–60 | BMI | 8 |
Abbreviations: BP, blood pressure; FU, follow-up; HDL, high-density lipoprotein; LDL, low-density lipoprotein; TID, 3 times daily.
The number of patients and trials refer to those included in the whole review.
The details of the AMSTAR tool components are described in Supplemental Table 2.
Overall, the systematic reviews had good credibility, with a mean AMSTAR score of 9.5 ± 0.8. Of the 16 systematic reviews, 15 followed an a priori plan and adequately assessed heterogeneity, and 14 performed a comprehensive literature search, publication bias assessment, and included trials, regardless of their publication status. Only 13 indicated duplicate study selection and data extraction and listed the included and excluded studies. All 16 systematic reviews listed the clinical characteristics of the individual trials and all reported authors’ conflicts of interest (Supplemental Table 2).
Effect of interventions and quality of evidence
The main results are summarized in Table 2, listing each category of interventions with the pooled effect size of each outcome of interest, its baseline value, and the quality of evidence.
Effect of Interventions and Quality of Evidence for Reported Outcomes
| Meta-Analysis Investigator: Study Design (Individual Study Citation) | Outcome | Participants (RCTs)a | Effect Size (95% CI) | Quality of Evidence |
|---|---|---|---|---|
| Physical activity interventions | ||||
| Exercise (multisport and aerobic) vs control | ||||
| Kelley, 2014 (26); RCTs: Meyer, 2006 (30); Weintraub, 2008 (31) | BMI z-score (2.4 ± 0.2) | 88 (2) | −0.17 (−0.38 to 0.03) | 1,2,4, Very low |
| Cesa, 2014 (27); RCTs: Weintraub, 2008 (31) Faude, 2006 (32) | BMI (27.1 ± 1.1 kg/m2) | 43 (2) | −0.43 (−3.48 to 2.63) | 1,4, Low |
| Garcia-Hermoso, 2013 (16); RCT: Meyer, 2006 (30) | Systolic BP (129 ± 4 mm Hg) | 67 (1) | −0.77 (−1.26 to −0.27)b | 1, Moderate |
| Garcia-Hermoso, 2014 (28); RCT: Carrel, 2005 (33) | Fasting glucose (84.4 ± 1.5 mg/dL) | 50 (1) | −0.99 (−1.5 to −0.35)b | 1,3, Low |
| Dietary interventions | ||||
| Diet (low-carbohydrate diet) vs standard low-fat diet | ||||
| Gow 2014 (17); RCTs: Demol, 2009 (34); Figueroa-Colon, 1993 (35) | BMI (34.1 ± 0.8 kg/m2) | 66 (2) | 0.57 (−1.44 to 2.58) | 4, Moderate |
| Gow, 2014 (17); RCTs: Mirza, 2013 (36); Rolland-Cachera, 2004 (37) | BMI z-score (3.24 ± 1) | 180 (2) | −0.06 (−0.15 to 0.02) | 4, Moderate |
| Educational interventions | ||||
| Sbruzzi, 2013 (18); RCTs: Croker, 2012; Kalarchian, 2009; Sacher, 2010 (38–40) | Waist circumference (79.7 ± 8cm) | 380 (3) | −3.21 (−6.34 to −0.07)b | 1,2, Low |
| Sbruzzi, 2013 (18); RCTs: Croker, 2012; Kalarchian, 2009; Sacher, 2010; Kalavainen, 2007; Waling, 2010 (38–42) | BMI (27.9 ± 3.8 kg/m2) | 507 (5) | −0.86 (−1.59 to −0.14)b | 1,2, Low |
| Sbruzzi, 2013 (18); RCTs: Croker, 2012; Sacher, 2010; Kalavainen, 2007; Estabrooks, 2009; Golley, 2007; Wafa, 2011 (38, 40, 41, 43–45) | BMI z-score (2.6 ± 0.4) | 546 (6) | −0.06 (−0.16 to 0.03) | 1,4, Low |
| Sbruzzi, 2013 (18); RCTs: Kalarchian, 2009; Sacher, 2010 (38, 40) | Systolic BP (115.3 ± 4.2 mm Hg) | 308 (2) | −3.74 (−8.04 to 0.56) | 1,2,4, Very low |
| Diastolic BP (68.3 ± 1.4 mm Hg) | 308 (2) | −3.68 (−5.48 to −1.88)b | 1, Moderate | |
| Pharmacological interventions | ||||
| Metformin vs placebo | ||||
| McDonagh, 2014 (20); RCTs: Atabek, 2008; Clarson, 2009; Freemark, 2001; Love-Osborne, 2008; Mauras, 2009; Srinivasan, 2006; Wiegand, 2010; Yanovski, 2011; Lavine, 2011; Wilson, 2010 (46–55) | BMI (33.4 ± 3.5 kg/m2) | 773 (10) | −1.27 (−1.73 to −0.80)b | 1,5, Low |
| McDonagh, 2014 (20); RCTs: Atabek, 2008; Freemark, 2001; Wiegand, 2010; Yanovski, 2011; Lavine, 2011 (46, 48, 52–54) | Total cholesterol (167.5 ± 9.5 mg/dL) | 492 (5) | −2.42 (−7.30 to 2.47) | 1,3,4, Very low |
| Sibutramine vs placebo | ||||
| Czernichow, 2010 (19); RCTs: Budd, 2007; Garcia-Morales, 2006; Godoy-Matos, 2005; Daniels, 2007 (56–59) | BMI ( 36.3 ± 0.7 kg/m2) | 688 (4) | −2.28 (−2.81 to −1.76)b | High |
| Czernichow, 2010 (19); RCTs: Budd, 2007; Garcia-Morales, 2006; Godoy-Matos, 2005; Berkowitz, 2003 (56–58, 60) | Weight (101.7 ± 4.9 kg) | 688 (4) | −5.32 (−7.18 to −3.46)b | High |
| Czernichow, 2010 (19); RCTs: Budd, 2007; Garcia-Morales, 2006; Godoy-Matos, 2005; Berkowitz, 2003; Berkowitz, 2006 (56–58, 60, 61) | Waist circumference (106.7 ± 3.2 cm) | 770 (5) | −5.67 (−6.78 to −4.56)b | High |
| Czernichow, 2010 (19) | HDL ( 1.1 ± 0.1 mmol/L) | NR (3) | 0.07 (0.03 to 0.11)b | 3, Moderate |
| LDL (2.7 ± 0.8 mmol/L) | NR (2) | 0.04 (−0.25 to 0.33) | 2,3,4, Very low | |
| Total cholesterol (4.4 ± 0.5 mmol/L) | NR (2) | 0.02 (−0.21 to 0.25) | 3,4, Low | |
| Triglycerides (1.2 ± 0.4 mmol/L) | NR (3) | −0.48 (−1.10 to 0.15) | 2,3,4, Very low | |
| Systolic BP (113.6 ± 1.1 mm Hg) | NR (3) | 1.04 (0.14 to 1.94)b | 3, Moderate | |
| Diastolic BP (68.3 ± 5 mm Hg) | NR (3) | 1.69 (0.96 to 2.43)b | 3, Moderate | |
| Insulin ( 20.5 ± 7.5 mU/mL) | NR (3) | −3.61 (−9.45 to 2.23) | 2,3,4, Very low | |
| Orlistat vs placebo | ||||
| McGovern, 2008 (15); Czernichow, 2010 (19); RCTs: Maahs, 2006; Ozkan, 2004; Chanoine, 2005 (62–64) | BMI (35.6 ± 1.6 kg/m2) | 592 (3) | −1.67 (−3.52 to −0.18)b | 4, Moderate |
| Czernichow, 2010 (19); RCTs: Ozkan, 2004; Chanoine, 2005 (63, 64) | Weight ( 95.5 ± 5 kg) | 581 (2) | −6.16 (−14.0 to 1.65) | 2,4, Low |
| Czernichow, 2010 (19); RCT: Chanoine, 2005 (64) | Waist circumference (105.7 ± 0.9 cm) | 539 (1) | −1.8 (−3.1 to −0.4)b | High |
| Conjugated linoleic acid vs placebo | ||||
| Onakpoya, 2012 (21); RCT: Racine, 2010 (65) | Weight (43.0 ± 2.6 kg) | 53 (1) | −0.5 (−1.64 to 0.64) | 1,4, Low |
| BMI (22.6 ± 0.5 kg/m2) | 53 (1) | −0.6 (−1.12 to −0.08)b | 1,4, Low | |
| Body fat ( 31.1 ± 0.8) | 53 (1) | −1.00 (−1.73 to −0.27)b | 1,3,4, Very low | |
| Surgical intervention | ||||
| Laparoscopic adjustable gastric banding vs control | ||||
| Black, 2013 (22); RCT: O'Brien, 2010 (66) | BMI (41.3 ± 1kg/m2) | 24 (1) | −12.7 (−16.32 to −9.08)b | 4, Moderate |
| Combined interventions | ||||
| Exercise and diet vs diet only | ||||
| Ho, 2013 (23); RCTs: Shalitin, 2009; Okely, 2010 (67, 68) | Fasting blood glucose (4.3 ± 0.2 mmol/L) | 212 (2) | 0.01 (–0.11 to 0.14) | 1,2,3,4, Very low |
| Ho, 2013 (23); RCTs: Shalitin, 2009; Okely, 2010; Woo, 2004 (67–69) | BMI ( 25.1 ± 0.7 kg/m2) | 275 (3) | 0.11 (–0.4 to 0.62) | 1,4, Low |
| Body fat (40.3% ± 3.9%) | 173 (2) | −2.73 (−4.38 to −1.09)b | 1,3,4, Very low | |
| Triglycerides (2.7 ± 1.9 mmol/L) | 275 (3) | 0.05 (−0.06 to 0.16) | 1,3,4, Very low | |
| LDL ((3.07 ± 1.5 mmol/L) | 275 (3) | 0.14 (0.03 to 0.24)b | 1,3, Low | |
| Fasting insulin (97.1 ± 6.2 pmol/L) | 212 (2) | −7.5 (–7.36 to 22.37) | 1,3,4, Very low | |
| HDL (1.9 ± 0.7 mmol/L) | 275 (3) | 0.17 (−0.07 to 0.41) | 1,4, Low | |
| Exercise and education vs control | ||||
| Friedrich, 2012 (14); RCTs: Caballero, 2003; Kafatos, 2005; Haerens, 2006; Singh, 2007; Jiang, 2007; Johnston, 2007; Gentile, 2009; Foster, 2008; Peralta, 2009; Johnston, 2010; Singhal, 2010 (70–80) | BMI (19.5 ± 1.2 kg/m2) | 9379 (11) | −0.32 (−0.64 to −0.001)b | 1,2,5, Very low |
| Combined diet, physical activity, education and behavioral therapy vs control | ||||
| Van Hoek, 2014 (29); RCTs: O'Connor, 2013; Raynor, 2012; Stark, 2011; Taveras, 2011 (81–84) | BMI z-score ((1.96 ± 0.2) | 565 (4) | −0.105 (−0.193 to −0.018)b | 1,2, Low |
| Ho, 2012 (24); RCTs: Carrel, 2005; Kalarchian, 2009; Sacher, 2010; Kalavainen, 2007; Reinehr, 2010; Wake, 2009; McCallum, 2007; Jiang, 2005; Saelens, 2002 (33, 39–41, 85–89) | BMI (21.1 ± 5kg/m2) | 1021 (9) | −1.1 (−1.86 to −0.35)b | 1,2, Low |
| Ho, 2012 (24); RCTs: Kalarchian, 2009; Johnston, 2007; Reinehr, 2010; Jiang, 2005; Savoye, 2007 (39, 75, 85, 88, 90) | Systolic BP (115.8 ± 4.8 mm Hg) | 618 (5) | −3.64 (−5.74 to −1.55)b | 1,2, Low |
| Diastolic BP (67.6 ± 3.9 mm Hg) | 618 (5) | −2.11 (−3.68 to −0.54) | 1,2, Low | |
| Ho, 2012 (24); RCTs: Johnston, 2007; Jiang, 2005; Savoye, 2007 (75, 88, 90) | Triglycerides (2.24 ± 0.8 mmol/L) | 355 (3) | −0.09 (−0.11 to −0.07)b | 1,3, Low |
| Ho, 2012 (24); RCTs: Johnston, 2007; Savoye, 2007 (75, 90) | HDL (1.2 ± 0.02 mmol/L) | 280 (2) | 0.03 (−0.03 to 0.09) | 1,3,4, Very low |
| LDL (2.3 ± 0.14 mmol/L) | 280 (2) | −0.19 (−0.39 to 0.01) | 1,3,4, Very low | |
| Fasting glucose (2.3 ± 0.1 mmol/L) | 212 (2) | −0.06 (−0.2 to 0.08) | 1,3,4, Very low | |
| Family-based (parent–child) vs parent only | ||||
| Jull, 2013 [25]; RCTs: Boutelle, 2011; Janicke, 2009 [91, 92] | BMI z-score (2.2 ± 0.1) | 102 (2) | 0 (–0.10 to 0.09) | 1,4, Low |
Abbreviations: 1, risk of bias (determined by trials’ randomization, allocation concealment, and loss to follow-up); 2, inconsistency [determined from statistical measures of heterogeneity (I2 >50%)]; 3, indirectness (determined by how similar a study population and intervention were compared with current practice); 4, imprecision (quality of evidence rated down owing to imprecision if CIs of estimates of effect included appreciable benefits and harms); 5, Publication bias (determined present if statistical tests such as Egger’s regression suggested small study effect); BP, blood pressure; CI, confidence interval; HDL, high-density lipoprotein; LDL, low-density protein; NR, not reported.
The number of patients and trials refer to those included in each outcome and were often different from those included in the entire systematic review.
Statistically significant.
Physical activity interventions
Multisport and aerobic exercise interventions reduced systolic blood pressure (moderate quality evidence) and fasting glucose (low quality of evidence) (16).
Dietary interventions
A comparison of a low-carbohydrate diet with a standard low-fat diet yielded no statistically significant differences in terms of BMI or BMI z-score reduction (moderate quality of evidence) (17).
Education-based interventions
Education-based interventions (compared with usual care) significantly lowered diastolic blood pressure (moderate quality evidence), BMI (low quality evidence), and waist circumference (low quality evidence) but did not substantially reduce systolic blood pressure (very low quality evidence) (18).
Pharmacological interventions
Sibutramine significantly increased systolic and diastolic blood pressure (low quality evidence) (19). Sibutramine and orlistat, compared with placebo, significantly reduced BMI (high and moderate quality evidence, respectively) and waist circumference (high quality evidence) (19). Metformin and conjugated linoleic acid significantly reduced BMI (low quality evidence) (20, 21). Sibutramine use was associated with a modest increase in high-density lipoprotein (moderate quality evidence) but did not substantially reduce low-density lipoprotein (low quality evidence) or triglycerides (very low quality evidence) (19).
Surgical interventions
The average BMI difference after surgical interventions from baseline to 1 year was −13.5 kg/m2 (95% confidence interval, −15.1 to −11.9). The BMI loss was greater after Roux-en-Y gastric bypass compared with laparoscopic adjustable gastric banding (22). Laparoscopic adjustable gastric banding resulted in BMI reduction compared with lifestyle interventions in 1 RCT (−12.7 kg/m2; 95% confidence interval, −16.32 to −9.08) (moderate quality of evidence) (66).
Combined approaches
A combined approach of education and physical activity significantly reduced the BMI (low quality evidence) (14). A comparison of dietary modifications and exercise to dieting alone did not yield a statistically significant difference in BMI (low quality of evidence), high-density lipoprotein cholesterol, or triglycerides, although it reduced the body fat percentage (low quality of evidence) (23). A combined approach of dietary modification, physical activity, behavioral therapy, and education substantially reduced systolic and diastolic blood pressure, BMI, and triglycerides but not low-density lipoprotein cholesterol (low quality evidence) (24). Finally, family-based interventions, including both the parent and the child, compared with parent-only interventions, did not yield substantial differences in BMI (low quality evidence) (25).
Discussion
The purpose of the present systematic review was to evaluate the quality of the supporting evidence for the various available interventions for pediatric obesity. The quality of evidence (also called confidence in the estimates of effect and certainty in evidence) is an essential component for decision making. Guideline developers and clinicians engaged in shared decision making need to know the confidence that the available evidence warrants. They also need to convey such confidence to patients and incorporate other factors such as patient values and preferences, costs, resources, availability, and feasibility of the intervention and the clinical context in choosing a weight loss strategy (93).
We found that comprehensive nonsurgical interventions combining diet, physical activity, education, and behavioral therapy were associated with relevant improvement in terms of weight reduction and metabolic outcomes, including important improvements in systolic and diastolic blood pressure and triglycerides. Many comprehensive lifestyle pediatric weight management programs improved both body composition and metabolic parameters (94, 95). These findings are in line with evidence from previous meta-analyses suggesting that intensive lifestyle modification programs can be effective tools for pediatric weight control in both the short and long term (96, 97). Evidence also suggests that the longer duration and intensity of such interventions and older child age were all related to better weight loss outcomes (98).
Interventions involving exercise alone (without calorie restriction or education) resulted in improvements in blood pressure but did not cause weight loss. Only when exercise was combined with diet or education were important reductions in body weight measures noted. Current recommendations state that school children and adolescents should receive a minimum of 30 to 60 minutes of moderately vigorous physical activity and ≥60 minutes of aerobic physical activity each school day (99). Additionally, exercise periods as short as 20 minutes 5 times weekly appear to have substantial positive outcomes, especially a decline in insulin resistance and increased overall fitness (100).
The type of diet did not seem to differ substantially in terms of weight loss (low-carbohydrate versus standard low-fat diet), confirming recent findings from a meta-analysis of children and adolescents suggesting that improved weight loss can be achieved regardless of the macronutrient composition of the diet and mirroring similar results found in adults (17).
Several pharmacological interventions have been used to treat pediatric obesity, including off-label use of metformin, sibutramine (now unavailable in the US market), over-the-counter product conjugated linoleic acid, and Food and Drug Administration–approved orlistat for weight loss in overweight and obese children. Although all resulted in a substantial reduction in BMI, important limitations were observed. Sibutramine resulted in a relevant increase in both systolic and diastolic pressure and was withdrawn from the US market because of an increased risk of serious cardiovascular events. Evidence supporting weight loss from conjugated linoleic acid was derived from a single study with 53 participants (65). In addition, metformin appears to have similar minimal weight loss effects as in adults and should only be used in children aged ≥10 years. Orlistat remains the only Food and Drug Administration–approved drug for treatment of childhood obesity for those aged ≥12 years.
We also found that surgical interventions resulted in the largest reduction in body weight. However, this evidence was essentially derived from a single trial of laparoscopic adjustable gastric banding and included a small number of participants (<30), with multiple crossovers (66). Most importantly, laparoscopic adjustable gastric banding has had high reoperation and long-term complication rates, which increase with time and, thus, is rarely used anymore (101, 102). Roux-en-Y gastric bypass has been used in obese children and adolescents and was associated with a large BMI reduction in nonrandomized studies (22). Sleeve gastrectomy has been also used in children in a nonrandomized study and demonstrated weight loss in >90% of pediatric patients, with ≥70% comorbidity resolution during ≤24 months of follow-up (103). Evidence on surgical complications was not well reported and warrants low certainty. The complications that have been reported varied by the surgical technique and included pouch dilation, port leakage and slippage requiring remedial operations, nutritional deficiencies, hernias, wound infections, small bowel obstructions, cholelithiasis, and ulcers (22). Evidence on the resolution of medical comorbidities after surgery was also sparse. In general, surgical interventions to treat pediatric obesity have been mainly restricted to advanced cases with multiple comorbidities and refractory to nonsurgical interventions.
Finally, we found no statistically significant change in the BMI z-score when comparing family-based interventions with parent-only interventions. A 2008 meta-analysis of randomized pediatric trials of combined lifestyle interventions for treating obesity, however, showed a modest but relevant decrease in BMI when interventions involved the family. When the parents were not specifically included, the effect on weight loss was not substantial (15). An evidence-based review of pharmacological interventions for pediatric obesity also highlighted the importance of concomitant intensive lifestyle interventions, dietary, exercise, and family counseling for best weight loss outcomes (104). Thus, having the family of an obese child involved in the various weight loss interventions appears to be essential.
The limitations of the present systematic review relate to the nature of behavioral, exercise, and dietary interventions. These interventions are usually tested in open, unblinded trials, are complex, and have multiple components, making them difficult to study and replicate in real world settings. Replicating multicomponent and multidisciplinary interventions tested in trials in daily practice can be challenging and requires substantial resources and expertise. Finally, umbrella reviews (overview of reviews) are limited by the quality of the original systematic reviews. The strengths of the present evidence synthesis attempt relate to the a priori protocol that was developed in collaboration with the Endocrine Society experts and the duplicate process of study selection and appraisal.
Conclusion
Several childhood obesity interventions are effective in improving metabolic and anthropometric measures. A comprehensive multicomponent intervention, however, appears to have the best overall outcomes.
Abbreviations:
- AMSTAR
A Measurement Tool to Assess Systematic Reviews
- BMI
body mass index
- CI
confidence interval
- RCT
randomized controlled trial
Acknowledgments
This study was partially funded by the Endocrine Society.
Disclosure Summary: The authors have nothing to disclose.
References
Office of Disease Prevention and Health Promotion. 2008 Physical Activity Guidelines for Americans Summary. Available at: https://health.gov/paguidelines/guidelines/summary.aspx. Accessed 25 March 2016.
Author notes
Address all correspondence and requests for reprints to: Mohammad Hassan Murad, MD, MPH, Division of Preventive, Occupational and Aerospace Medicine, Mayo Clinic, 200 First Street SW, Rochester, Minnesota 55905. E-mail: [email protected].
