


Abstract
The decreased expansion capacity of adipose tissue plays a crucial role in the onset of disorders associated with metabolic syndrome.
The aim of this study was to examine the state of adipose tissue-derived mesenchymal stem cells (ASCs) from obese subjects with different metabolic profiles.
This was a 2-year study to enroll subjects who underwent bariatric surgery or cholecystectomy.
University Hospital.
Patients who underwent either bariatric surgery (20 morbidly obese) or cholecystectomy (40 subjects) participated in the study.
ASCs were obtained from both visceral and subcutaneous adipose tissue. Adipogenic, fibrotic gene expression was quantified by quantitative polymerase chain reaction; Smad7 and fibroblast growth factor 2 were quantified by western blotting and enzyme-linked immunosorbent assay, respectively. The susceptibility of ASCs to apoptosis, their population doubling time, and their clonogenic potential were evaluated.
The worsening metabolic profile of the patients was accompanied by a decrease in the intrinsic levels of adipogenic gene expression, reduced proliferation rate, clonogenic potential, and exportation of fibroblast growth factor 2 to the cell surface of the ASCs derived from both tissues. In addition, the ASCs from patients without metabolic syndrome showed differences in susceptibility to apoptosis and expression of TGFβ-signaling inhibitory protein Smad7 with respect to the ASCs from patients with metabolic syndrome.
Our results suggest that the decrease in adipogenic-gene mRNA and clonogenic potential, as well as the accumulation of fibrotic proteins with metabolic alterations, could be a relevant mechanism controlling the number and size of neogenerated adipocytes and involved in alteration of adipose-tissue expansion.
It has been suggested that the expansion capacity of the fat depots is not the same for all subjects and, once the storage capacity limit is exceeded, lipids are accumulated ectopically in other organs, inducing the secretion of proinflammatory factors, leading to metabolic syndrome (1). Alternatively, it has also been proposed that the preservation of the architecture and functionality of adipose tissue could contribute to some obese individuals remaining metabolically healthy and not developing any cardiovascular disorders commonly associated with obesity (2). In either case, adipose tissue-derived mesenchymal stem cells (ASCs) could be involved in the dysfunction of adipose tissue associated with obesity, because they not only ensure the long-term renewal of adipocytes but also the availability of new adipocytes during the expansion of adipose tissue through hyperplasia.
In fact, in vitro studies have confirmed the decrease in the adipogenic differentiation ability of the ASCs from obese subjects (3–7). This intrinsic, impaired adipogenic differentiation ability in obesity seems to be accompanied by a reduced ability to differentiate into other mesenchymal lineages (6, 8–10), and through premature cell-senescence signals (6, 11) and the exhaustion of proangiogenic ASCs (12).
Considering that the expansion of adipose tissue also depends on the state of the ASCs, it is likely that ASC impairment could contribute to a decrease in adipose-tissue expandability and that ASC functionality may differ between subjects with different metabolic profiles. For this reason, the aims of this study were to assess the adipogenic-gene expression levels in vitro of differentiated adipocytes from ASCs from subjects with different metabolic profiles; to measure the expression levels of some of the proteins involved in adipose-tissue fibrosis in ASCs; and to describe the susceptibility to apoptosis, the proliferative and clonogenic potential, and the surface retention of fibroblast growth factor 2 (FGF2) in the ASCs.
Materials and Methods
Patients
Paired visceral and subcutaneous adipose-tissue biopsy specimens (greater omental and from the abdominal region, respectively) were obtained from 60 subjects who underwent bariatric surgery (n = 20 morbidly obese patients) or cholecystectomy (n = 40 subjects) at the Virgen de la Victoria Clinical Hospital and the Civil Hospital (Málaga, Spain) during the period 2013 to 2014. The hospital ethics committee approved the study and informed consent was obtained from the participants. All the subjects were younger than 58 years. None had infectious disease, type 2 diabetes, or were receiving drug treatment for type 2 diabetes. Participants were classified according to their body mass index (BMI) as healthy normoweight subjects (Nw; BMI <25 kg/m2) or, in subjects with BMI ≥25 kg/m2, as either without or with metabolic syndrome (non-MS and MS, respectively), according to the International Diabetes Federation criteria. Because of the limited availability of tissue, we were unable to conduct the experiments on all biopsy specimens provided by all the subjects recruited. The number of experiments with cells from different donors is specified in the respective assays.
Isolation and expansion of the stromal vascular fraction derived from visceral and subcutaneous adipose tissue
Paired samples of subcutaneous and visceral adipose tissue were minced and stirred for 70 minutes in a water bath at 37°C in a type I collagenase enzyme solution (0.150% in phosphate-buffered saline [PBS] plus 1.0% bovine serum albumin [BSA]). The resulting tissue suspension was centrifuged, the floating adipocytes were separated by decantation, and the stromal vascular fraction (SVF) was filtered, centrifuged, and resuspended in erythrocyte lysis buffer for 10 minutes at room temperature. After washing, the SVF was resuspended and incubated for approximately 16 hours in growth medium consisting of Dulbecco’s modified Eagle medium/F-12 supplemented with fetal bovine serum (FBS; 0.1 mL/mL), streptomycin (100 μg/mL), penicillin (100 U/mL), and l-glutamine (2 mM). The number of cells needed to perform the different assays was reached by cell subculturing up to passage 2 or 3 under standard culture conditions at 37°C in a humidified atmosphere with 5% carbon dioxide gas.
Immunophenotypic characterization by flow cytometry
Immunophenotypic characterization of the visceral ASCs (visASCs) and subcutaneous ASCs (subASCs) in passage 3 was performed using flow cytometry based on cell surface markers CD73-phycoerythrin (BD Biosciences, San Jose, CA) and CD105-allophycocyanin (Miltenyi Biotec, Bergisch Gladbach, Germany). The ASCs were detached with trypsin/EDTA (pH 7.0 to 7.6), washed with PBS, resuspended in blocking buffer (PBS supplemented with 3.0% BSA), and incubated for 10 minutes on ice. Aliquots of 1 × 10⁵ cells each were dispensed into polypropylene tubes to which was added 10 µL or 20 µL of monoclonal mouse antibody solution against the respective cell surface markers, conjugated with its corresponding fluorochrome, according to the manufacturer’s instructions. One tube was for labeling the corresponding immunoglobulin (Ig) G1-phycoerythrin and IgG1-allophycocyanin isotype controls (Miltenyi Biotec). All the tubes were incubated for 30 minutes on ice and protected from light. The cells were washed twice with blocking buffer and resuspended in 1000 µL of PBS to acquire 1 × 10⁴ events per tube using a CyAn Advanced Digital Processing High-Speed Analyzer (Beckman Coulter, Barcelona, Spain).
Adipogenic differentiation
The visASCs and subASCs in passage 1 were seeded at 10,000 cells/cm2 and cultured under standard culture conditions. When cells reached 80% to 90% confluence, the expansion medium was replaced over the course of 72 hours with adipogenic medium composed of Dulbecco’s modified Eagle’s medium/F-12 supplemented with FBS (0.1 mL/mL), streptomycin (100 µg/mL), penicillin (100 U/mL), l-glutamine (2 mM), insulin (10 µM), isobutylmethylxanthine (0.5 mM), dexamethasone (1.0 µM), pioglitazone (10 µM), rosiglitazone (0.5 µM), biotin (33 µM), and pathenonate (17 µM). After 72 hours of adipogenic induction, the medium was replaced by the same medium but without isobutylmethylxanthine, biotin, and pathenonate. Adipogenesis was confirmed after 21 days by Oil Red O staining to visualize the characteristic cytoplasmic lipid droplets.
Gene expression by quantitative polymerase chain reaction
Total RNA was isolated using the RNA-Stat 60 Reagent (Ams Biotechnology, Oxon, UK) and reverse-transcribed to cDNA using the reverse-transcriptase enzyme (Transcriptor Reverse Transcriptase, 20 U/μL; Roche Applied Science, Penzberg, Germany). Quantitative reverse transcription polymerase chain reaction (qRT-PCR) was performed with 20 ng of cDNA and carried out using primers and probes specific for TaqMan gene expression assays (Applied Biosystems, Foster City CA) for the following genes: CCAAT/enhancer binding protein α (CEBPα; Hs 00269972_s1; RefSeq.NM_004364.3); peroxisome proliferator-activated receptor γ (PPARγ; Hs01115513_m1; RefSeq.NM_005037.5); GLUT4 (Hs00168966_m1; RefSeq NM_001042.2); fatty acid binding protein 4 (FABP4; Hs01086177_m1; RefSeq NM_001442.2); perilipin 1 (PLIN1; Hs00160173_m1; RefSeqNM_001145311.1); perilipin 2 (PLIN2; Hs00765634_m1; RefSeq NM_001122.3); collagen type I α 1 (Col1a1; Hs 00164004_m1; RefSeq.NM_000088.3); collagen type III α 1 (Col3a1; Hs00943809_m1); fibronectin 1 (FN1; Hs 00365052_m1; RefSeq. NM_002026.2); transforming growth factor β receptor 1 (TGFβ-R1; Hs00610320_m1; RefSeq. NM_001130916.1); TGFβ-R2 (Hs00234253_m1; RefSeq. NM_001024847.2); TGFβ1 (Hs00998133_m1; RefSeq. NM_000660.4); and Smad7 (Hs 00998193_m1; RefSeq. NM_001190821.1). As an endogenous control for the target gene in each reaction, ribosomal protein L13A (Hs 04194366-g1; RefSeq. NM_001270491.1) was used. Specific signals were normalized with respect to the endogenous control according to the 2-ΔΔCt formula for mRNA expression of CEBPα, PPARγ, GLUT4, FABP4, PLIN1, and PLIN2 in cells cultured in adipogenic medium, taking the cultured cells in expansion medium as the calibrator and the 2-ΔCt formula for mRNA expression of the other genes.
Immunoblot analysis
For the extraction of cytoplasmic proteins from the visASCs and subASCs in passage 3, NE-PER buffer plus protease/phosphatase inhibitor (Thermo Fisher Scientific Life Sciences, Waltham, MA) was used. Protein extracts (22 μg) mixed in ×4 Laemmli loading buffer with 2-mercaptoethanol (Bio-Rad) were loaded on a 7.5% sodium dodecyl sulfate–polyacrylamide gel electrophoresis gel, underwent electrophoresis, and then were transferred to polyvinylidene fluoride membranes. Membranes were blocked in tris-buffered saline Tween-20 plus 5% BSA for 1 hour at room temperature. Then, they were incubated overnight at 4°C with primary rabbit anti-human antibody for vinculin (Abcam, Cambridge, UK), with primary mouse anti-human antibody for Smad7 (Santa Cruz Biotechnology, Santa Cruz, CA). The membranes were washed thoroughly for 60 minutes with tris-buffered saline Tween-20 before incubation with the secondary goat anti-mouse IgG1 (1:5000) and goat anti-rabbit IgG (1:10,000) horseradish peroxidase conjugate (Abcam) for 1 hour at room temperature. Antibody complexes were visualized by chemiluminescence solution, using the Universal Hood II-ChemiDoc XRS (Bio-Rad). Signals were quantified by densitometry, using the ImageJ image processing program (National Institutes of Health, Bethesda, MD), and expressed as relative quantities with respect to the optical-density values of the respective loading control.
Apoptosis susceptibility assay
The visASCs and subASCs in passage 2 were suspended in maintenance medium and seeded in 6-well plates at 1 × 10⁴/cm2. After 8 days under standard culture conditions, apoptosis was induced for 24 hours by replacing the maintenance medium with Eagle’s Minimum Essential Medium, FBS free, or supplementing this medium with 100 ng/mL of TNFα. The apoptotic effects of both conditions were quantified by flow-cytometry labeling of phosphatidylserine with fluorescein isothiocyanate-conjugated annexin V (Miltenyi Biotec).
Determination of population doubling time
The visASCs and subASCs in passage 2 were seeded in duplicate at 3000 cells/cm2 in 12-well plates. The cells were detached with trypsin at 2, 4, 6, and 8 days of culture, and were counted using the trypan-blue exclusion assay with a Neubauer chamber. The population doubling time (PDT) was calculated using the formula PDT = 48/log2 (N2/N1), where N1 and N2 are the number of cells on days 6 and 8, respectively, after seeding.
Enzyme-linked immunosorbent assay
The visASCs and subASCs in passage 2 were resuspended in maintenance medium and seeded in 6-well plates at a density of 1.5 × 10⁴/cm2 for 8 days. After 72 hours from the last change of medium, the cells were washed with 2 M NaCl (20 mM HEPES, pH 7.4) for 5 seconds to remove cell surface-bound FGF2, according to the method of Zaragosi et al. (13). The Quantikine ELISA kit (R&D Systems, Minneapolis, MN) was used according to manufacturer’s instructions to detect FGF2. Data are expressed as picograms (mean ± standard error [SE]) of the secreted FGF2 per 106 cells at the time of harvest.
Colony-forming unit assay
The visASCs and subASCs in passage 2 were seeded in triplicate at 50 cells/cm2 and incubated for 14 days under standard culture conditions. Cells were fixed and stained with crystal violet solution (0.5% in methanol) for 10 minutes. After washing with water and air drying, the colonies formed by more than 50 cells were counted.
Statistical analysis
The results were expressed as mean ± standard error (SE). The Shapiro-Wilk test was used to test for normality. Comparisons between more than 2 groups were performed using the nonparametric Kruskal-Wallis test; those between 2 unpaired groups were made using the nonparametric Mann-Whitney U test. The correlation between variables was calculated with Spearman rho. All the statistical analyses were done using SPSS (version 17.0; IBM, Armond, NY). P values <0.05 were considered statistically significant.
Results
Anthropometric characterization and metabolic profile of the subjects
Patients with MS and those without had significantly higher BMI, waist circumference, waist-to-hip ratio, and uric acid values compared with Nw patients. The subjects with MS showed further deterioration in their metabolic profile because most of the metabolic variables evaluated in these patients showed statistically significant differences compared with the other 2 groups, with the exception of systolic blood pressure, and creatinine, urea, and apoliprotein A levels (Supplemental Table 1).
Decreased expression levels of adipogenic genes in visASCs and subASCs of subjects with MS
To verify the possible contribution of ASCs to the generation of adipocytes with lower expression levels of adipogenic genes, we isolated the adipose SVF and we induced in vitro adipogenic differentiation of the ASCs from patients with different metabolic profiles. Immunophenotypic characterization of visASCs and subASCs in passage 3 confirmed that the percentage of cells that coexpressed the multipotent mesenchymal cell markers CD73 and CD105 exceeded 94% (Supplemental Fig. 1).
Oil Red O staining confirmed cytoplasmic lipid accumulation in the ASCs cultured for 21 days in adipogenic medium [Supplemental Fig. 2(A)]. We did not observe significant differences in the mRNA levels of the transcription factors PPARγ and CEBPα between groups [Supplemental Fig. 2(B)]. However, gene expression of GLUT4 and FABP4 in subASCs from the patients with MS was significantly lower than those seen in subASCs from the other patient groups [Fig. 1(A)]. VisASCs from the subjects with MS also showed lower gene expression levels of GLUT4 and PLIN2 compared with those of Nw subjects and those without MS, respectively [Fig. 1(A)]. Interestingly, mRNA levels of these genes were negatively and significantly correlated with BMI [Fig. 1(B)], homeostasis model assessment of insulin resistance [HOMA-IR; Fig. 1(C)], low-density lipoprotein cholesterol, and total cholesterol values [Fig. 1(D)].
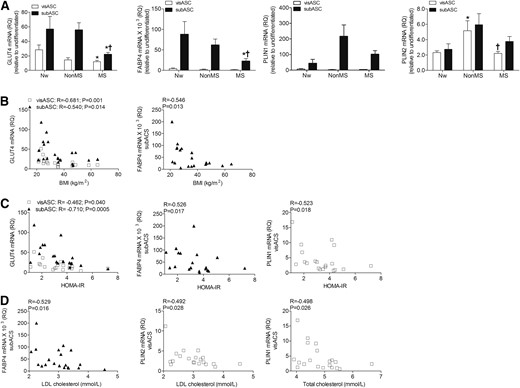
Expression levels of adipogenic genes in the visASCs and subASCs after 21 days of adipogenic differentiation. (A) GLUT4, FABP4, PLIN1, and PLIN2 mRNA expression levels in the ASCs of subjects grouped according to their metabolic profile. (B–D) Correlations between expression levels of adipogenic genes and BMI, HOMA-IR, and cholesterol level. GLUT4, FABP4, PLIN1, and PLIN2 mRNA values were determined by quantitative polymerase chain reaction and normalized to RPL13A mRNA, taking the cultured cells in nonadipogenic medium as the calibrator. (Nw, n = 5; non-MS, n = 6; MS, n = 9). *, significantly different results (Mann-Whitney U test, P < 0.05) compared with those of the Nw patients; †, significantly different results (Mann-Whitney U test, P < 0.05) compared with those of the patients without MS. HOMA-IR, homeostatic model assessment of insulin resistance; LDL, low-density lipoprotein; RQ, relative quantitation.
Decreased GLUT4 and PLIN1 mRNA levels in visASCs and subASCs correlated with increased expression levels of fibrotic proteins
In vitro experiments have shown that alterations in the expression pattern of extracellular matrix proteins can affect the expression of genes of the adipogenic lineage (14, 15). Thus, we subsequently examined mRNA levels of some of the proteins involved in the increased tissue fibrosis associated with obesity.
Expression levels of FN1 were negatively correlated with GLUT4 transcriptional levels in visASCs (R = −0.402; P = 0.079) and subASCs (R= −0.430; P = 0.058), but only PLIN1 mRNA had a significant negative correlation with expression levels of FN1 in subASCs [Fig. 2(A)]. Gene expression analysis also revealed statistically significant negative correlations between Col3a1 and PLIN1 mRNA levels in subASCs [Fig. 2(B)] and between Col1a1 and GLUT4 expression levels in both visASCs and subASCs [Fig. 2(C)]. In addition, Col1a1 mRNA levels in subASCs were positively associated with BMI and HOMA-IR [Fig. 2(D)].
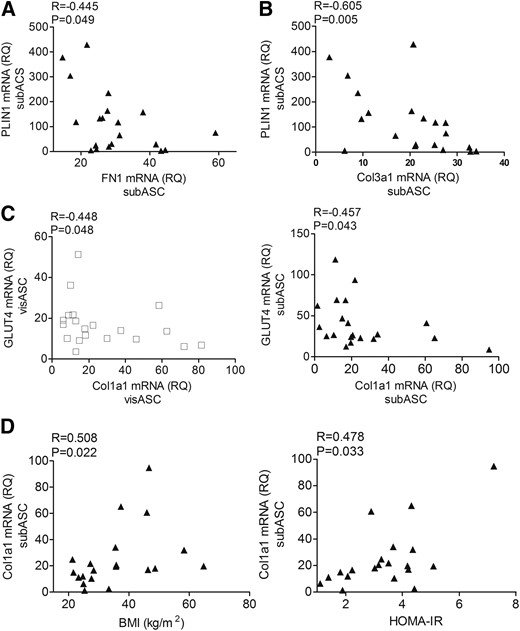
Expression levels of adipogenic genes and mRNA levels of proteins associated with adipose tissue fibrosis. (A, B) Correlation between the expression levels of PLIN1 with FN1and Col3a1 mRNA in subASCs. (C) Correlation between the expression levels of Glut4 and Col1a1 mRNA in the ASCs. (D) Correlation between the transcriptional levels of Col1a1 in the ASCs with patients’ BMI and HOMA-IR. Values are reported as mean ± SE (Nw, n = 5; non-MS, n = 6; MS, n = 9).
Moreover, although no significant differences were seen in the expression levels of TGFβ1 and TGFβ receptors, we detected significantly elevated Smad7 mRNA levels in the subASCs from patients without MS [Fig. 3(A)]. Furthermore, western blot analysis enabled us to confirm a significant increase in Smad7 protein levels in the cytoplasmic fraction of the subASCs from patients without MS compared with patients with MS [Fig. 3(B)].
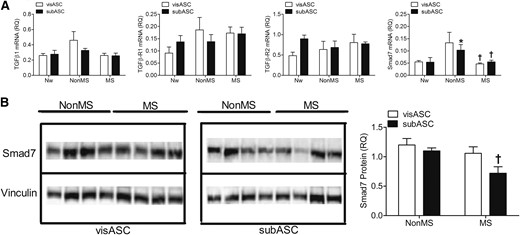
Expression of proteins involved in TGFβ signaling. (A) mRNA expression levels of TGFβ signaling components in ASCs from the subjects grouped by metabolic profile. Values are reported as mean ± SE (Nw, n = 5; non-MS, n = 6; MS, n = 9). (B) Smad7 expression detected by western blot. Proteins (22 μg) from the cytoplasmic fraction from the ASCs from subjects with different metabolic profiles were loaded on the respective lanes of polyacrylamide gels (7.5%), underwent electrophoresis under denaturing conditions, and were transferred to polyvinylidene fluoride membranes. The graph represents the relative optical density values revealed by specific labeling against Smad7 compared with those from the vinculin loading control. Values are reported as mean ± SE (non-MS, n = 4; MS, n = 4). *, significantly different results (Mann-Whitney U test, P < 0.05) compared with those of the Nw subjects; †, significantly different results (Mann-Whitney U test, P < 0.05) compared with those of patients without MS.
Lower susceptibility to apoptosis but longer PDT in the ASCs of patients with MS
Flow cytometry assessment [Fig.4(A)] revealed that visASCs and subASCs from patients without MS had a higher percentage of apoptotic cells when stimulated with TNFα than those from patients with MS; this was significantly so in the visASCs [Fig. 4(B)].
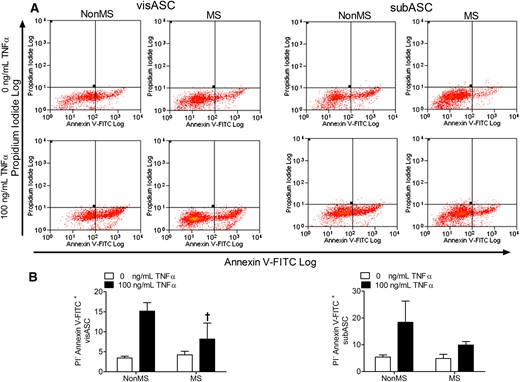
Induction of cell apoptosis in visASCs and subASCs from obese subjects with different metabolic profiles, cultured for 24 hours in serum-free medium with and without 100 ng/mL TNFα. (A) Detection of apoptotic cells by flow cytometry based on negative staining for propidium iodide but positive staining for annexin V conjugated to FITC. (B) Quantification by flow cytometry of the percentage of ASCs showing early apoptosis in obese subjects grouped according to their metabolic profile (non-MS, n = 4; MS, n = 6). †, Significantly different results (Mann-Whitney U test, P < 0.05) compared with those of the non-MS group. FITC, fluorescein isothiocyanate.
Although the PDT of the subASCs from the subjects with MS was significantly higher than that of the Nw and non-MS groups, the decreasing proliferative potential shown by the visASCs from the subjects with MS did not reach statistical significance (Fig. 5). Figure 5 also shows that the PDT of the ASCs, mainly in the subASCs, was positively correlated with HOMA-IR as well as with plasma glucose and triglyceride levels.
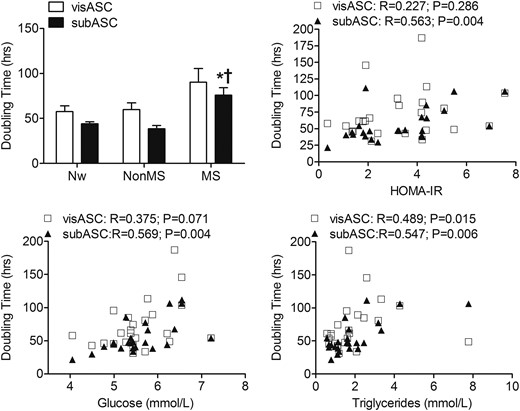
PDT of the visASCs and subASCs from the Nw and obese subjects with different metabolic profiles. The ASCs in passage 2 were seeded in duplicate at a density of 3000 cells/cm2 in 12-well plates and the PDT was calculated between the sixth and eighth day of culture. (Nw, n = 7; non-MS, n = 7; MS, n = 10). *, Significantly different results (Mann-Whitney U test, P < 0.05) compared with those of Nw patients; †, Significantly different results (Mann-Whitney U test, P < 0.05) compared with those of patients without MS.
Increased clonogenic potential and concentration of FGF2 retained on the surface of the subASCs of patients without MS
Given that in vitro experiments have shown autocrine signaling associated with FGF2 increases the rate of proliferation and the clonogenic potential of ASCs (13, 16), we analyzed whether amounts of FGF2 retained on the cell surface of the ASCs from the 2 types of patients (MS and non-MS) could be different. Enzyme-linked immunosorbent assay of the collected wash solution revealed a significantly decreased concentration of FGF2 retained by the visASCs and subASCs, with increased HOMA-IR [Fig. 6(A)] and increased plasma glucose levels, respectively [Fig. 6(B)]. In addition, we detected a significant increase in the FGF2 concentration retained by the subASCs derived from patients without MS compared with those derived from the other 2 groups of patients [Fig. 6(C)].
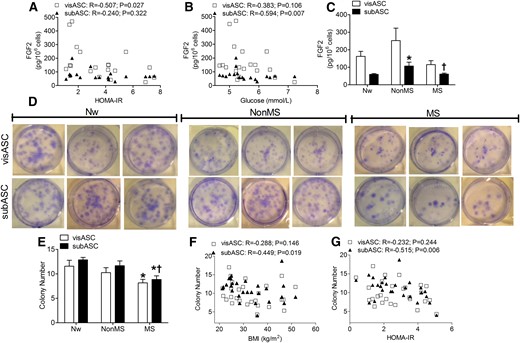
Clonogenic potential and FGF2 retention on the surface of visASCs and subASCs. (A–C) Correlation between (A) concentrations of FGF2 exported toward the surface of the ASCs with HOMA-IR and (B) plasma glucose concentrations in the patients. (C) FGF2 concentration retained on the surface of ASCs from subjects grouped by metabolic profile. (Nw, n = 4; non-MS, n = 6; MS, n = 9). (D) Crystal violet solution staining of colonies generated by ASCs seeded at low density and grown under standard conditions for 14 days in 6-well plates. (E–G) Number of colonies observed in the ASCs of the different patient groups. Correlation between (E)number of colonies and (F) patients’ BMI and (G) HOMA-IR . (Nw, n = 7; non-MS, n = 10; MS, n = 10). *, significantly different results (Mann-Whitney test, P < 0.05) compared with those of Nw patients; †, significantly different results (Mann-Whitney test, P < 0.05) compared with those of the non-MS group.
Crystal violet staining facilitated counting of the colonies generated over 14 days by the low-density culture of the ASCs [Fig. 6(D)]. Figure 6E shows that the number of colonies generated by the visASCs and subASCs from patients with MS was significantly lower than those from the Nw patients. Whereas the number of colonies generated by the subASCs had a significant negative correlation with BMI [Fig. 6(F)] and HOMA-IR [Fig. 6(G)], the clonogenic potential of the subASCs of patients without MS was significantly higher than that of those with MS and did not differ significantly from that of the Nw patients [Fig.6(E)].
Discussion
Previous studies have documented the decrease in the adipogenic differentiation capacity of ASCs from obese patients (3–7). To our knowledge, our study is the first to report that with the increase in BMI, HOMA-IR, and cholesterol level, the adipocytes generated from visASCs and subASCs showed a decrease in the intrinsic expression levels of adipogenic genes in parallel with an increase in fibrotic protein expression. We also observed that a worsening metabolic profile in patients was accompanied by a decrease in the proliferative rate, clonogenic potential, and export of FGF2 to the cell surface of the ASCs derived from both tissues (i.e., visceral and subcutaneous).
Previous gene expression analyses have shown that FABP4 mRNA expression levels in subcutaneous adipose tissue of obese patients with insulin resistance were lower than those in lean patients (17), and the decrease in GLUT4 mRNA levels of subcutaneous adipose tissue is related more to insulin resistance and type 2 diabetes than to obesity itself (18). In line with these results, we found that the adipocytes generated from subASCs of patients with MS had lower FABP4 and GLUT4 expression levels than those generated from ASCs of Nw patients. Because FABP4 is involved in uptake of fatty acids (19) and GLUT4-mediated glucose uptake induces expression of the lipogenic transcription factor carbohydrate-responsive element-binding protein (20), it is likely that the decreased FABP4 and GLUT4 expression in adipocytes affects the cytoplasmic lipid accumulation and the consequent expansion by hypertrophy of the adipose tissue in subjects with MS. It has been confirmed that decreased GLUT4 in the adipose tissue of obese subjects with insulin resistance is accompanied by a decrease in levels of lipogenic enzymes (21). When comparing the 2 obese groups, only the adipocytes generated from the subASCs showed significant differences in GLUT4 and FABP4 expression levels between the non-MS and MS groups, suggesting a possible protective role of subcutaneous adipose tissue on the metabolic profile of subjects without MS.
We also observed that the decrease in PLIN1 and GLUT4 expression levels was not accompanied by variations in the amounts of mRNA of the adipogenic transcription factors C/EBPα and PPARγ but by increased expression of FN1, Col3a1, and Col1a1. Therefore, we did not rule out the possibility that the transcription factors associated with TGFβ signaling and involved in the increased expression of fibrotic proteins have interfered with the transcription of adipogenic genes, because it is now recognized that TGFβ signaling can influence gene expression in precursor cell differentiation (22, 23).
The significant increase in Col1a1 expression in the subASCs, which was associated with the increase in BMI and HOMA-IR, suggests a contribution of the subASCs to the increase in pericellular tissue fibrosis seen in adipocytes from obese subjects (24). Because increased tissue fibrosis has been negatively correlated with the average size of small and medium adipocyte fractions (24–26), it is likely that the adipocytes generated from the subASCs with high levels of Col1a1 expression also have restricted hypertrophic capacity. In fact, it has been confirmed that the level of Col6a3 mRNA expression in small adipocytes is significantly higher than in large adipocytes (27).
The adipose-tissue remodeling that occurs during obesity is not only accompanied by a disproportionate synthesis of extracellular matrix components (28) but also by a decreasing number of adipocytes (3, 29). Interestingly, the subASCs of the subjects without MS expressed significantly elevated levels of Smad7, a TGFβ-signaling inhibitory protein, suggesting the possibility that they are protected from the increased fibrosis associated with TGFβ signaling. Consistent with this interpretation, in vivo experiments have shown that blocking TGFβ signaling protects mice from diabetes and hepatic steatosis (30, 31), whereas overexpression of Smad7 decreases accumulation of fibrotic proteins in the kidney of diabetic rats (32). Increased Smad7 expression levels may also be responsible for the increased susceptibility to apoptosis seen in the ASCs from subjects without MS; in vitro experiments have confirmed that Smad7 can sensitize cells to TNFα-induced apoptosis (33), probably through their inhibitory effects on nuclear factor κB signaling (34).
The increase in PDT in the subASCs may decrease the availability of precursor cells and thereby contribute to the decrease in the number of adipocytes observed in the adipose tissue of obese subjects with insulin resistance (3, 29, 35). Thus, the higher proliferation rate observed in the subASCs of the non-MS group, compared with the MS group, suggests that their subcutaneous adipose tissue might be better able to expand to caloric intake; in vivo experiments have shown that subASCs proliferate in response to a high-fat diet (36). Consistent with the decrease in proliferative potential of the ASCs associated with a worsening metabolic profile in the patients, the number of colonies generated by visASCs and subASCs of the subjects with MS was significantly lower those of Nw subjects.
Because FGF2 is known as one of the intrinsic regulators of ASC proliferation and differentiation (37), it might be responsible for maintaining the proliferative and clonogenic potential, as well as GLUT4 and FABP4 expression levels, observed mainly in the subASCs of the non-MS group. Concordantly, the concentration of FGF2 retained on the surface of these cells was significantly higher in the non-MS group than in the other 2 groups of subjects. In fact, it has been shown that ASCs express an FGF2 autocrine signaling loop that promotes the maintenance of clonogenic potential and prevents the loss of differentiation ability (13, 16). Furthermore, previous experiments have also confirmed that the treatment of ASCs with FGF2 not only can reduce the expression levels of fibrotic proteins such as fibronectin and type I collagen but also reverse the TGFβ-induced myofibroblastic phenotype (38). In line with this study, we have observed that an increased concentration of FGF2 retained on the surface of the subASCs from the subjects without MS is accompanied by decreased expression levels of Col1a1. Thus, our results suggest that FGF2, together with Smad 7, could exert a protective function in the activation of TGFβ signaling, according to recent evidence that suggests a higher vulnerability of subASCs in obese subjects (39).
In conclusion, our results indicate that visASCs and subASCs may be involved in the variations in adipose cellularity that occur during the development of insulin resistance, through a decrease in their clonogenic and proliferative potential; generation of adipocytes with lower levels of GLUT4, FABP4, and PLIN2 expression; and high expression of fibrotic proteins. Moreover, ASCs may contribute to the protective effects of subcutaneous adipose-tissue expansion in the obese patients without MS by stimulating the autocrine signaling associated with the surface retention of FGF2. Thus, our results suggest that the decrease in mRNA of adipogenic genes and clonogenic potential, as well as the accumulation of fibrotic proteins with metabolic alterations, could be a relevant mechanism controlling the number and size of neogenerated adipocytes and could be involved in adipose-tissue expansion alteration.
Abbreviations:
- ASC
adipose tissue–derived mesenchymal stem cell
- BMI
body mass index
- BSA
bovine serum albumin
- CEBPα
CCAAT/enhancer binding protein α
- COL1A1
collagen type I α 1
- COL3A1
collagen type III α1
- FABP4
fatty acid binding protein 4
- FBS
fetal bovine serum
- FGF2
fibroblast growth factor 2
- FN1
fibronectin 1
- HOMA-IR
homeostatic model assessment of insulin resistance
- MS
metabolic syndrome
- non-MS
without metabolic syndrome
- Nw
normoweight
- PBS
phosphate-buffered saline
- PDT
population doubling time
- PLIN
perilipin
- PPARγ
peroxisome proliferator activated receptor γ
- qRT-PCR
quantitative real-time polymerase chain reaction
- subASC
subcutaneous adipose tissue–derived mesenchymal stem cell
- SVF
stromal vascular fraction
- TGFβ-R1
transforming growth factor β receptor 1
- TGFβ-R2
transforming growth factor β receptor 2
- visASC
visceral adipose tissue-derived mesenchymal stem cell
Acknowledgments
We thank all the patients for their collaboration. Centros de Investigación Biomédica en Red (CIBER) Fisiopatología de la Obesidad y Nutrición (Pathophysiology of Obesity and Nutrition) is part of the Instituto de Salud del Carlos III (Institute of Health Carlos III [ISCIII]) Project. We thank Maria Repice for her help with the English-language version of the text.
This work was cofunded by the European Union through the European Regional Development Fund and supported by grants from the Ministry of Economy and Competitiveness, ISCII (Grants PI13/02628, PI12/02355, FIS PI14/00696, and PI12/01373), and the Ministry of Economy and Knowledge (Grants PI-CTS-08181/2011, CTS-7895/2011, and CTS-656). R. E.-B. and M. B.-L. are supported by a fellowship from the ISCIII “Miguel Servet II” (CP13/00041) and “Miguel Servet I” (CP15/00028).
Author contributions: W.O.-O. designed the experiment, researched data, and wrote the manuscript. L.C.-A., S.L., M.C.-P. researched data and contributed to the discussion. J.A.T. researched data and edited the manuscript. M.R.B.-L. selected the control patients, scientifically revised the manuscript, and contributed to the discussion. R.E.-B. and F.J.T. designed the experiment, reviewed and edited the manuscript, and supervised the study. F.J.T. is the guarantor of this work and, as such, had full access to all the data in the study and takes responsibility for the integrity of the data and the accuracy of the data analysis.
Disclosure Summary: The authors have nothing to disclose.
References
Author notes
Address all correspondence and requests for reprints to: Wilfredo Oliva-Olivera, PhD, Hospital of Malaga (Virgen de la Victoria), Campus of Teatinos, s/n, Research Laboratory, First Floor, Málaga 29010, Spain. E-mail: [email protected].
