


Abstract
Recent studies have highlighted the role of height in complex diseases, but conflicting information has been reported on height as a predictor of changes in glycemia and risk of type 2 diabetes.
Our aim was to investigate the association of height with insulin sensitivity, insulin secretion, glycemia, type 2 diabetes, and cardiovascular disease (CVD) in a large prospective population-based study.
The study included 8746 Finnish men (mean ± standard deviation, age 57.2 ± 7.1 years, body mass index, 26.8 ± 3.8 kg/m2) selected from a population-based Metabolic Syndrome in Men (METSIM) study.
The study was conducted at Kuopio University Hospital and University of Eastern Finland.
The participants were nondiabetic at the recruitment, and 5401 subjects have participated in the follow-up study. During the follow-up, a total of 693 subjects converted to type 2 diabetes and 351 were diagnosed with a new CVD event during the follow-up.
The main outcome measures were incidence of type 2 diabetes and CVD.
Height measured at baseline was significantly associated with lower levels of 2-hour glucose in an oral glucose tolerance test, an increase in insulin secretion, a decrease in the risk of type 2 diabetes [hazard ratio (HR) = 0.83(confidence interval [CI] 0.77 to 0.90)] and CVD [HR = 0.75(CI 0.67 to 0.83)] during the follow-up.
Short stature is associated with unfavorable changes in glucose metabolism and predicts an increase in the risk of type 2 diabetes and cardiovascular events.
Various anthropometric measures such as body mass index (BMI), waist circumference, and waist to-hip ratio have been shown to predict cardiovascular disease (CVD) (1) and type 2 diabetes (2). By contrast, adult height is inversely associated with total mortality (3, 4) and CVD in adults (3–7).
Studies investigating height as a predictor of the risk of type 2 diabetes have been conflicting mainly due to the low number of converters to diabetes, different study designs (cross-sectional, longitudinal), different age distribution of participants, and the definition of diabetes [self-reported, clinical diagnosis, oral glucose tolerance test (OGTT)]. Some prospective studies have shown no significant effect on the risk of diabetes after adjustment for confounding factors (8, 9), while others have reported an inverse association only in men (10) or in women (11, 12). None of the previous large prospective population-based studies has investigated the association of height with glycemic parameters during the follow-up, or mechanisms underlying the association of height with disturbances in glucose metabolism and risk of type 2 diabetes.
The aim of this study was to investigate the association of adult height with fasting glucose, 2-hour glucose, glucose area under the curve in an OGTT, OGTT-based indices of β-cell function, insulin sensitivity, the risk of type 2 diabetes and CVD in a population-based study of 8746 Finnish men.
Research Design and Methods
Cross-sectional study of the METSIM cohort
The Metabolic Syndrome in Men (METSIM) Study comprises 10,197 Finnish men aged from 45 to 70 years and randomly selected from the population register of Kuopio, Eastern Finland, as previously described (13). The study performed in 2005 to 2010 was approved by the Ethics Committee of the University of Eastern Finland and Kuopio University Hospital and conducted in accordance with the Helsinki Declaration. All study participants gave written informed consent.
A CONSORT diagram for the selection of METSIM participants for different statistical analyses (incident type 2 diabetes, incident cardiovascular events, analyses based on the follow-up data) is shown in Supplemental Fig. 1. A total of 8746 participants did not have diabetes at a cross-sectional study [age 57.2 ± 7.1 years, BMI 26.8 ± 3.8 kg/m2, mean ± standard deviation (SD)], and 6298 have participated in the ongoing follow-up study. Selected baseline clinical and laboratory measurements of the participants are shown in Table 1. Glucose tolerance status was evaluated with a 2-hour OGTT (75 g of glucose) after a 12-hour overnight fast according to the American Diabetes Association criteria (14).
Baseline Clinical and Laboratory Measurements (Mean ± SD, Percentage) Across the Quintiles of Height in METSIM Participants Without Diabetes (N = 8746)
| Variable | All Subjects | Quintile 1 (N = 1773) | Quintile 2 (N = 1663) | Quintile 3 (N = 1866) | Quintile 4 (N = 1697) | Quintile 5 (N = 1747) | P | P1 |
|---|---|---|---|---|---|---|---|---|
| Height (cm) | 8746 | 167.3 ± 3.0 | 172.6 ± 1.0 | 176.0 ± 1.0 | 179.4 ± 1.0 | 185.0 ± 3.3 | <0.001 | <0.001 |
| Weight (kg) | 8746 | 75.6 ± 11.1 | 80.0 ± 11.4 | 83.1 ± 12.0 | 86.4 ± 12.2 | 91.1 ± 13.3 | — | <0.001 |
| Body mass index (kg/m2) | 8746 | 27.0 ± 3.9 | 26.9 ± 3.8 | 26.8 ± 3.9 | 26.8 ± 3.8 | 26.6 ± 3.7 | <0.001 | <0.001 |
| Waist circumference (cm) | 8745 | 95.2 ± 10.4 | 96.3 ± 10.4 | 97.3 ± 10.6 | 98.7 ± 10.2 | 99.7 ± 10.8 | <0.001 | — |
| Fat mass (%) | 8727 | 24.0 ± 6.9 | 23.5 ± 6.5 | 23.4 ± 6.4 | 23.4 ± 6.0 | 22.8 ± 5.6 | <0.001 | 0.153 |
| LDL cholesterol (mmol/l) | 8743 | 3.33 ± 0.9 | 3.35 ± 0.9 | 3.38 ± 0.9 | 3.39 ± 0.9 | 3.39 ± 0.8 | 0.111 | 0.316 |
| HDL cholesterol (mmol/l) | 8744 | 1.49 ± 0.4 | 1.46 ± 0.4 | 1.47 ± 0.4 | 1.44 ± 0.4 | 1.42 ± 0.4 | <0.001 | 0.368 |
| Total triglycerides (mmol/l) | 8746 | 1.37 ± 0.8 | 1.40 ± 1.2 | 1.39 ± 0.8 | 1.39 ± 0.8 | 1.44 ± 1.1 | <0.001 | <0.001 |
| ApoA1 (g/l) | 8744 | 1.43 ± 0.2 | 1.42 ± 0.2 | 1.42 ± 0.2 | 1.41 ± 0.2 | 1.40 ± 0.2 | 0.390 | 0.076 |
| ApoB (g/l) | 8744 | 1.03 ± 0.3 | 1.03 ± 0.3 | 1.04 ± 0.3 | 1.04 ± 0.3 | 1.05 ± 0.3 | <0.001 | <0.001 |
| Systolic BP (mmHg) | 8746 | 140.0 ± 17.1 | 138.3 ± 16.2 | 136.6 ± 16.3 | 136.0 ± 16.0 | 134.9 ± 15.0 | <0.001 | <0.001 |
| Diastolic BP (mmHg) | 8746 | 86.3 ± 9.2 | 86.9 ± 9.2 | 87.0 ± 9.3 | 87.7 ± 9.4 | 88.2 ± 9.1 | <0.001 | 0.700 |
| Smokers (N) | 1593 | 325 | 305 | 341 | 311 | 311 | 0.993a | 0.993a |
| Alanine aminotransferase (U/l) | 8746 | 30.3 ± 17.5 | 31.1 ± 19.9 | 31.7 ± 20.1 | 32.2 ± 25 | 31.2 ± 17.7 | <0.001 | <0.001 |
| Adiponectin (μg/ml) | 8744 | 8.4 ± 4.9 | 7.9 ± 4.0 | 8.0 ± 5.1 | 7.8 ± 3.8 | 7.7 ± 3.8 | <0.001 | 0.067 |
| Fasting glucose (mmol/l) | 8746 | 5.71 ± 0.5 | 5.70 ± 0.5 | 5.73 ± 0.5 | 5.72 ± 0.5 | 5.72 ± 0.5 | <0.001 | 0.146 |
| 2-h glucose (mmol/l) | 8746 | 6.32 ± 1.7 | 6.18 ± 1.7 | 6.05 ± 1.7 | 5.96 ± 1.7 | 5.74 ± 1.6 | <0.001 | <0.001 |
| Glucose AUC | 8716 | 909.2 ± 140 | 897.3 ± 137.5 | 887.5 ± 138 | 879.4 ± 131 | 860.9 ± 131.3 | <0.001 | <0.001 |
| Fasting insulin (pmol/l) | 8742 | 48.4 ± 33.3 | 49.5 ± 34.2 | 50 ± 40 | 50.3 ± 33.7 | 49.3 ± 34.9 | <0.001 | <0.001 |
| Matsuda ISI (mg/dl, mU/l) | 8694 | 6.71 ± 4.1 | 6.79 ± 4.2 | 7.06 ± 4.2 | 6.86 ± 4.1 | 7.13 ± 4.1 | <0.001 | <0.001 |
| InsulinAUC0–30/GlucoseAUC0-30 (pmol/mmol) | 8700 | 30.7 ± 20.7 | 31.4 ± 21.5 | 30.8 ± 22.9 | 31.0 ± 19.7 | 31.6 ± 22.5 | <0.001 | <0.001 |
| Disposition index (mg/dl, mU/l, pmol/mmol) | 8694 | 158.0 ± 75.8 | 161.1 ± 70.4 | 162.1 ± 70.2 | 163.5 ± 69.3 | 173.0 ± 72.6 | <0.001 | <0.001 |
Mean ± SD were obtained from analysis of variance. P values were obtained from analysis of covariance including height as a categorical variable and adjusted for age, weight, smoking, and physical activity. P1 adjusted for age, waist, smoking, and physical activity. Statistically significant P values are indicated in bold.
Abbreviation: HDL, high-density lipoprotein.
P value obtained from χ2 test.
Follow-up study of the METSIM cohort
So far, 6298 subjects from the original METSIM cohort have participated in our prospective follow-up study in 2010 to 2016 (mean follow-up time of 4.6 years). The study protocol and measurements were identical to those of the baseline study.
Diagnosis of type 2 diabetes was based on the following criteria: (a) fasting plasma glucose ≥7.0 mmol/l, 2-hour plasma glucose ≥11.1 mmol/l in an OGTT, or HbA1c ≥ 6.5% (48 mmol/mol) among 5401 who did not have diabetes at baseline and who had follow-up data (n = 395 cases of new diabetes based on an OGTT); (b) glucose-lowering medication started after the baseline study (n = 261 cases of new diabetes; information obtained from the National Drug Reimbursement registry for all 8746 nondiabetic participants); (c) type 2 diabetes diagnosed by physician as per medical records and/or fasting plasma glucose ≥7.0 mmol/l, 2-hour plasma glucose ≥11.1 mmol/l, or HbA1c ≥ 6.5% (48 mmol/mol) in outpatient/primary care laboratory measurements (n = 37 cases of new diabetes).
An incident cardiovascular event was defined as myocardial infarction, coronary heart disease death, or fatal and nonfatal cerebral infarction which occurred after the baseline study. Cardiovascular events were defined according to internationally accepted criteria (15, 16) and verified from the hospital records. Individuals with nonfatal myocardial infarction and stroke before the baseline were excluded from statistical analyses when analyzing cardiovascular events. Overall, out of 8746 nondiabetic participants at entry, the study included 693 cases of type 2 diabetes and 351 cases of CVD.
Clinical and laboratory measurements
Cross-sectional and follow-up studies of the METSIM cohort had identical protocols and similar clinical and laboratory measurements. Height and weight were measured to the nearest 0.5 cm and 0.1 kg, respectively. BMI was calculated as weight (kg) divided by height squared. Waist (at the midpoint between the lateral iliac crest and lowest rib) and hip circumference (at the level of the trochanter major) were measured to the nearest 0.5 cm. Body composition was determined by bioelectrical impedance (TBF-300 Bioimpedance Balance; Tanita International Division, Middlesex, UK). Blood pressure (BP) was measured in the sitting position after a 5-min rest with a mercury sphygmomanometer. An average of 3 measurements was used to calculate systolic and diastolic BP. Smoking status was defined as current smoking (yes vs no). Physical activity (physically active vs inactive) refers to leisure time exercise (physically active, regular exercise at least 30 min ≥1 time per week; physically inactive, occasional exercise or no exercise).
Samples for plasma glucose were drawn at 0, 30, and 120 min of a 2-hour OGTT (75 g of glucose). Plasma glucose was measured by enzymatic hexokinase photometric assay (Konelab Systems reagents, Thermo Fisher Scientific; Vantaa, Finland). Insulin was determined by immunoassay (ADVIA Centaur Insulin IRI no. 02230141; Siemens Medical Solutions Diagnostics, Tarrytown, NY). Low-density lipoprotein cholesterol (LDL-C) and high-density lipoprotein cholesterol were measured by enzymatic colorimetric tests (Konelab Systems Reagents). Total triglycerides and alanine aminotransferase were measured by standard methods (Konelab Systems Reagents). Apolipoproteins A1 and B were determined by immunoturbidimetry (Konelab Systems Reagents). Total plasma adiponectin was measured by an enzyme-linked immunosorbent assay (Human Adiponectin ELISA Kit, Linco Research).
Calculations and statistical analysis
The trapezoidal method was used to calculate the glucose area under the curve (AUC) in an OGTT using plasma glucose samples collected at 0, 30, and 120 min. The Matsuda index of insulin sensitivity (ISI) was calculated to estimate insulin sensitivity (17). Insulin secretion index was calculated as InsAUC0–30/GlucAUC0–30 (13). The disposition index (a measure of β-cell function) was calculated as Matsuda ISI x Insulin secretion index, as previously reported (13).
Statistical analyses were conducted using IBM SPSS Statistics version 21 (SPSS, Chicago, IL). Changes in several parameters at baseline were tested across quintiles of height by analysis of variance. Association of height at baseline with various traits at follow-up were examined by linear regression. Cox regression analysis was used to evaluate the association of height with incident type 2 diabetes and CVD. Hazard ratios (HRs) per SD unit are presented with their 95% confidence intervals (CIs). The analyses was primarily adjusted for age, weight or waist, smoking, physical activity and follow-up time, where appropriate. Additional adjustments were done for Matsuda ISI, disposition index (Tables 2 and 3); alcohol consumption, family history of diabetes, LDL-C, drug treatment of hypertension, 2-hour glucose and the presence/absence of type 2 diabetes (Table 3). The tertiles of BMI were formed at baseline to evaluate the height as a predictor for incident type 2 diabetes and CVD. P value < 0.0021 was considered statistically significant given the 22 traits and 2 events tested. P < 0.05 was considered as nominally significant. All continuous variables except for age were log10-transformed to correct for their skewed distribution.
Association of Height Measured at Baseline With Clinical and Laboratory Parameters, Insulin Sensitivity, and Insulin Secretion at Follow-Up (N = 5401) in METSIM Participants Without Diabetes
| Variable at Follow-Up | B | SE | β | P | P1 | P2 | P3 |
|---|---|---|---|---|---|---|---|
| Weight (kg) | 1.204 | 0.030 | 0.289 | <0.001 | <0.001 | <0.001 | 0.401 |
| Body mass index (kg/m2) | −0.792 | 0.029 | −0.214 | <0.001 | <0.001 | <0.001 | 0.647 |
| Waist circumference (cm) | 0.539 | 0.039 | 0.187 | <0.001 | <0.001 | <0.001 | 0.392 |
| Fat mass (%) | −0.328 | 0.080 | −0.041 | <0.001 | 0.002 | <0.001 | <0.001 |
| LDL cholesterol (mmol/l) | 0.088 | 0.115 | 0.011 | 0.446 | 0.951 | 0.554 | 0.092 |
| HDL cholesterol (mmol/l) | 0.135 | 0.101 | 0.018 | 0.184 | 0.086 | 0.332 | 0.278 |
| Triglycerides (mmol/l) | −0.848 | 0.170 | −0.068 | <0.001 | 0.039 | <0.001 | <0.001 |
| Apo A1 (g/l) | −0.132 | 0.066 | −0.029 | 0.045 | <0.001 | 0.044 | 0.095 |
| Apo B (g/l) | −0.331 | 0.105 | −0.045 | 0.002 | 0.012 | 0.003 | 0.066 |
| Systolic BP (mmHg) | −0.200 | 0.044 | −0.062 | <0.001 | 0.002 | <0.001 | 0.222 |
| Diastolic BP (mmHg) | 0.050 | 0.041 | 0.017 | 0.224 | 0.030 | 0.108 | 0.059 |
| Alanine aminotransferase (U/l) | −1.264 | 0.176 | −0.097 | <0.001 | <0.001 | <0.001 | 0.005 |
| Adiponectin (μg/ml) | 0.178 | 0.342 | 0.015 | 0.602 | 0.235 | 0.878 | 0.442 |
| Matsuda ISI (mg/dl, mU/l) | 2.587 | 0.226 | 0.140 | <0.001 | — | <0.001 | <0.001 |
| InsulinAUC30/GlucoseAUC30 (pmol/mmol) | −0.996 | 0.224 | −0.059 | <0.001 | 0.157 | <0.001 | 0.699 |
| Disposition index (mg/dl, mU/l, pmol/mmol) | 1.596 | 0.177 | 0.126 | <0.001 | <0.001 | — | <0.001 |
Unstandardized B, standard error, standardized β, and P values were obtained from linear regression with height (at baseline) as independent variable and adjusted for age, waist, physical activity, smoking, and follow-up time. P1 adjusted as P and Matsuda ISI at baseline; P2 adjusted as P and disposition index at baseline; P3 adjusted as P and corresponding trait at baseline. Statistically significant P values are indicated in bold.
Abbreviations: HDL, high-density lipoprotein; SE, standard error.
Association of Height at Baseline With Glycemic Parameters, Type 2 Diabetes, and CVD Events at Follow-Up in METSIM Participants Without Diabetes
| Model | FPG at Follow-Up (N = 5401) | 2hPG at Follow-Up (N = 5401) | Glucose AUC at Follow-Up (N = 5370) | Type 2 Diabetes (N = 8746) | Cardiovascular Disease (N = 8198) | |||||||||||||
|---|---|---|---|---|---|---|---|---|---|---|---|---|---|---|---|---|---|---|
| B | SE | β | P | B | SE | β | P | B | SE | β | P | HR | 95% CI | P | HR | 95% CI | P | |
| 1 | 0.031 | 0.034 | 0.013 | 0.356 | −1.018 | 0.115 | −0.120 | 9.3E-19 | −0.458 | 0.061 | −0.101 | 1.0E-13 | 0.83 | 0.77 - 0.90 | 1.4E-06 | 0.75 | 0.67 - 0.83 | 4.6E-08 |
| 2 | −0.063 | 0.035 | −0.025 | 0.074 | −1.142 | 0.117 | −0.135 | 2.5E-22 | −0.592 | 0.062 | −0.131 | 2.6E-21 | 0.81 | 0.75 - 0.87 | 1.4E-07 | 0.81 | 0.72 - 0.91 | 2.2E-04 |
| 3 | 0.014 | 0.035 | 0.006 | 0.693 | −0.845 | 0.116 | −0.100 | 3.0E-13 | −0.415 | 0.061 | −0.092 | 1.1E-11 | 0.85 | 0.79 - 0.92 | 7.5E-05 | 0.82 | 0.73 - 0.92 | 8.2E-04 |
| 4 | 0.013 | 0.033 | 0.005 | 0.690 | −0.852 | 0.108 | −0.100 | 4.6E-15 | −0.415 | 0.056 | −0.092 | 9.9E-14 | 0.88 | 0.81 - 0.95 | 0.001 | 0.82 | 0.73 - 0.92 | 6.2E-04 |
| 5 | −0.062 | 0.031 | −0.025 | 0.047 | −0.604 | 0.102 | −0.071 | 3.7E-09 | −0.247 | 0.053 | −0.055 | 3.3E-06 | 0.88 | 0.81 – 0.95 | 0.001 | 0.82 | 0.73 – 0.92 | 5.0E-04 |
Unstandardized B, SE, standardized β and P values were obtained from linear regression to evaluate the association of height with glycemic parameters at follow-up. Cox regression analyses was applied to evaluate the association of height with incident type 2 diabetes (N = 693) and the risk of CVD (N = 351). Model 1: unadjusted; Model 2: adjusted for age, waist, physical activity, smoking, alcohol, family history of diabetes, follow-up time (linear regression model), LDL cholesterol, and drug treatment of hypertension; Model 3: adjusted for variables in Model 2 and Matsuda ISI; Model 4: adjusted for variables in Model 2 and the disposition index; Model 5: adjusted for variables in Model 2 and corresponding trait at baseline for continuous traits; type 2 diabetes: adjusted for variables in Model 2 and 2hPG at baseline; CVD: adjusted for variables in Model 2 and presence or absence of type 2 diabetes.
Abbreviations: 2hPG, 2-hour plasma glucose; FPG, fasting plasma glucose.
Results
Cross-sectional study
Most of the traits examined were significantly different across quintiles of height (Table 1). Weight and waist circumference were significantly higher in taller individuals than in shorter individuals. Among various glucose measures, 2-hour glucose and glucose AUC were significantly lower in taller subjects. Insulin secretion (disposition index) was significantly higher in taller subjects. Among various cardiovascular risk factors, systolic BP was significantly lower in the taller group across all adjustments. Levels of 2-hour glucose across the quintiles of height decreased and were lower by 8.5% for the highest quintile compared with that for the lowest quintile (Fig. 1). Insulin secretion index and disposition index increased significantly with increasing height. In comparison with the reference category, disposition index increased significantly up to 9% in the tallest category. Also insulin sensitivity increased across the quintiles of height but less compared with the disposition index.
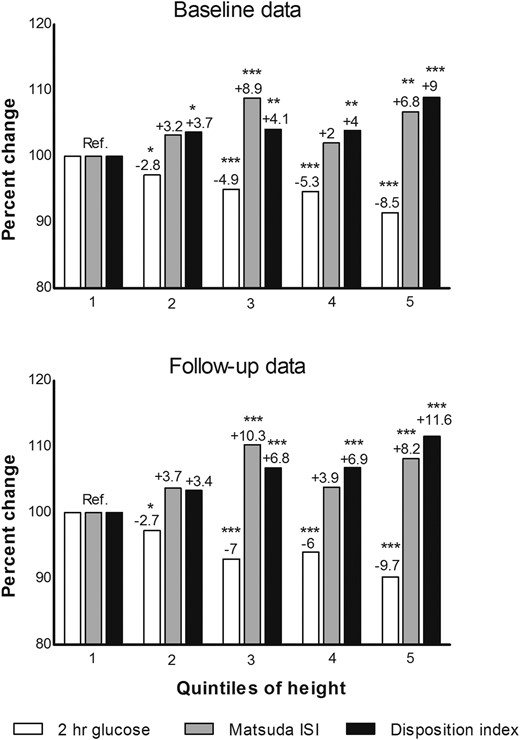
Percent difference per quintile in 2-hour glucose levels, Matsuda ISI and disposition index across quintiles of height (at baseline) in nondiabetic subjects having both baseline and follow-up data (N = 5401). Percent difference calculated based on mean values obtained from analysis of variance. Quintile 1 (reference) includes shortest subjects. N for each quintile: 1100, 1040, 1129, 1031, 1101. Overall P values for both baseline and follow-up data based on analysis of variance for all 3 variables were ≤0.001. Reference values at baseline (2-hour glucose, 6.24 ± 1.61; Matsuda ISI, 6.87 ± 3.97; disposition index, 160.66 ± 69.29) and at follow-up (2-hour glucose, 6.49 ± 2.02; Matsuda ISI, 6.07 ± 4.19; disposition index, 153.30 ± 73.47). Significant P values in comparison with reference category were indicated as follows: *P < 0.05; **P < 0.01; ***P < 0.001
Follow-up study
Height was 176.0 ± 6.4 cm (mean ± SD) at baseline and 175.7 ± 6.4 cm at follow-up for those who participated in the follow-up study (N = 5401). The mean follow-up time was 4.6 years for continuous traits, 8.2 years for type 2 diabetes, and 7.2 years for CVD. Height was significantly associated with low fat mass %, low levels of triglycerides, high insulin sensitivity (Matsuda ISI) and higher disposition index at follow-up in linear regression models adjusted for confounding variables (Table 2). Height was also significantly and inversely associated with 2-hour glucose, Glucose AUC, low risk of type 2 diabetes, HR 0.83 (95% CI, 0.77 to 0.90), and incident cardiovascular events, HR 0.74 (95% CI, 0.67 to 0.82) during the follow-up (Table 3). The results remained significant after adjustments for confounders and other risk factors of type 2 diabetes and CVD.
Additional statistical analyses of height in the tertiles of BMI as a predictor for type 2 diabetes (the lowest BMI tertile, HR 0.78, 95% CI, 0.65 to 0.94; the middle BMI tertile, HR 0.83, 95% CI, 0.71 to 0.96; the highest tertile HR 0.87, 95% CI, 0.79 to 0.96) and CVD (the lowest BMI tertile, HR 0.72, 95% CI, 0.60 to 0.88; in the middle BMI tertile, HR 0.74, 95% CI, 0.62 to 0.90; and for the highest BMI tertile, HR 0.77, 95% CI, 0.65 to 0.91) showed quite similar results, although greater height was associated with a somewhat lower risk for type 2 diabetes and CVD in the lowest tertile of BMI, compared with the highest tertile of BMI.
Conclusions
Our large prospective population-based study reports novel findings on the relationship between adult height and glycemic traits. First, our study shows that height was inversely associated with the risk of type 2 diabetes, 2-hour glucose, and glucose AUC in an OGTT. Second, height was positively associated with both β-cell function and insulin sensitivity. Finally, our study confirms previous findings that height is inversely associated with CVD events (3–7).
The mechanisms whereby height contributes to the risk of complex diseases in adults are largely unknown. Both genetic and environmental factors determine adult height. A recent genome-wide association study reported several hundreds of loci associated with height, and together, all common variants captured 60% of heritability (18). Height-associated common gene variants were significantly and inversely associated with coronary artery disease (risk reduction was 12%) in a recent study including 65,066 cases with coronary heart disease and 128,383 controls, partially explained by the effect of the gene variants on the levels of LDL-C and triglycerides (19). This observation is in agreement with our study and previously published epidemiological studies demonstrating that height is inversely associated with coronary heart disease (3–7).
Our 6-year follow-up study of the METSIM cohort demonstrated that height was significantly associated with decreased risk of type 2 diabetes, decreased levels of 2-hour glucose, and decreased glucose AUC in an OGTT, but no association was found with fasting glucose. In a previously published cross-sectional study, the height genetic risk score was not associated with decreases in the risk of diabetes or glucose levels, although there was a trend for decreased risk of diabetes (19). In our study, the risk reduction for type 2 diabetes was 14% to 16% and for CVD was 19% to 26%, depending on variables used in the adjustments. The difference between our study and the study applying genetic risk score could be partially explained by a causal association of total triglycerides with coronary heart disease (19) but not with type 2 diabetes or hyperglycemia shown previously in a Mendelian randomization study (20). Another possibility is that environmental factors (e.g., the fetal environment) may play a more important role in the risk of diabetes than in the risk of CVD. This notion is supported by studies demonstrating that low birth weight is associated with diabetes and CVD (21, 22) and with elevated fasting and 2-hour glucose levels in an OGTT in a systematic review of 48 studies (23). Some studies have reported that the components of stature, specifically leg length, was inversely associated with type 2 diabetes (24) and insulin sensitivity (25) suggesting that poor infant nutrition could be an important causal factor in the development of type 2 diabetes and insulin resistance in later life. Previous studies, however, have been mainly cross-sectional and considerably smaller than the METSIM study which might explain the different findings between the studies (23).
Type 2 diabetes is characterized by impaired β-cell function and insulin resistance, and a defect in insulin secretion is needed for the conversion to diabetes. Our study demonstrated that height was positively and significantly associated with both β-cell function (disposition index) and with insulin sensitivity (Matsuda ISI). Several studies including children or young adults born small for gestational age or with low birth weight have consistently shown that these individuals are insulin resistant (23, 26–30), but no data exist so far to demonstrate the relationship between height and impaired insulin secretion in young age. The mean age of METSIM participants in our study was 57 years, and therefore, our findings are not directly comparable to results reported from the studies including children and young adults because aging per se is associated with a continuous decrease in basal insulin release (31).
The strengths of our study are that it was based on a large cohort having follow-up data; furthermore, insulin sensitivity and secretion were measured by validated indices against gold standards measurements (13). Our study has limitations. For instance, it included only middle-aged and elderly Finnish men. Therefore, our results should be replicated in other ethnic populations, in women and younger individuals. Additionally, components of stature such as leg length were not measured in our study.
In conclusion, β-cell dysfunction in shorter subjects could possibly result in higher glucose levels followed by several downstream pathologic effects leading to a greater risk of type 2 diabetes and CVD. Hence, future mechanistic studies investigating the pancreatic β-cell function with respect to height might provide further insight into our understanding of complex diseases.
Abbreviations:
- 2hPG
2-hour plasma glucose
- BMI
body mass index
- BP
blood pressure
- CI
confidence interval
- CVD
cardiovascular disease
- HR
hazard ratio
- ISI
insulin secretion index
- LDL-C
low-density lipoprotein cholesterol
- METSIM
Metabolic Syndrome in Men
- OGTT
oral glucose tolerance test
- SD
standard deviation
- SE
standard error
Acknowledgments
This work was supported by the Academy of Finland (grant no. 271961 and 272741 to M.L.).
Disclosure Summary: The authors have nothing to disclose.
References
Author notes
Address all correspondence and requests for reprints to: Markku Laakso, MD, PhD, Professor, Institute of Clinical Medicine, Internal Medicine, University of Eastern Finland, and Department of Medicine, Kuopio University Hospital, 70210 Kuopio, Finland, E-mail: [email protected], phone: +358 40 672 3338
