


Abstract
Pancreatic neuroendocrine tumors (pNETs) are highly prevalent in patients with multiple endocrine neoplasia type 1 (MEN1), and metastatic disease is an important cause of MEN1-related mortality. Especially small nonfunctional (NF) pNETs pose a challenge to the treating physician and more information is needed regarding their natural course. We assessed long-term natural history of small NF-pNETs and its modifiers in the Dutch MEN1 population.
Retrospective longitudinal observational cohort study of patients with small (<2 cm) NF-pNETs from the Dutch national MEN1 database, which includes >90% of the Dutch MEN1 population. Modifiers of long-term natural course were analyzed using linear mixed-models analysis.
Growth rate of the 115 included small NF-pNETs from 99 patients was slow (0.4 mm/y; 95% confidence interval, 0.15 to 0.59). Seventy percent of the tumors was stable and a subgroup of 30% of the tumors was growing (1.6 mm/y; 95% confidence interval, 1.1 to 2.0). No differences in clinical characteristics were identified between growing and stable tumors. Within the subgroup of growing tumors, germline missense mutations were significantly associated with accelerated growth compared with nonsense and frameshift mutations.
The majority of small NF-pNETs are stable at long-term follow-up, irrespective of the underlying MEN1 genotype. A subgroup of tumors is slowly growing but cannot be identified on clinical grounds. In this subgroup, tumors with missense mutations exhibited faster growth. Additional events appear necessary for pNETs to progress. Future studies should be aimed at identifying these molecular driving events, which could be used as potential biomarkers.
Pancreatic neuroendocrine tumors (pNETs) occur sporadically but also in the context of familial tumor syndromes, such as multiple endocrine neoplasia type 1 (MEN1). MEN1 is caused by inherited mutations in the MEN1 tumor suppressor gene on chromosome 11, encoding the MENIN protein (1).
In MEN1, pNETs are highly prevalent (2, 3). Nonfunctional pNETs (NF-pNETs) are the most frequent type and the pancreas usually harbors multiple tumors (3, 4). At the age of 80 years, the penetrance of pNETs is over 80% and metastatic disease is the most important cause of MEN1-related mortality (2, 3, 5, 6).
A major challenge in determining the optimal management strategy for individual MEN1 patients with pNETs is the inability to predict natural behavior and metastatic potential (7, 8). Especially small (<2 cm) NF-pNETs detected through periodical screening pose a challenge to the treating physician. They seem to have an indolent course, but are not devoid of malignant potential (3). Up until today, based on what is customary in oncology, treatment decisions are based on tumor size and growth. Current expert-based MEN1 guidelines suggest follow-up for NF-pNETs smaller than 1 cm, unless tumors exhibit substantial growth; other groups advocate a conservative approach for tumors up to 2 cm (9, 10). More information on the natural course of these tumors and factors associated with tumor growth and behavior is necessary to come to an evidence-based personalized treatment strategy.
We aimed to clarify the long-term natural course of small MEN1-associated NF-pNETs and its modifiers in a retrospective national longitudinal cohort study. This knowledge will aid management decisions in MEN1-related small pNETs, but might also prove useful in the subset of sporadic NF-pNETs harboring somatic MEN1 mutations, because exome sequencing of sporadically occurring pNETs has identified inactivating mutations in the MEN1 gene in 44% of tumors (11).
Patients and Methods
Data were retrieved from the MEN1 database of the DutchMEN1 Study Group (DMSG), which includes more than 90% of the Dutch MEN1 population. MEN1 was diagnosed according to current guidelines (9). See previous reports for details regarding this database (12–14). The study protocol was approved by the ethical boards of all university medical centers in The Netherlands.
Study design and study population
We studied the growth of small (<2 cm) NF-pNETs and the development of new pNETs (incidence) in a retrospective longitudinal observational cohort study.
All patients included in the DMSG database with a pNET were identified based on histopathological analysis or, if unavailable, by consecutive imaging (Supplemental Materials and Methods).
Criteria for inclusion and exclusion
From each patient, the largest tumor in the pancreatic head, as well as the largest tumor in the pancreatic body-tail, was eligible for inclusion in the growth analysis.
Exclusion criteria for tumors for the growth analysis were as follows: (1) baseline size ≥2 cm, (2) functional tumor, (3) <2 scans, and (4) unclear tumor location or size.
Functional tumors were defined as follows. An insulinoma was defined as a positive 72-hour fast and curation after surgical resection. Because most gastrinomas in MEN1 have a duodenal origin (15), a pancreatic tumor was only deemed a gastrinoma if immunohistochemistry was positive for gastrin and biochemical cure was obtained for at least 6 months after its removal. When in doubt regarding functionality, tumors were not included in the growth analysis.
Exclusion criteria for patients for incidence analysis were as follows: (1) <2 scans, (2) unclear tumor numbers, and (3) previous pancreatic surgery.
Tumor size and the total number of pNETs were analyzed from the time a tumor was consecutively identified until the termination of follow-up, surgical removal, or systemic antitumor therapy [with exception of somatostatin analogs (SSAs)] for any neuroendocrine tumor (NET). Follow-up time for this study was defined as the time between the first and last scan.
Outcome measures
Primary outcome was the growth rate of NF-pNETs <2 cm, and secondary outcome was the number of incident tumors per patient as assessed on computed tomography (CT) or magnetic resonance imaging (MRI). For the analysis, the tumor size and number of pNETs on CT/MRI as reported by the senior radiologist was used.
Genotype was dichotomized to nonsense and frameshift mutations vs missense mutations in the MEN1 gene. Other types of mutations were excluded from this analysis because at present only in case of nonsense, frameshift and missense mutations, the effect on the MENIN protein can be predicted. In combination with loss of the wild type allele, nonsense and frameshift mutations are expected to be more severe and lead to complete absence of MENIN, whereas in the case of MEN1 missense mutations, some functional MENIN may still be present, probably leading to a milder phenotype (16, 17). We also assessed previously reported genotype–phenotype associations (18–21).
Statistical analysis
The development of tumor size over time for each individual tumor was graphically depicted using spaghetti curves, with tumor size in millimeters on the y-axis and time in quarters on the x-axis.
Linear mixed-models analysis, accounting for clustering of observations within patients, was performed to assess changes of tumor size over time (growth). The assumptions of the model were met. A two-level model with tumor size as the lowest level and tumor as the second level was used. Adjustments for tumor location and patient level did not influence outcomes (−2 log likelihood test). The model was constructed with tumor size in millimeters (residuals followed a normal distribution) as dependent variable and time in quarters as independent variable with a random intercept, as well as random slopes of time at the tumor level.
In addition, we assessed the best fit for the association between tumor size and time (e.g., linear, second to fifth order polynomials (−2 log likelihood test) and exponential (R2).
Determinants of growth (gender, age [dichotomized on the median], genotype, concomitant biochemical gastrinoma, newly diagnosed tumor vs tumor visible at first screening, use of SSA) were separately tested as effect modifiers.
Progressive tumors were compared with stable tumors in a subgroup analysis, and determinants of growth were separately tested as effect modifiers in stable and progressive tumors.
Tumor growth exceeding the mean tumor growth in the study population by 1.28 SE [corresponding with 80% confidence interval (CI)] was defined as progressive. Sensitivity analysis showed that the identified subgroups did not change if the 70% or the 95% CI was used to identify progressive tumors.
For the assessment of incident pNETs, a Poisson mixed-models analysis was used. A two-level model with repeated measurements of tumor number as the lowest level and patient as the second level was used. Subgroups with stable and progressive tumor numbers were defined in the same fashion as the tumor size subgroups.
Clinical characteristics were reported as mean [± standard deviation (SD)] or median [interquartile range (IQR)] as dictated by the distribution. Continuous variables were compared by the independent-sample t test or Mann-Whitney U test. Dichotomous variables were compared with Fisher’s exact test.
Statistical significance was set at P < 0.05. For the analysis of effect modification in the mixed-models analysis, statistical significance was set at P < 0.10. All analyses were conducted using IBM SPSS Statistics for Windows, version 23.0 (IBM Corp., Armonk, NY). Spaghetti plots were constructed in RStudio version 0.98.501 (RStudio, Inc., Boston, MA).
Results
A pNET was diagnosed in 205 (52%) patients (n = 94 pathologically confirmed, n = 107 imaging only, n = 4 imaging or pathology before 1990 only). Prevalence of a pNET was higher in patients with nonsense/frameshift mutations, compared with patients with missense mutations (Kaplan-Meier survival analysis, Supplemental Fig. 1, log-rank P < 0.05). Loss to follow-up in the entire cohort was 8% (31/392).
Study population
Flow charts of included patients are shown in Fig. 1(a) (growth analysis) and 1(b) (analysis of incidence), and patient characteristics are shown in Table 1. More information, including genotype, reason for exclusion, and tumor size, can be found in Supplemental Table 1.
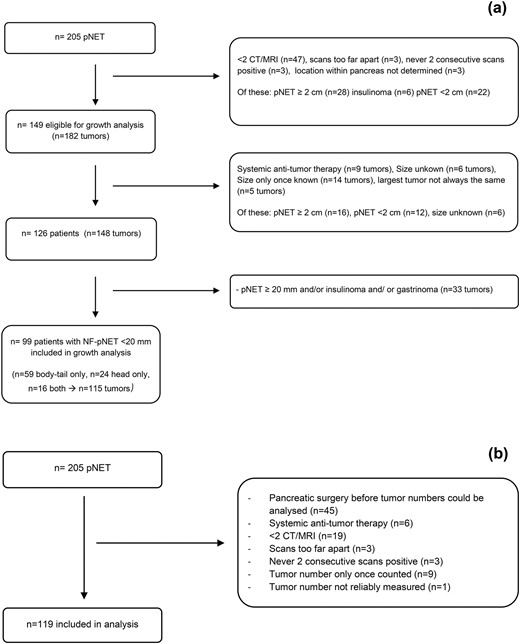
Flowcharts study population. (a) Flowchart growth analysis NF-pNETs <2 cm. (b) Flowchart incidence analysis.
Characteristics of Patients With a pNET Included in the Growth Analysis and Analysis of Incidence
| Patients With a pNET Included in the Growth Analysis (n = 99) | Patients With a pNET Included in the Incidence Analysis (n = 119) | |
|---|---|---|
| Gender, n (%) | ||
| Male | 42 (42) | 53 (45) |
| Female | 57 (56) | 66 (55) |
| Age (mean ±SD) at | ||
| MEN1 diagnosis | 36 ± 16 | 37 ± 16 |
| First pNET diagnosed | 41 ± 16 | 42 ± 16 |
| End FUPa | 48 ± 15 | 46 ± 15 |
| MEN1 status, n (%) | ||
| Mutation negativeb | 3 (3) | 3 (3) |
| Mutation positive | 83 (84) | 101 (85) |
| Mutation in family | 13 (13) | 15 (13) |
| Genotype, n (%) | ||
| Nonsense/frameshift 2, 9, 10c | ||
| Yes | 30 (30) | 43 (36) |
| No | 65 (66) | 72 (61) |
| JUND interacting domaind | ||
| Yes | 33 (33) | 38 (32) |
| No | 31 (31) | 44 (37) |
| CHES1 interacting domaine | ||
| Yes | 16 (16) | 22 (18) |
| No | 48 (48) | 60 (50) |
| Missense or nonsense/frameshiftf | ||
| Missense | 19 (19) | 25 (21) |
| Nonsense/frameshift | 45 (45) | 57 (48) |
| Other NET, n (%) | ||
| Duodenal | 11 (11) | 12 (10) |
| Gastric | 5 (5) | 7 (6) |
| Thymus | 0 (0) | 3 (3) |
| Lung | 19 (19) | 24 (20) |
| Size median, mm (IQR) | Not applicable | |
| Largest tumor | 14 (9–18) | |
| Largest tumor in analysis | 13.2 (9–17) | |
| Largest tumor outside analysis | 11.0 (7.2–16.5) | |
| Functional dpNET,g n (%) | ||
| Insulinoma | 6 (6) | 6 (5) |
| Gastrinoma | 21 (21) | 28 (24) |
| Pancreatic surgery, n (%) | 29 (39) | 31 (26) |
| Once | 24 | 30 |
| Twice | 5 | 1 |
| pNET-related LM, n (%) | 3 (3) | 10 (8) |
| pNET-related mortality, n (%) | 0 | 7 (6) |
| FUP in y, median (IQR) | 13 (7–23) | 11 (6–20) |
Abbreviations: dpNET, duodenopancreatic neuroendocrine tumor; FUP, follow-up; LM, liver metastases.
If alive at the end of follow-up.
Patients who had two out of three main MEN1 manifestations but negative mutation analysis.
All mutations included. Genotype dichotomized to nonsense and frameshift mutations in exons 2, 9, and 10 vs other mutations.
Only patients with germline nonsense, frameshift, and missense mutations included. JUND interacting domain: codons 1–40, 139–242, and 323–428.
Only patients with germline nonsense, frameshift, and missense mutations included. CHES1 interacting domain: codons 428–610.
Only patients with germline nonsense, frameshift, and missense mutations included.
Prevalence of functional tumors among these patients; functional tumors were not included in the analysis of tumor size. So the tumor included in the growth analysis of these patients was a NF tumor.
Growth of NF-pNETs <2 cm
The baseline size of the 115 included tumors was 10 ± 4 mm, and the tumors were followed up to a maximum of 16 years (median follow-up 3 years with a median number of four scans). Tumor characteristics are shown in Table 2.
Characteristics of NF-pNETs <2 cm Included in the Growth Analysis (115 Tumors From 99 Patients
| No. (%) (n = 115) | |
|---|---|
| Location, n (%) | |
| Head | 40 (35) |
| Body-tail | 75 (65) |
| Baseline size mm, mean (±SD) | 10 (±4) |
| Newly diagnosed tumor, n (%) | |
| Yes (negative scans before detection) | 62 (54) |
| No (first scan positive) | 53 (46) |
| FUP in y, median (IQR) | |
| Of the tumor in the analysis | 3 (2–6) |
| After the first scan, including FUP after analysis of size | 5 (3–8) |
| Number of size measurements, median (IQR) | 4 (3–6) |
| 2 measurements, n (%) | 20 (17) |
| 3–5 measurements, n (%) | 62 (54) |
| ≥6 measurements, n (%) | 33 (38) |
| Surgery of the tumor, n (%) | 16 (14) |
| Size largest tumor at pathology in mm, median (IQR) | 17 (14–27) |
| WHO 1/WHO 2/WHO 3, n | 12/4/0 |
| LN metastases, no/yes/NA, n | 2/4/10 |
| Use of SSAs during analysis, n (%) | 18 (16) |
| Age in y (mean ± SD) | |
| First measurement | 43 ± 16 |
| Last measurement | 47 ± 15 |
| Biochemical gastrinoma present, n (%) | 16 (14) |
Abbreviations: FUP, follow-up; LN, lymph node; NA, not available; WHO, World Health Organization.
Overall, a linear relation between time and tumor size was the best fit and most representative for the outcomes of tumor growth over time. From 13 years follow-up onwards, a third order polynomial (growth at the start, followed by a stable period and a second period of growth) seemed to be a better fit. However, this relation was based only on the three tumors with the longest follow-up [see Fig. 2(a)].
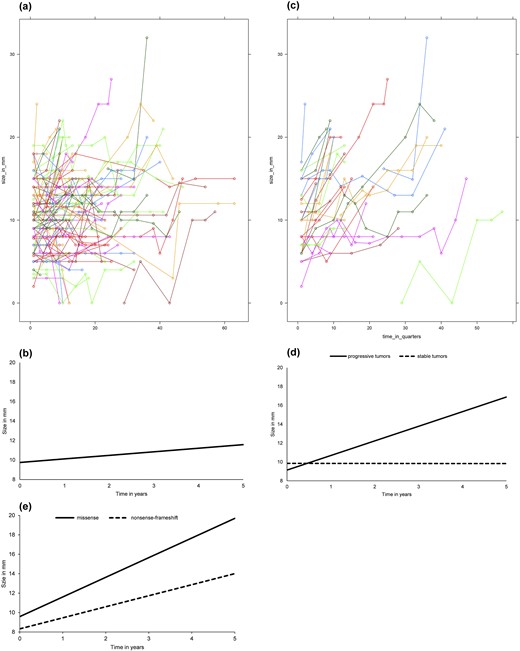
(a) Spaghetti plot: size of NF-pNETs <2 cm over time. (b) Modeled growth of NF-pNETs <2 cm. Growth curve NF-pNETs <2 cm. Coefficients derived from linear mixed models analysis. Mathematic representation of the model: tumor size in mm = 9.7 + (0.37 * time in years). (c) Spaghetti plot: size of progressive NF-pNETs <2 cm over time. (d) Modeled growth of progressive NF-pNETs <2 cm. Growth curve of progressive vs stable NF-pNETs <20 mm. Coefficients derived from mixed models analysis. Mathematic representation of the model: Progressive: tumor size in mm = 9.1 + (1.55 * time in years). Stable: tumor size in mm = 9.9 + (−0.01 * time in years). (e) Modeled growth of progressive NF-pNETs <20 mm stratified by genotype. Growth curve of progressive NF-pNETs <2 cm stratified by genotype. Coefficients derived from mixed models analysis. P-value for interaction 0.09. Mathematical representation of the model: Missense: tumor size in mm = 9.6 + (2.02 * time in years). Nonsense/frameshift: tumor size in mm = 8.3 + (1.14 * time in years).
The growth curves of the individual pNETs are shown in Fig. 2(a), and modeled growth is shown in Fig. 2(b). In the total group, the estimated growth was very slow; less than 1 mm per year (0.4 mm/y; 95% CI, 0.15 to 0.59; P = 0.002) [Fig. 2(b)]. None of the assessed effect modifiers was associated with growth rate (Table 3).
Results of the Growth Analysis of NF-pNETs <2 cm
| All Tumors (n = 115) | Progressive Tumors (n = 35) | Stable Tumors (n = 80) | |
|---|---|---|---|
| Growth, mm/quarter (95% CI) | 0.09 (0.04 to 0.15) P = 0.002 | 0.39 (0.28 to 0.49) P < 0.001 | −0.001 (−0.03 to 0.03) P = 0.9 |
| Effect modifiers (P-value for interaction) | Not tested. | ||
| Gender | P = 0.7 | P = 0.8 | |
| Male, β (SE, 95% CI) | 0.08 (0.04, 0.01 to 0.16) | 0.37 (0.08, 0.21 to 0.54) | |
| Female, β (SE, 95% CI) | 0.11 (0.04, 0.02 to 0.19) | 0.40 (0.07, 0.26 to 0.54) | |
| Age | P = 0.7 | P = 0.4 | |
| < median, β (SE, 95% CI) | 0.08 (0.04, 0.01 to 0.16) | 0.35 (0.07, 0.21 to 0.49) | |
| ≥ median, β (SE, 95% CI) | 0.11 (0.04, 0.02 to 0.19) | 0.43 (0.08, 0.27 to 0.59) | |
| Presence of biochemical gastrinoma | P = 1 | Model failed to converge | |
| Yes, β (SE, 95% CI) | 0.09 (0.08, −0.08 to 0.25) | — | |
| No, β (SE, 95% CI) | 0.09 (0.03, 0.03 to 0.15) | — | |
| Newly diagnosed tumor | P = 0.8 | P = 0.7 | |
| Yes, β (SE, 95% CI) | 0.10 (0.04, 0.02 to 0.18) | 0.40 (0.07, 0.26 to 0.54) | |
| No, β (SE, 95% CI) | 0.09 (0.04, 0.00 to 0.17) | 0.37 (0.08, 0.20 to 0.53) | |
| SSA | P = 0.4 | P = 0.4 | |
| Yes, β (SE, 95% CI) | NA | NA | |
| No, β (SE, 95% CI) | NA | NA | |
| Genotype missense vs nonsense/frameshifta | P = 0.2 | P = 0.09 | |
| Missense, β (SE, 95% CI) | 0.19 (0.07, 0.04 to 0.34) | 0.51 (0.11, 0.28 to 0.73) | |
| Nonsense/frameshift, β (SE, 95% CI) | 0.08 (0.04, −0.00 to 0.16) | 0.28 (0.05, 0.16 to 0.40) | |
| Nonsense/frameshift exons 2, 9, and 10b | P = 0.4 | P = 0.02 | |
| Yes, β (SE, 95% CI) | 0.12 (0.05, 0.02 to 0.21) | 0.24 (0.06, 0.10 to 0.38) | |
| No, β (SE, 95% CI) | 0.07 (0.03, 0.00 to 0.14) | 0.48 (0.07, 0.34 to 0.61) | |
| JUND interacting domainc | P = 0.6 | P = 0.2 | |
| Yes, β (SE, 95% CI) | 0.12 (0.05, 0.02 to 0.22) | 0.42 (0.08, 0.26 to 0.59) | |
| No, β (SE, 95% CI) | 0.08 (0.05, −0.02 to 0.19) | 0.27 (0.07, 0.12 to 0.42) | |
| CHES1 interacting domaind | P = 0.9 | P = 0.08 | |
| Yes, β (SE, 95% CI) | 0.12 (0.07, −0.03 to 0.26) | 0.22 (0.08, 0.05 to 0.39) | |
| No, β (SE, 95% CI) | 0.10 (0.04, 0.02 to 0.18) | 0.41 (0.06, 0.27 to 0.54) |
β stands for the coefficient from the linear mixed models analysis, denoting growth in mm/quarter.
Abbreviation: SE, standard error.
Only patients with germline nonsense, frameshift, and missense mutations included.
All mutations included. Genotype dichotomized to nonsense and frameshift mutations in exons 2, 9, and 10 vs other mutations.
Only patients with germline nonsense, frameshift, and missense mutations included. JUND interacting domain: codons 1–40, 139–242, and 323–428.
Only patients with germline nonsense, frameshift, and missense mutations included. CHES1 interacting domain: codons 428–610.
Of the 115 included tumors, 35 tumors of 34 patients were progressive vs 80 stable tumors in 65 patients. From the 16 patients of whom two tumors were analyzed, eight patients had one progressive and one stable tumor, seven patients two stable tumors, and one patient two progressive tumors. Neither tumor characteristics (Table 4) nor patient characteristics (data not shown) differed between stable and progressive tumors.
Characteristics of Progressive vs Stable NF-pNETs <2 cm
| Progressive Tumors (n = 35) | Stable Tumors (n = 80) | P | |
|---|---|---|---|
| Location, n (%) | 0.29 | ||
| Head | 15 (43) | 25(31) | |
| Body-tail | 20 (57) | 55 (69) | |
| Stable tumor also, n (%) | 8 (24) | — | |
| Baseline size mm, mean (±SD) | 9.9 (3.9) | 10.1 (4.1) | 0.80 |
| n of size measurements, median (IQR) | 4 (3–6) | 4 (3–6) | 0.86 |
| Germline mutation, n | |||
| Nonsense/frameshift exons 2, 9, 10, yes/no | 12/20 | 22/57 | 0.37 |
| JUND interacting domain, yes/no | 12/11 | 26/24 | 1 |
| CHES1 interacting domain, yes/no | 7/16 | 10/40 | 0.38 |
| Missense | nonsense/frameshift | 7/16 | 14/36 | 1 |
| Presence of biochemical gastrinoma, n (%) | 3 (9) | 12 (15) | 0.55 |
| FUP analysis, median (IQR) | 3 (2–6) | 4 (2–6) | 0.75 |
| FUP patient after t1, median (IQR) | 5 (3–8) | 5.5 (3–8) | 0.95 |
| Tumor surgically removed, n (%) | 10 (29) | 6 (8) | 0.01 |
| Age y, mean (±SD) | |||
| First measurement | 41 (±15) | 44 (±16) | 0.34 |
| Last measurement | 45 (±15) | 48 (±15) | 0.25 |
Abbreviation: FUP, follow-up.
Growth curves of the individual progressive pNETs are shown in Fig. 2(c), and modeled growth is shown in Fig. 2(d). Even in progressive tumors, growth was only 1.6 mm/y (95% CI, 1.1 to 2.0; P < 0.001). Stable tumors did not show any growth during follow-up (estimated tumor increase, −0.01; 95% CI, −0.12 to 0.11; P = 0.9).
In the subgroup of progressive tumors, genotype was a significant effect modifier for growth (Table 3). Unexpectedly, growth rate was faster in tumors with germline missense mutations [Table 3; Fig. 2(e)] compared with nonsense/frameshift mutations.
Associations with previously reported genotype–phenotype associations are shown in Table 3. No effect modification was seen for the other factors assessed in the progressive tumors (Table 3).
Adverse events in NF-pNETs <2 cm
Three patients developed pNET-related liver metastases (Table 1). In one case, apart from the small NF-pNET (stable in size and not surgically removed), no other NETs were present, making this the most likely source of the liver metastases. In the other two cases, there was a concomitant tumor >2 cm in the pancreatic body-tail and a previously removed tumor >2 cm at baseline, respectively, which could also have been the source of the liver metastases. There was no disease-related mortality after a median follow-up of 5 years after the first scan (IQR, 3 to 8 years).
Incidence of new pancreatic tumors
Incidence of new tumors was low, with a rate ratio of 1.04 per year. In most patients, the number of pancreatic tumors remained stable, and progression was seen in 36 patients (30%). There was no association between growth of individual tumors and an increasing number of tumors (Fisher’s exact test; P = 1).
Discussion
In this longitudinal cohort study, we have shown that most MEN1-related small pNETs (<2 cm) were stable during long-term follow-up. There was a subgroup of tumors that were progressive in size, substantiating the current notion that there may be distinct subtypes of NF-pNETs (9). In this subgroup, we found that genotype was associated with growth rate.
Strengths and limitations
This study represents the largest long-term follow-up study of small NF-pNETs in patients with MEN1. The DMSG MEN1 database includes >90% of the Dutch MEN1 patients population, reducing the chance of selection bias confounding results (13). Data were collected per quarter according to a predefined protocol that was based on study questions formulated and agreed upon before the start of data collection, enabling reliable modeling of tumor size and minimizing incidental findings. Genotype–phenotype correlations were tested based on predicted effects on the MENIN protein and for those correlations previously reported, minimizing the risk of findings by multiple testing based on chance alone.
In this retrospective analysis, imaging studies were performed at the discretion of the treating physician, and evaluation of scans was therefore not standardized. However, Dutch university medical centers are national referral centers for patients with MEN1, as well as for patients with pancreatic tumors, so CTs and MRIs were assessed by senior radiologists experienced in pancreatic imaging. The diagnosis of a pNET was pathologically confirmed in approximately 50%; in the other cases, the diagnosis was made based on radiological imaging. Because stringent criteria for the diagnosis were used (consecutively identified pNET) and sensitivity and specificity of CT (73% and 96%, respectively) and MRI (93% and 88%, respectively) are high, we are confident that the nonhistologically confirmed cases represent true pNETs (13, 22).
Because we aimed to analyze the natural course, patients who underwent less than two scans were excluded. Exclusion of tumors (size analysis) or patients (incidence analysis) that could not be followed because of surgical resection might have led to bias. However, because our focus was on NF-pNETs <2 cm and especially larger tumors are resected in daily clinical practice, we do not believe this is a major concern. On the other hand, one might argue that only very small tumors were included, which might have influenced the results. However, given median tumor size was 10 mm, half of the tumors was between 1 and 2 cm per definition.
Because the subgroup of patients with progressive tumors is small, results should be interpreted with caution, because not all effect modifiers might be detectable. To assess the effect of mutations in the JUND and CHES1 interacting domain and missense vs nonsense/frameshift mutations on growth rate, only tumors with germline missense, nonsense, or frameshift mutations were included, which might have led to a selection of patients.
Comparison with previous literature
In contrast to the few other small studies reporting on growth rate of NF-pNETs in MEN1, we used CT/MRI as the basis for size evaluation instead of endoscopic ultrasound (EUS). In the previous EUS studies, the reported growth rates were more concurrent with the modeled growth from progressive tumors in our study than with the growth rate of the total group of tumors, underscoring the fact that patients assessed by EUS might represent a selected group of patients (23–26). A more recent EUS study on the growth of small pNETs, in which some patients of the current study were also included, showed a slower growth rate compared with our study (annual growth rate of 0.1 mm/y; 95% CI, 0.02 to 0.19), which might be due to their smaller baseline size (median 5 mm) (27).
Our results confirm the recently published results of the French Groupe d'étude des tumeurs endocrines, in which 28 of the 39 patients with small NF-pNETs who did not undergo surgery showed stable disease over an average follow-up of 10 years (28).
Because of our long-term follow-up and high data density, we were able to asses tumor development over time by multilevel analysis, obtain a model of tumor growth, and assess determinants of growth, which had not been undertaken in other studies.
In the current study, we show that in the subgroup of patients with growing tumors, growth rate is correlated with MEN1 genotype. In this subgroup, missense mutations were associated with a higher growth rate than nonsense/frameshift mutations. Furthermore, nonsense/frameshift mutations in exons 2, 9, 10 and mutations in the CHES1 interacting domain were associated with slower growth. The latter can be explained by the absence of missense mutations in these subgroups (in the first subgroup by definition; in the second subgroup no missense mutations were present in our cohort). The results contradicted our assumption that in patients with missense mutations a milder phenotype might be seen, because some functioning MENIN is still present (19). However, we did observe that the prevalence of a pNET was lower in patients with missense mutations when compared with patients with nonsense/frameshift mutations. Genotype was not statistically different between patients with growing vs stable tumors. Tumor growth was not associated with increase in tumor numbers, and there were patients with both stable and growing tumors. We therefore speculate that in the multistep process of MEN1 pNET development, tumor initiation and subsequent tumor growth represent distinct steps. In this multistep tumorigenesis process, tumor initiation may be driven by the severity of the effect of the MEN1 germline mutation on the MENIN protein. However, for growth and progression additional genetic changes could take over as driving factors, and the severity of MEN1 mutations may be inversely correlated with tumor growth. In larger tumors, mutations in the DAXX and ATRX genes might constitute these growth-driving events. De Wilde et al. (29) showed that DAXX and ATRX expression was lost in 25% of MEN1-related pNETs larger than 3 cm, but in none of the pNETs less than 3 cm and none of the microadenomas. Thus, it could be that in the setting of growth and progression of MEN1-related pNETs the absence of the MENIN protein is a factor associated with a milder natural course. In previous studies nonsense/frameshift mutations in exons 2, 9, and 10 were reported to be associated with a more aggressive pNET phenotype in a small series that included mostly functional tumors, but also with fewer recurrences after minimal invasive parathyroid surgery (18, 30). More recently mutations in the CHES1 interacting domain were found to be associated with a more aggressive pNET phenotype also in a mixed group of tumors (20). These reports may seem contradictory to the present findings but could also reflect many tissue-specific and growth stage-specific aspects of the role of the MEN1 gene in tumor development.
Clinical implications
The current MEN1 guidelines recommend imaging studies once a year, whereas the recently updated ENETS guidelines recommend follow-up every 3 to 12 months in sporadic NF-pNETs <2 cm (9, 31). Taking into account the slow growth rate of MEN1-related NF-pNETs <2 cm and the low number of adverse events, one might consider a less frequent radiological surveillance schedule for these tumors, for example every 2 to 3 years, possibly with the exception of patients carrying MEN1 missense mutations. At the moment, no known clinical characteristics can predict the growth of individual tumors, which hampers tailored patient care.
The slow growth of MEN1-related NF-pNETs as shown in the current study, combined with the fact that recent studies in independent cohorts show that surgery is not beneficial for NF-pNETs <2 cm, leads to the conclusion that from now on, surgery should not be standard treatment for MEN1-related NF-pNETs <2 cm. (23–28, 32).
More than 40% of the sporadic pNETs harbor MEN1 mutations (11). Aberrant MENIN expression seems to be an early event in tumorigenesis of sporadic pNETs (33), whereas (as in MEN1-related pNETs) loss of ATRX/DAXX seem to be relatively late events (29, 33). Therefore, at least a subset of sporadic pNETs share some genetic changes with MEN1-related pNETs, making data generated in MEN1-related pNETs relevant for this group as well. Although care should be taken in extrapolating hypotheses based on data of MEN1-related NF-pNETs to sporadic pNETs, it is interesting to note that, in a small series of sporadic NF-pNETs used for exome sequencing, tumors harboring mostly inactivating MEN1 gene mutations showed a trend toward less aggressive behavior compared with patients with tumors without MEN1 mutations (11). This is in line with our thought that the absence of MENIN could be beneficial in later stages of tumorigenesis.
Treatment decisions regarding small NF-pNETs in MEN1 are currently based on “simple” clinical characteristics, such as tumor size and growth, which do not seem sufficient. Future research should therefore focus on finding driving factors for growth of MEN1-related pNETs, as well as factors identifying patients at risk for future liver metastases to enable personalized cancer care. The results of our study underscore the previously recognized need of circulating multianalyte biomarkers and the clinical use of microRNA and circulating tumors cells that would allow for accurate characterization of the evolution of these tumors (34).
Conclusion
In general, small NF-pNETs in MEN1 have a slow growth rate, and most tumors remain stable over time. Liver metastases were identified in only 1% of the patients after a median follow-up of 5 years. Thirty percent of the tumors were growing, but clinical and genetic characteristics cannot distinguish these tumors from stable tumors. Patients with MEN1 missense germline mutations had faster growing tumors. A more intensive imaging regimen may be appropriate for such patients. Results of our study suggests that genetic or epigenetic events additional to the MEN1 germline mutation are required for progression of pNETs. Future studies should be aimed at identifying these driving events as this could result in the development of novel biomarkers for the follow-up and management of these tumors.
Abbreviations
- CI
confidence interval
- CT
computed tomography
- DMSG
DutchMEN1 Study Group
- EUS
endoscopic ultrasound
- IQR
interquartile range
- MEN1
multiple endocrine neoplasia type 1
- MRI
magnetic resonance imaging
- NET
neuroendocrine tumor
- NF
nonfunctional
- pNET
pancreatic neuroendocrine tumor
- SD
standard deviation
- SSA
somatostatin analog.
Acknowledgments
We are grateful to Professor Irvin Modlin for critically reading this manuscript and for his valuable suggestions for improvement.
Financial Support: This work was supported by an unrestricted grant from Ipsen Pharmaceutical (to G.D.V.) and a starting grant and database support from the Comprehensive Cancer Centre of The Netherlands (to G.D.V.).
Disclosure Summary: W.W. d.H. received honoraria from Ipsen and Novartis, has received research funds to his institution from Ipsen and Novartis, and has traveled with Ipsen and Novartis. K.M.A.D. has a consulting/advisory role with Eisai. P.H.B. has a consulting/advisory role with Ipsen. B.H. has traveled with Ipsen. G.D.V. has received research funds to his institution from Ipsen and has traveled with Ipsen. The remaining authors have nothing to disclose.
References
