


Abstract
Hypercalciuria is an adverse event of postsurgical hypoparathyroidism treatment that can lead to renal complications. The collection of 24-hour urine to detect hypercalciuria is often considered unreliable.
The purpose of this study was to find useful predictive biomarkers of hypercalciuria in patients with permanent postsurgical hypoparathyroidism receiving treatment with oral calcium and calcitriol supplements.
The investigation was designed as a prospective cross-sectional study. An outpatient hospital clinic served as the study setting.
Fifty-four consecutive observations were made of 34 stable outpatients with postsurgical hypoparathyroidism taking oral calcium and calcitriol supplements, and 17 adult controls without hypoparathyroidism.
There were no interventions.
Hypercalciuria was defined as 24-hour urine calcium >300 mg.
Patients without hypercalciuria (n = 21) vs those with hypercalciuria (n = 33) had lower levels of serum 1,25-dihydroxyvitamin D (33.5 ± 11.9 pg/mL vs 45.8 ± 9.5 pg/mL; P < 0.001), similar albumin-corrected serum calcium (8.3 ± 0.5 vs 8.6 ± 0.5 mg/dL; P = nonsignificant), and serum parathyroid hormone (12.5 ± 5.7 vs 10.7 ± 6.8 pg/mL; P = nonsignificant). Multiple linear regression analysis showed an independent relationship between 1,25-dihydroxyvitamin D and urinary calcium excretion (B = 6.2 ± 1.423; P < 0.001). A cutoff value of 33.5 pg/mL for serum 1,25-dihydroxyvitamin D to predict the absence of hypercalciuria had 100% sensitivity and 63.6% specificity, and the area under the receiver operating characteristic curve was 0.797. No patients with serum 1,25-dihydroxyvitamin D levels of <33.5 pg/mL presented with hypercalciuria, regardless of the level of albumin-corrected serum calcium.
Routine measurement of serum 1,25-dihydroxyvitamin D may be useful as a biomarker to predict the absence of hypercalciuria in patients with permanent postsurgical hypoparathyroidism who are receiving treatment with oral calcium and calcitriol supplements.
Postsurgical hypoparathyroidism is the most common form of hypoparathyroidism (1–5). The normalization of serum calcium levels in patients with hypoparathyroidism is usually achieved by using calcium and vitamin D supplements, commonly in the form of calcitriol (2–7). However, the optimal management of hypocalcemia has not been investigated in clinical trials, and treatment is based largely on accepted conventional practice (8). In addition to controlling symptoms, the goals of therapy in patients with hypoparathyroidism are to maintain an albumin-corrected serum calcium level in the low-normal range or slightly below the lower limit of the reference range (∼8.0 to 8.5 mg/dL), a calcium-phosphate product of <55 mg2/dL2, and a 24-hour urinary calcium level of <300 mg (2–5, 7, 9, 10).
Excessive urinary calcium excretion is a drawback of treatment with calcium and vitamin D supplements in patients with hypoparathyroidism (2, 3, 5, 7, 10). Chronic hypercalciuria may lead to calcium-containing urolithiasis, nephrocalcinosis, and impaired renal function (3, 5–7). Monitoring and optimization of therapy to preserve renal function have been considered to be of critical importance for patients with hypoparathyroidism (3, 7). Traditionally, to monitor hypercalciuria, twice-yearly measurement of 24-hour urinary calcium is recommended in patients with hypoparathyroidism, once the treatment has been stabilized (2, 5, 9, 10). However, 24-hour urine collection is often unreliable because of volume omissions. As is well known, the 24-hour urine may not all be collected because the patient finds collection inconvenient (11, 12). Moreover, 24-hour urine collection is unpopular with both patients and laboratory staff, especially if it needs to be performed twice yearly on a regular basis (13). It has been reported that the compliance rate for 24-hour urine collection may be as low as 44% for patients with hypoparathyroidism with a follow-up of 7.4 ± 5.1 years (3).
To our knowledge, no clinical studies in recent years have been specifically aimed at evaluating which factors are related to the presence of hypercalciuria in patients with hypoparathyroidism who are receiving supplemental treatment. At the same time, it has become common for patients with hypoparathyroidism to be treated with both calcitriol (1,25-dihydroxyvitamin D) and cholecalciferol (vitamin D3) supplements when pills containing fixed doses of calcium and cholecalciferol are prescribed as treatment. However, at the present time, we can routinely measure serum metabolites such as calcidiol, calcitriol, and parathyroid hormone (PTH) to analyze their influence on hypercalciuria. Thus, it is possible to gain new insights into the best means of managing supplemental treatment to avoid hypercalciuria and its potentially deleterious effects on the kidneys.
The aim of this study was to find biomarkers that could be useful for predicting hypercalciuria in patients with permanent postsurgical hypoparathyroidism whose condition has been stabilized with oral calcium and calcitriol, with or without other vitamin D supplements.
Materials and Methods
Over a period of 18 months (November 2014 to May 2016), 34 consecutive stable outpatients with permanent postsurgical hypoparathyroidism after a total thyroidectomy that was performed because of benign (n = 15) or malignant (n = 19) thyroid conditions were enrolled in this study. Data on the variables included in the study were collected at 1 observation time point for all 34 patients. Data were collected at a second observation time point for 16 patients, and at a third observation time point for 4 patients; the doses of calcitriol and/or calcium supplements were modified at each observation point for patients who underwent second and third observations. All patients had achieved a stable condition for at least 3 months prior to data collection at every observation time point. Therefore, a total of 54 observations were included for analysis. All patients with malignancy were in complete remission at the time of the study. The control group consisted of 17 adults with postsurgical hypothyroidism, without hypoparathyroidism, who were enrolled more than 1 year after undergoing thyroidectomy. The study was reviewed and approved by the ethics committee of the Hospital Universitari Mútua de Terrassa. Written informed consent was obtained from all patients.
Hypoparathyroidism was confirmed in all patients by low serum levels (usually <15 pg/mL) of intact PTH during hypocalcemia (albumin-corrected serum calcium levels of <8 mg/dL) 24 to 48 hours after total thyroidectomy. Hypoparathyroidism was permanent, given that all patients showed undetectable or subnormal serum PTH concentrations (usually <15 pg/mL in the absence of raised serum calcium levels) and required calcium supplements with calcitriol to achieve albumin-corrected serum calcium levels >8 mg/dL for more than 1 year after thyroidectomy was performed (2, 4, 14–16).
The patients took oral calcium and oral vitamin D supplements. They were all receiving calcitriol treatment, and in addition, 18 patients were also treated with vitamin D3 supplements that were added in fixed doses to the calcium supplements. No patient was receiving parathyroid hormone treatment, had renal insufficiency, or was treated with other drugs that could have interfered with calcium homeostasis, such as thiazide or loop diuretics, glucocorticoids, antiresorptive drugs, antiepileptic drugs, or lithium (5). In a food survey, we quantified the level of calcium intake by taking an average of the calcium intake on 3 different days per week, using a food composition table (17).
The primary end point was 24-hour urine calcium excretion, which was measured in a single urine sample. In considering whether a patient had hypercalciuria, a threshold of 300 mg for 24-hour urine calcium excretion was applied (2, 4, 9, 18). Emphasis was placed on the importance of patients providing complete 24-hour urine specimens. The reliability of the urine specimens collected was tested by measuring urine creatinine. For each age and sex group, the values were considered suitable if they were within the mean ± 2 standard deviations of values for subjects with normal renal function, as previously reported (19). Using this criterion, 4 urine collections were rejected because of low levels of creatinine, and the patients were asked to provide more reliable 24-hour urine specimens in the following weeks.
The variables recorded to analyze their influence on 24-hour urine calcium excretion included the following: patient's age and sex, time from hypoparathyroidism occurrence, current weight, size, body mass index (BMI), and dietary calcium intake; treatment-conditioning factors, including daily doses of calcium supplements and vitamin D3 supplements, daily dose of calcitriol, last dose of calcitriol before the blood draw, time interval between the last intake of calcitriol and the blood draw, and doses of thyroxine treatment; serum analytic variables, including calcium, albumin, phosphorus, magnesium, creatinine, thyrotropin, free thyroxine, PTH, 25-hydroxivitamin D, and 1,25-dihydroxyvitamin D (blood was drawn after an 8-hour fasting period); and urine analytic variables (24-hour creatinine excretion).
Creatinine clearance was estimated as [urine creatinine (mg/dL) × urine volume (mL)]/[serum creatinine (mg/dL) × 1440]. Albumin-corrected serum calcium was calculated as follows: serum calcium (mg/dL) + [(4 − albumin [g/dL]) × 0.8].
Serum calcium was measured by the 5-nitro-5′-methyl-BAPTA method. Urine calcium was measured by the ortho-cresolphthalein complexone method. Serum albumin was measured by the bromocresol green method, and serum 25-hydroxivitamin D and intact PTH were determined using electrochemiluminescence immunoassay. Serum 1,25-dihydroxyvitamin D was determined by radioimmunoassay (125I RIA Kit, DiaSorin, Stillwater, MN; coefficient of variation intra-assay, 7.2%; coefficient of variation interassay, 12.8%). The reference values were 8.6 to 10.0 mg/dL for serum calcium, 15.2 to 65.7 pg/mL for PTH, and 25 to 66 pg/mL for serum 1,25-dihydroxyvitamin D.
The normality of the continuous variables was determined by the Kolmogorov-Smirnov test. Continuous variables that could influence the presence of hypercalciuria were investigated with Student t test, and categorical variables with χ2 test. Differences in the means of variables after modifications in treatment were explored with the Wilcoxon test for paired data. Statistical relationships between quantitative variables were investigated with Pearson’s correlation coefficient and linear multiple regression analysis (stepwise method). Receiver operating characteristic (ROC) curves were generated to examine the power of variables to discriminate between patients with and without hypercalciuria. Areas under the ROC curves were compared using the Hanley and McNeil statistical method (20). Statistical significance was set at P < 0.05 (two-tailed). Statistical analysis was performed with EpiData software, version 3.1 (Epidat software, version 3.1, Servizo Galego de Saúde, Galicia, Spain).
Results
A summary of patient data, treatment, and analytic results is displayed in Table 1. No patient had hypercalcemia, and all patients had a calcium-phosphorus product below 55 mg2/dL2. As expected, of the variables compared between controls and patients, only those that were related to the hypoparathyroid condition showed significant differences (calcium supplements, calcitriol dosage, albumin-corrected serum calcium, serum PTH, and urinary calcium excretion). Otherwise, comparing patients with and without hypercalciuria, the latter were older and had a higher BMI, longer evolution of hypoparathyroidism, and lower levels of serum 1,25-dihydroxyvitamin D. Interestingly, the serum PTH levels of patients with and without hypercalciuria were similar.
Baseline Characteristics of Controls and Patients, Their Treatment, and Serum and Urine Analytic Parameters
| Controls | Patients | Pa | Patients With Hypercalciuria | Patients Without Hypercalciuria | Pb | |
|---|---|---|---|---|---|---|
| Number | 17 | 54 | 21 | 33 | ||
| Age (y) | 57 ± 13.2 | 52 ± 15.3 | ns | 45 ± 15.9 | 56 ± 13.5 | 0.011 |
| Sex (female/male) | 16/1 | 39/15 | ns | 14/7 | 25/8 | ns |
| Weight (kg) | 73.8 ± 19.1 | 75.5 ± 13.7 | ns | 72.1 ± 9.1 | 77.7 ± 15.7 | ns |
| BMI (kg/m2) | 30.13 ± 9.60 | 28.57 ± 6.96 | ns | 25.45 ± 3.60 | 30.55 ± 7.85 | 0.007 |
| Duration of hypoparathyroidism (mo) | N/A | 93.3 ± 89.5 | 63 ± 61.4 | 112.5 ± 99.7 | 0.028 | |
| Average dietary calcium intake (mg/d) | 597 ± 204 | 613 ± 236 | ns | 636 ± 191 | 598 ± 262 | ns |
| Treatment | ||||||
| Calcium supplements (mg/d) | 705 ± 751 | 1422 ± 752 | < 0.001 | 1542 ± 754 | 1345 ± 751 | ns |
| Vitamin D3 supplements (U/d) | 470 ± 640 | 854 ± 899 | ns | 948 ± 715 | 794 ± 1005 | ns |
| Calcitriol (μg/day) | 0 | 0.54 ± 0.64 | < 0.001 | 0.51 ± 0.21 | 0.56 ± 0.81 | ns |
| Last dose of calcitriol (μg) | N/A | 0.29 ± 0.11 | 0.27 ± 0.11 | 0.30 ± 0.10 | ns | |
| Time interval (h)b | N/A | 14.9 ± 5.8 | 14.2 ± 5.7 | 15.3 ± 5.9 | ns | |
| Thyroxine (μg/d) | 118 ± 38 | 126 ± 26 | ns | 127 ± 26 | 126 ± 26 | ns |
| Serum analytic variables | ||||||
| Calcium (mg/dL) | 9.1 ± 0.6 | 8.9 ± 0.5 | ns | 9 ± 0.6 | 8.8 ± 0.4 | 0.07 |
| Albumin (g/dL) | 4.4 ± 0.4 | 4.5 ± 0.2 | ns | 4.5 ± 0.3 | 4.5 ± 0.2 | ns |
| Albumin-corrected serum calcium (mg/dL) | 8.7 ± 0.5 | 8.5 ± 0.5 | < 0.05 | 8.6 ± 0.5 | 8.3 ± 0.5 | 0.06 |
| Phosphorus (mg/dL) | 3.7 ± 0.7 | 4 ± 0.6 | 0.065 | 3.9 ± 0.8 | 4.1 ± 0.5 | ns |
| Calcium-phosphorus product (mg2/dL2) | 33.7 ± 5.1 | 36.1 ± 5.9 | ns | 36.2 ± 8 | 36.1 ± 4.2 | ns |
| Magnesium (mg/dL) | 2.05 ± 0.18 | 1.98 ± 0.19 | ns | 1.92 ± 0.17 | 2.02 ± 0.2 | 0.06 |
| Creatinine (mg/dL) | 0.74 ± 0.18 | 0.77 ± 0.12 | ns | 0.78 ± 0.14 | 0.77 ± 0.12 | ns |
| Thyrotropin (mU/L) | 1.8 ± 3.2 | 2.9 ± 4.5 | ns | 2.4 ± 3.07 | 3.2 ± 5.3 | ns |
| Free thyroxine (ng/mL) | 1.61 ± 0.33 | 1.56 ± 0.29 | ns | 1.60 ± 0.35 | 1.54 ± 0.25 | ns |
| Parathyroid hormone (pg/mL) | 37.8 ± 22.7 | 11.8 ± 6.2 | < 0.001 | 10.7 ± 6.8 | 12.5 ± 5.7 | ns |
| 25-hydroxyvitamin D (ng/mL) | 27.7 ± 9.1 | 31.7 ± 13.1 | ns | 35.4 ± 10.6 | 29.3 ± 14.1 | 0.09 |
| 1,25-dihydroxyvitamin D (pg/mL) | 39.7 ± 13.3 | 38.3 ± 12.5 | ns | 45.8 ± 9.5 | 33.5 ± 11.9 | < 0.001 |
| Urine analytic variables | ||||||
| Calcium (mg/24 h) | 160 ± 91 | 284 ± 157 | 0.003 | 417 ± 167 | 199 ± 66 | < 0.001 |
| Creatinine (mg/24 h) | 1035 ± 308 | 1196 ± 393 | ns | 1324 ± 359 | 1113 ± 397 | 0.055 |
| Other | ||||||
| Creatinine clearance (mL/min) | 99.53 ± 28.51 | 108.67 ± 34.93 | ns | 118.54 ± 27.50 | 102.19 ± 38.07 | 0.096 |
Values for variables are expressed as mean ± standard deviation or number when appropriate.
Abbreviations: N/A, not applicable; ns, nonsignificant.
a Comparisons were made (a) between controls and patients, and (b) between patients with hypercalciuria and patients without hypercalciuria.
b Between the last dose of calcitriol and the blood draw.
In the patient group, urinary calcium excretion correlated significantly with the BMI (r = −0.277; P = 0.043), the serum level of PTH (r = −0.323; P = 0.017), and the serum level of 1,25-dihydroxyvitamin D (r = 0.467; P < 0.001). A clear tendency was detected between urinary calcium excretion and albumin-corrected serum calcium levels, but the differences did not reach statistical significance (r = 0.265; P = 0.052). In the multiple linear regression analysis, only the serum levels of 1,25-dihydroxyvitamin D (B = 6.248 ± 1.423; 95% confidence interval [CI], 3.391 to 9.106; P < 0.001) and the serum levels of PTH (B = −9.247 ± 2.879; 95% CI, −15.028 to −3.467; P = 0.002) remained significantly associated with urinary calcium excretion.
The ROC curves for the serum level of 1,25-dihydroxyvitamin D, the serum level of PTH, and the level of albumin-corrected serum calcium, used to discriminate between patients with and without hypercalciuria, are shown in Fig. 1. Areas under the ROC curves were 0.797 (95% CI, 0.679 to 0.916) for serum 1,25-dihydroxyvitamin D, 0.600 (95% CI, 0.437 to 0.762) for serum PTH, and 0.656 (95% CI, 0.503 to 0.808) for albumin-corrected serum calcium. When these areas were compared, a nonsignificant difference was found (χ2 = 3.11; df, 2; P = 0.07). Levels of serum 1,25-dihydroxyvitamin D of <33.5 pg/mL showed 100% sensitivity with 63.6% specificity in predicting the absence of hypercalciuria.
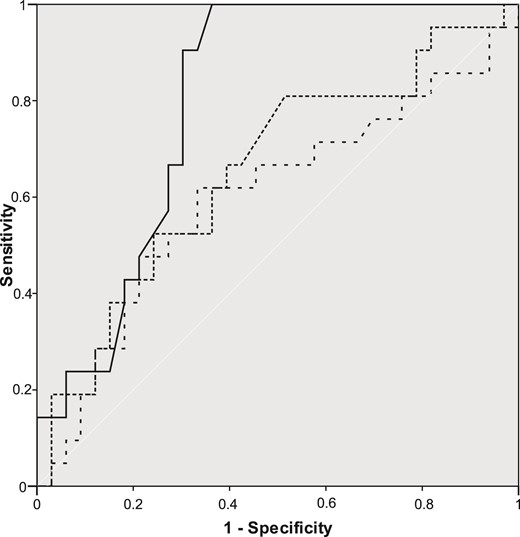
ROC curves for serum 1,25-dihydroxyvitamin D (—), albumin-corrected serum calcium (…) and serum PTH (– –) to discriminate between patients with and without hypercalciuria.
Figure 2 shows the distribution of patients on the basis of their 1,25-dihydroxyvitamin D and urine calcium serum levels. Patients have been grouped according to their levels of albumin-corrected serum calcium. No patient with a serum 1,25-dihydroxyvitamin D level of <33.5 pg/mL had hypercalciuria, regardless of the level of albumin-corrected serum calcium (<8.5 mg/dL, 8.5 to 9.5 mg/dL, or > 9.5 mg/dL).
![Distribution of patients grouped by their albumin-corrected serum calcium [<8.5 mg/dL (□); between 8.5 and 9.5 mg/dL (●); >9.5 mg/dL (○)], depending on their level of serum 1,25-dihydroxyvitamin D and urine calcium. The vertical line intersects with the x-axis at 33.5 pg/mL.](https://oup.silverchair-cdn.com/oup/backfile/Content_public/Journal/jcem/102/1/10.1210_jc.2016-2987/3/m_jc.2016-2987f2.jpeg?Expires=1747961209&Signature=z7fX5hTjt1YgixEmfRmJGDKhZatkq7uTcls3kqQG~L4ilC~0fAXPjSh6YZ3SBBuKlg9ciQGDHWLXUU5zLD-kMkMAHu6kYrpQSYxr3IFyHOZVKRam4WcyG1HZkOmvMfo6Ndmscpr~JjWccm-sTQQmTL231Kdm5AWiyQE-rXq6gWBGItQ-aMRKWqqr04z-oIXjAyIn5OGE3a349z25Ce8UO83edyK36CBcZcbuHtdupLctrmiM6UXPG1uGx7O0~28pzYMDGlWoj0clQfbI~9l5mQZgxmvGVa~zgiE~eCDhWgqNnRDf5MzyzbHJA0kUQaBgmBc8I29e2Em-N7VsgJ0jQQ__&Key-Pair-Id=APKAIE5G5CRDK6RD3PGA)
Distribution of patients grouped by their albumin-corrected serum calcium [<8.5 mg/dL (□); between 8.5 and 9.5 mg/dL (●); >9.5 mg/dL (○)], depending on their level of serum 1,25-dihydroxyvitamin D and urine calcium. The vertical line intersects with the x-axis at 33.5 pg/mL.
When comparing patients with serum 1,25-dihydroxyvitamin D levels of less than and greater than 33.5 pg/mL, serum PTH was similar in the groups (10.9 ± 5.6 pg/mL vs 12.4 ± 6.5 pg/mL; P = nonsignificant), as was albumin-corrected serum calcium (8.37 ± 0.53 mg/dL vs 8.57 ± 0.52 mg/dL; P = nonsignificant), but not 24-hour urine calcium excretion (191.4 ± 68.4 mg/24h vs 343.7 ± 169.8 mg/24 h; P < 0.001). A correlation between serum 1,25-dihydroxyvitamin D and creatinine clearance (r = 0.34; P = 0.013) was found. However, we did not find any significant relationship between serum 1,25-dihydroxyvitamin D and the doses of oral calcitriol (daily dose and last dose before the blood draw), the time interval between the last intake of calcitriol and the blood draw, age, weight, or sex.
Of 21 patients with hypercalciuria, 7 had an albumin-corrected serum calcium level of <8.5 mg/dL, and 14 had an albumin-corrected serum calcium level >8.5 mg/dL. Among the latter, 6 patients who had vitamin D3 supplements and calcitriol doses reduced without the addition of thiazide diuretics had normalized urinary calcium excretion rates and, simultaneously, their serum 1,25-dihydroxyvitamin D levels decreased to <33.5 pg/mL (Table 2).
Changes in Patients (n = 6) With Hypercalciuria and Albumin-Corrected Serum Calcium Levels Greater Than 8.5 mg/dL, Before and After Hypercalciuria Correction by Reduction of Calcitriol Doses
| Before Hypercalciuria Correction | After Hypercalciuria Correction | P | |
|---|---|---|---|
| Treatment | |||
| Calcium supplements (mg/d) | 1333 ± 983 | 1500 ± 1000 | ns |
| Vitamin D3 supplements (U/d) | 880 ± 890 | 333 ± 531 | ns |
| Calcitriol (μg/d) | 0.46 ± 0.19 | 0.33 ± 0.13 | ns |
| Thyroxine (μg/d) | 141.5 ± 22 | 139.5 ± 23 | ns |
| Serum analytic variables | |||
| Albumin-corrected serum calcium (mg/dL) | 8.80 ± 0.61 | 8.62 ± 0.29 | ns |
| Thyrotropin (mU/L) | 0.31 ± 0.23 | 0.68 ± 0.73 | ns |
| Free thyroxine (ng/mL) | 1.82 ± 0.34 | 1.71 ± 0.42 | ns |
| Parathyroid hormone (pg/mL) | 14.6 ± 7.0 | 15.9 ± 6.9 | ns |
| 25-hydroxyvitamin D (ng/mL) | 35.3 ± 17.4 | 25.4 ± 12.5 | ns |
| 1,25-dihydroxyvitamin D (pg/mL) | 45.5 ± 10.1 | 29.1 ± 7.1 | < 0.05 |
| Urine analytic variables | |||
| Calcium (mg/24 h) | 357 ± 66 | 232 ± 36 | < 0.01 |
| Creatinine (mg/24 h) | 1085 ± 182 | 1057 ± 218 | ns |
| Creatinine clearance (mL/min) | 103.74 ± 26.23 | 98.82 ± 25.08 | ns |
Abbreviation: ns, nonsignificant.
Discussion
This clinical study was performed to identify useful biomarkers related to the presence of hypercalciuria in patients with permanent postsurgical hypoparathyroidism who were receiving treatment with oral calcium and calcitriol supplements, with or without other vitamin D supplements. Serum levels of 1,25-dihydroxyvitamin D were independently related to hypercalciuria, and we found a cutoff value for this variable that allowed us to predict the absence of hypercalciuria in all cases. To the best of our knowledge, this investigation provides evidence of a reliable serum biomarker for identifying patients who are at risk for hypercalciuria after permanent postsurgical hypoparathyroidism.
A major therapeutic challenge in patients with hypoparathyroidism is the consistent effective management of the hypocalcemia while avoiding hypercalciuria and other complications. In the absence of PTH, the tubular reabsorption of calcium is reduced, and much of the absorbed calcium in the intestine is lost in urine (21). Periodic measurements of 24-hour urinary calcium excretion have been recommended for patients with hypoparathyroidism (5, 7, 9) to avoid potential renal complications if hypercalciuria occurs as a consequence of the treatment with calcium and vitamin D supplements. In the absence of other alternative reliable indicators of hypercalciuria, this procedure has been implemented despite the volume omissions in 24-hour urine collections that can produce false-negative results (11, 13, 22). In this regard, Mitchell et al. (3) reported that compliance in 24-hour urine collections was only 44%, but of those patients who successfully completed the procedure, 38% had at least 1 excessive (>300 mg) 24-hour urine calcium measurement (3).
Serum 1,25-dihydroxyvitamin D is a powerful hypercalcemic metabolite (21, 23), and its levels depend on calcitriol dosage, the time interval between the last intake of calcitriol and the blood draw, PTH residual secretion, renal integrity, serum calcium levels, and calcidiol stores (7, 12). Likewise, calcidiol is influenced by multiple factors (24). Thus, different levels of serum 1,25-dihydroxyvitamin D can be achieved among patients taking the same dosage of calcitriol supplements. In our study, the absence of a relationship between serum levels of 1,25-dihydroxyvitamin D with the last dose of calcitriol, and the time interval between the last intake of calcitriol and the blood draw, could be explained by the fact that the time required for the calcitriol to reach its peak serum concentration after administration (3 to 6 hours) (7) is approximately one-third the interval of time between the last intake of calcitriol and the blood draw (14.9 ± 5.8 hours). Our patients had serum 1,25-dihydroxyvitamin D levels of 38.3 ± 12.5 pg/mL, similar to those for the control group (39.7 ± 13.3 pg/mL). The treatment with calcitriol may have been responsible for restoring the low or low-normal levels of serum 1,25-dihydroxyvitamin D currently found in the patient with hypoparathyroidism before treatment is begun (2, 9, 10).
Our data show that patients with permanent postsurgical hypoparathyroidism receiving treatment with oral calcium and oral calcitriol supplements are at risk for hypercalciuria above a specific level of serum 1,25-dihydroxyvitamin D (33.5 pg/mL), regardless of their albumin-corrected serum calcium level. The presence of hypercalciuria with concomitant low, normal, or high levels of serum calcium has previously been observed. In the largest reported longitudinal cohort of patients with hypoparathyroidism (66% of postsurgical etiology), higher serum calcium levels were associated with higher urine calcium values. However, there was wide variability, and in 44 simultaneous urine and serum calcium measurements, 2 of 22 patients had urine calcium levels >300 mg/24 h, whereas they had serum calcium levels of <8.5 mg/dL; conversely, 17 of the remaining 22 patients had serum calcium levels above 8.5 mg/dL without hypercalciuria (3).
In our study, the level of serum 1,25-dihydroxyvitamin D was shown to be a useful independent biomarker of the absence of hypercalciuria. This test had a sensitivity of 100% with a specificity of 63.6% and an area under the ROC curve of 0.797. Values for the area under the ROC curve between 0.5 and 0.7 indicate low accuracy, values between 0.7 and 0.9 indicate that a test is useful for some purposes, and values >0.9 indicate high accuracy (25). Some diagnostic tests in medicine that are commonly used and recommended by expert panels have an area under the ROC curve between 0.7 and 0.8 (26).
One could argue that patients with hypercalciuria could be affected by idiopathic hypercalciuria. However, in our series, the available data on 6 patients who experienced hypercalciuria remission after a reduction in their oral doses of calcitriol and vitamin D3 supplements suggest that this is very unlikely (Table 2). The decrease in the doses of vitamin D3 supplements (880 ± 890 to 333 ± 531 U/d) and calcitriol (0.46 ± 0.19 to 0.33 ± 0.13 μg/d) were not statistically significant, because the low number of patients conferred a low power for detecting differences. In the case of vitamin D3 supplements, their high standard deviation adds to the difficulty in finding the differences statistically significant (27, 28). The combined reduction in vitamin D3 supplements and the dosage of calcitriol could have had an additive effect, thus resulting in a more intense decrease in 1,25-dihydroxyvitamin D serum levels (45.5 ± 10.1 to 29.1 ± 7.1 pg/mL; P < 0.05) (12).
In clinical practice, if we suspect hypercalciuria in a patient as a result of the level of 1,25-dihydroxyvitamin D, and hypercalciuria is confirmed by 24-hour urine collection, the serum level may be an indicator that the dosage of oral calcitriol supplements should be reduced to achieve a 1,25-dihydroxyvitamin D level of <33.5 pg/mL (in the absence of hypocalcemia). This could also be an indicator of the recovery of parathyroid function when applied to patients with postsurgical hypoparathyroidism that is still considered nonpermanent.
Because serum 1,25-dihydroxyvitamin D is more closely related to hypercalciuria than is albumin-corrected serum calcium, it seems reasonable to suggest that when 1,25-dihydroxyvitamin D is lower than 33.5 pg/mL, the optimal goal of therapy in patients with permanent postsurgical hypoparathyroidism receiving treatment with oral calcium and calcitriol supplements should be to achieve normal serum calcium values instead of the currently recommended low-normal levels (2, 3, 5, 7, 9, 10, 21). In addition, this approach could reduce the high frequency of visits to emergency departments as well as hospital admissions for symptomatic hypocalcemia (3).
There are some mechanisms that explain why the presence of hypercalciuria may be influenced by the level of serum 1,25-dyhidroxyvitamin D in patients with hypoparathyroidism and normal or even low fasting serum calcium levels. Calcitriol enhances the intestinal absorption of calcium through an active transport system (29). In our study, the serum level of 1,25-hydroxyvitamin D was similar in patients and controls, but the intake of calcium was superior in patients. Thus, the intestinal absorption of calcium should have been greater in the patients, in particular those with higher levels of 1,25-dyhidroxyvitamin D. Patients with low or undetectable levels of serum PTH had impaired renal reabsorption of calcium. Therefore, it follows that an increase in urinary calcium excretion occurs when larger amounts of calcium are filtered by the kidney and not reabsorbed by PTH (9, 30).
The correlation between 1,25-dihydroxyvitamin D and creatinine clearance raises the possibility of a complementary mechanism of hypercalciuria mediated by 1,25-dihydroxyvitamin D. The reabsorption of calcium in the kidney is controlled by several factors, such as the filtered load of sodium, urine flow, and the activity of several hormones, most notably PTH (31). A synthesis of the experimental results suggests that vitamin D3 metabolites affect distal tubular reabsorption of calcium via several mechanisms, and that the mechanisms are regulated directly or indirectly by 1,25-dihydroxyvitamin D and enhanced by PTH (31). The total amount of calcium filtered across the glomerulus under normal circumstances in a 24-hour period is about 8,000 mg (31, 32). Approximately 98% of the filtered load of calcium is reabsorbed in the proximal and distal tubules and the loop of Henle. In the proximal tubule, about 70% of the filtered load of calcium is reabsorbed, predominantly through the paracellular pathway, independent of PTH action (33). Volume expansion inhibits calcium reabsorption in the proximal tubule (31, 32). Likewise, shrinkage of extracellular volume has been suggested as a mechanism for reducing urinary calcium excretion by thiazide diuretics. Decreased extracellular volume leads to increased proximal calcium reabsorption (24). Thus, our finding that levels of 1,25-dihydroxyvitamin D correlated positively with creatinine clearance could explain the lessened reabsorption of calcium in the proximal tubule; this may lead to the greater availability of calcium to the thick ascending loop of Henle and the distal tubule, where, in the absence of PTH, the mechanisms implicated in the reabsorption of calcium at this level are unable to assume this calcium overload, and consequently, hypercalciuria develops.
One limitation of this study is the small number of patients recruited. The low incidence of postsurgical hypoparathyroidism (34) is the main barrier to obtaining a sizable series of patients; in most studies, even studies with more than 1000 patients who have undergone thyroidectomy, only 20 to 30 patients with hypoparathyroidism are included (4, 5, 9, 14, 15, 35, 36). Related to this, the principal statistical problem associated with a small sample size is the low power for revealing effects that are real, but this was not the case in the current study (27, 28).
In conclusion, our results suggest that measurement of serum 1,25-dihydroxyvitamin D should be included in the follow-up of patients with permanent postsurgical hypoparathyroidism. Twenty-four–hour urine calcium measurements could be limited to use for confirming hypercalciuria in patients with 1,25-dihydroxyvitamin D serum levels >33.5 pg/mL. This approach seems more reliable as well as more convenient for patients than do routine 24-hour urine collections. However, prospective studies to confirm these results are needed.
Abbreviations:
- BMI
body mass index
- CI
confidence interval
- PTH
parathyroid hormone
- ROC
receiver operating characteristic
Acknowledgments
Disclosure Summary: The authors have nothing to disclose.
References
Author notes
Address all correspondence and requests for reprints to: Luis García-Pascual, MD, Service of Endocrinology, Hospital Universitari Mútua de Terrassa, Pza. Dr. Robert, 5, 08221 Terrassa, Spain. E-mail: [email protected].
