


Abstract
Thyroglobulin (Tg) could be a sensitive biomarker of iodine nutrition in pregnant women (PW). A dried blood spot (DBS) assay would simplify collection and transport in field studies.
Our aims were to (1) establish and test a reference range for DBS-Tg in PW; (2) determine whether co-measurement of Tg antibodies (Abs) is necessary to define population iodine status.
Standardized cross-sectional studies of 3870 PW from 11 countries. For the DBS-Tg reference range, we included TgAb-negative PW (n = 599) from 3 countries with sufficient iodine intake.
We measured the urinary iodine concentration and DBS thyroid-stimulating hormone, total thyroxin, Tg, and TgAb.
In the reference population, the median DBS-Tg was 9.2 μg/L (95% confidence interval, 8.7 to 9.8 μg/L) and was not significantly different among trimesters. The reference range was 0.3 to 43.5 μg/L. Over a range of iodine intake, the Tg concentrations were U-shaped. Within countries, the median DBS-Tg and the presence of elevated DBS-Tg did not differ significantly between all PW and PW who were TgAb-negative.
A median DBS-Tg of ∼10 μg/L with <3% of values ≥44 μg/L indicated population iodine sufficiency. Concurrent measurement of TgAb did not appear necessary to assess the population iodine status.
Thyroglobulin (Tg) is a thyroid-specific protein and a storage and synthesis site for thyroid hormones (1). During iodine deficiency, an increase in thyroid size and/or activity results in an increase in the blood Tg concentration (2, 3). In children and adults, Tg might be a sensitive biomarker of iodine nutrition and responds quickly to changes in iodine intake (2–6). Tg can be measured on dried blood spots (DBSs), which could simplify collection, storage, and transport in field studies (5). DBS-Tg has been recommended by the World Health Organization (WHO) for monitoring of iodine status in school-age children (6). An international reference range has been established (4), and it might also be a sensitive biomarker of iodine excess in children (7).
DBS-Tg could also be a promising biomarker to assess iodine status in pregnant women (PW), in particular, because iodine requirements and the urinary iodine concentration (UIC) reference range for pregnancy remain uncertain. However, Tg data from PW with varying iodine intake are scarce and no international reference range is available. The available data suggest that Tg might be modestly elevated during pregnancy in both iodine-deficient and iodine-sufficient women (8, 9) owing to increased thyroid activity. Tg antibodies (TgAb) can confound the individual assessment of Tg in clinical monitoring of thyroid disorders. However, no data are available on whether co-measurement of TgAb, with Tg, is necessary in PW to define the population iodine status.
Therefore, our aims were (1) to establish, in iodine-sufficient euthyroid TgAb-negative PW, an international reference range for DBS-Tg that could be used to monitor iodine nutrition; (2) to test the DBS-Tg reference range and assess thyroid function in PW over the range of iodine intake currently defined by the WHO/United Nations Children’s Fund/International Council for Control of Iodine Deficiency Disorders as insufficient (median UIC, <150 μg/L), adequate (median UIC, 150 to 249 μg/L), and more-than-adequate (median UIC, 250 to 499 μg/L); and (3) to determine whether co-measurement of DBS-Tg antibodies (TgAbs) and DBS-Tg is necessary in population studies of iodine status in PW.
Subjects and Methods
Subjects
We included PW (n = 3870) in all 3 trimesters living in 11 countries: 2 in Europe (Croatia and Switzerland), 1 in North Africa and the Eastern Mediterranean (Morocco), 3 in Sub-Saharan Africa (Niger, South Africa, and Tanzania), 3 in Asia (India, Nepal, and China), and 2 in Southeast Asia (Thailand and the Philippines). We selected these countries to include PW with varying iodine status and provide regional and ethnic representation. All studies were local or regional studies, except for in Switzerland, where the study was nationally representative. The inclusion criteria were (1) healthy women aged 18 to 44 years; (2) singleton pregnancy; (3) nonsmoker; (4) no major chronic diseases; (5) no history of thyroid disease; and (6) no chronic use of medications. To establish the DBS-Tg reference range, we first included all women from countries in which the median UIC of the pregnant population was 150 to 299 μg/L. We next included individual PW from this group who were euthyroid, TgAb-negative and not taking iodine-containing supplements.
With the relative precision for the 97.5 percentile for DBS-Tg specified at 3% to 5% of the total length of the 95% reference range and the estimated standard of DBS-Tg at 2.3 μg/L (based on data from iodine-sufficient Swedish PW (9)), we estimated a sample size of ∼540 PW would be required to establish the DBS-Tg reference range in PW with sufficient iodine intake (10). The ethical committee at each local institution involved in the study approved the study protocol. All the subjects provided informed written consent, and we collected the data from 2008 to 2016.
Study design
We recruited PW through clinics providing routine prenatal care. The participants completed a brief questionnaire on general health status, including year of birth, gestational week (from the date of the last menstrual period), trimester of pregnancy, singleton pregnancy, smoking, history of thyroid disease, major chronic disease, and use of medication or iodine supplements. A spot urine sample was collected and stored at −20°C until analysis. We spotted whole blood from a finger prick onto filter paper cards (Whatman 903; GE Healthcare, Little Chalfont, UK). After spotting, the DBS cards were dried at room temperature for 24 hours and then stored in sealed low-density bags at −20°C until analysis.
Laboratory analyses
We measured UICs using a modification of the Sandell-Kolthoff method (11) and laboratory-specific urine control material. All laboratories in the present study were certified by the Program to Ensure the Quality of Urinary Iodine Procedures (US Centers for Disease Control and Prevention, Atlanta, GA) and participated successfully in its quarterly external validation. We used the WHO/United Nations Children’s Fund/International Council for Control of Iodine Deficiency Disorders criteria based on the median UIC to classify iodine nutrition in the population of PW at each site: insufficient, median UIC <150 μg/L; adequate, median UIC 150 to 249 μg/L; more-than-adequate, median UIC 250 to 499 μg/L (6).
We measured DBS-Tg using a recently developed enzyme-linked immunosorbent assay (12). At a DBS-Tg concentration of 27.2 ± 4.8 μg/L and 59.9 ± 14.7 μg/L, the interassay coefficient of variation (CV; n = 100) was 17.8% and 24.6%, respectively. We measured the serum TgAb concentration in Indian and Thai women using the Immulite 2000 TgAb kit (Immulite 2000, Siemens, Munich, Germany). The manufacturer’s specified reference range is nondetectable to 40 U/mL. We measured DBS-TgAb concentrations using a serum enzyme-linked immunosorbent assay (TgAb enzyme-linked immunosorbent assay, version 2; RSR, Cardiff, UK) adapted in our laboratory for DBS. The intra-assay CV was 7% at 150 ± 50 U/mL and 7.8% at 520 ± 150 U/mL, respectively. The interassay CV was 13.8% at 150 ± 50 U/mL and 9.9% at 520 ± 150 U/mL. The manufacturer cutoff for TgAb positivity is ≥65 U/mL.
Using the GSP Neonatal hTSH kit (PerkinElmer Life Sciences, Turku, Finland), we measured DBS thyroid-stimulating hormone (TSH) and, using the GSP Neonatal T4 kit (PerkinElmer Life Sciences), DBS–total thyroxin (TT4) with the help of an automated time-resolved fluoroimmunoassay (13) at the Swiss Newborn Screening Laboratory, University Children's Hospital (Zurich, Switzerland). The TSH interassay CV was 11.2% at 15.2 ± 1.7 mIU/L and 10.8% at 62.7 ± 6.8 mIU/L. The TT4 interassay CV was 13.3% at 42.9 ± 5.7 nmol/L, 12.3% at 100.7 ± 12.4 nmol/L, and 11.9% at 166.4 ± 19.8 nmol/L. The normal reference values for DBS-TT4 in nonpregnant adults with this assay are 65 to 165 nmol/L. For DBS-TT4 in PW in the first trimester, we used the reference range of 65 to 165 nmol/L. For the second and third trimesters, we multiplied the nonpregnant adult reference range by 1.5 and used the resulting range of 97.5 to 247.5 nmol/L (14). The normal reference values for DBS-TSH in nonpregnant adults with this assay are 0.1 to 3.7 mIU/L. For DBS-TSH in PW in the second and third trimesters, we used this reference range. Using the trimester-specific serum TSH reference ranges suggested by the American Thyroid Association (15) (i.e., a serum TSH ∼18% lower in the first than in second and third trimesters), we lowered the upper limit of our TSH assay to 3.0 mIU/L in the first trimester.
Statistical analyses
Data and statistical analyses were done with Excel 2011 (Microsoft Corp., Redmond, WA) and IBM SPSS Statistics for Mac, version 23 (IBM Corp., Armonk, NY). Outliers were investigated using the Tukey test, but no outliers were removed. Non-normally distributed data were log-transformed for analysis. For parameters with values between 0 and 1 (TSH and Tg), a constant of 1 was added to the values before transformation and was subtracted when back-transformed. Normally distributed data are presented as the mean ± standard deviation or geometrical mean [95% confidence interval (CI)] for log data. Non–normally distributed data are presented as the median [interquartile range (IQR)]. The nonparametric 95% CIs around the median and percentiles (2.5 and 97.5) were obtained using the bootstrap technique (n = 1000). To establish the DBS-Tg reference range, the 2.5 and 97.5 ranked percentiles were calculated, in accordance with the International Federation of Clinical Chemistry and Clinical and Laboratory Standards Institute (formerly, National Committee for Clinical Laboratory Standards) guidelines (16–18), using the following formulas: 0.025 × (n + 1) and 0.975 × (n + 1).
We selected Indian (n = 398), South African (n = 384), and Nepalese (n = 159) PW as the reference populations because these sites had a median UIC of 150 to 299 μg/L (6). PW were excluded if they did not have UIC data available (n = 36) or all thyroid parameters available (n = 247) or were TgAb-positive (n = 59). The final sample for the reference range was 599 PW. We used the Kruskal-Wallis analysis of variance or the Mann-Whitney U test to compare differences in UIC and thyroid hormone levels among the trimesters and between sites, and the Dunn-Bonferroni test for post hoc comparisons. To evaluate the associations between variables, Spearman's correlations were calculated.
For the remaining country data sets, we excluded 886 women because they did not meet the inclusion criteria (n = 208) and/or had no data available for UIC (n = 326) or for all thyroid parameters (n = 352). Thus, the final data set consisted of 2984 PW, and we measured TgAbs on 2015 of these PW. We used the Kruskal-Wallis analysis of variance and Mann-Whitney U test within countries and the generalized linear mixed effect model, with the trimester as a fixed factor and the country as a random factor for the pooled data sets (all sites) to compare the differences in UIC and thyroid hormone levels, followed by Bonferroni post hoc comparisons. We used independent t tests (with log-transformed data), the Mann-Whitney U test, and the generalized linear mixed effect model to compare the median DBS-Tg between the TgAb-positive and TgAb-negative groups. Spearman's correlations were calculated, and multiple linear regression analysis was performed if ≥2 factors correlated with DBS-Tg or TgAbs. We used χ2 tests and the binary logistic generalized linear mixed effect model followed by Bonferroni correction to test for differences in prevalence among trimesters and countries. For the countries for which we had data on gestational age, we performed binary logistic regression analysis for TgAb prevalence, with gestational age as the fixed factor and country as the random factor. Differences with P < 0.05 were considered statistically significant. We constructed scatterplots using individual values of PW (n = 2984) of DBS-Tg vs UIC, TSH, or TT4 and added Loess smoothed line calculations (with 70% of points to fit) to describe the best fit. Bubble charts showing DBS-Tg vs UIC, TSH, or TT4 were clustered using the sample size of each country, with a second-order polynomial trend line added to show the best fit.
Results
Reference range for DBS-Tg in pregnancy
Among the women in India, South Africa, and Nepal included in the reference population (n = 599), the median age was 23.2 years (IQR, 21.2 to 26.8), weight was 51.2 kg (IQR, 46.6 to 58.8), height was 154.6 cm (IQR, 150.4 to 158.4), and body mass index was 21.6 kg/m2 (IQR, 19.8 to 24.2). The overall median UIC was 193.8 μg/L (IQR, 100.9 to 335.9). The pooled median DBS-Tg was 9.2 μg/L (IQR, 5.3 to 14.9), and the 95% CI around the median was 8.7 to 9.8 μg/L. The 2.5 and 97.5 DBS-Tg percentiles were 0.3 μg/L (95% CI, 0.2 to 0.6) and 43.5 μg/L (95% CI, 33.5 to 53.7). No statistically significant difference was found in DBS-Tg among trimesters (P = 0.245; Fig. 1). The median DBS-Tg was 9.7 μg/L (IQR, 7.2 to 16.0) in the first trimester (n = 128), 9.4 μg/L (IQR, 5.2 to 14.7) in the second trimester (n = 260), and 8.0 μg/L (IQR, 4.7 to 14.3) in the third trimester (n = 211). For Nepal and South Africa, we did not have data on the week of gestation, only trimester data; thus, we could not determine whether a relationship existed between gestational week and DBS-Tg in our reference population. The 2.5 and 97.5 DBS-Tg percentiles by trimester were 1.8 μg/L (95% CI, 0.2 to 3.1) and 47.4 μg/L (95% CI, 28.9 to 70.3) in the first trimester, 0.3 μg/L (95% CI, 0.2 to 0.7) and 43.9 μg/L (95% CI, 29.8 to 56.3) in the second trimester, and 0.2 μg/L (95% CI, 0.1 to 0.5) and 42.4 μg/L (95% CI, 32.9 to 63.4) in the third trimester, respectively.
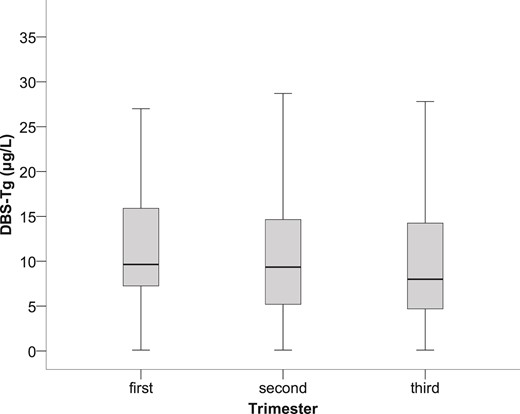
Box plot (median, interquartile range) of DBS-Tg derived from 599 euthyroid, TgAb-negative, pregnant women during the 3 trimesters of pregnancy (P = 0.245).
The prevalence of TgAb-positive PW was 9% (n = 658). The pooled median DBS-Tg in TgAb-positive women (n = 59) was 8.9 μg/L (IQR, 4.8 to 13.6) and was not significantly different statistically than that in TgAb-negative women (n = 599; 9.2 μg/L, IQR, 5.3 to 14.9 μg/L; P = 0.543). The differences in the median DBS-Tg in the TgAb-positive and TgAb-negative PW across trimesters also was not statistically significant: 5.5 μg/L (IQR, 2.4 to 9.6) vs 9.7 μg/L (IQR, 7.2 to 16.0) in the first trimester (P = 0.325); 11.6 μg/L (IQR, 6.8 to 18.4) vs 9.4 μg/L (IQR, 5.2 to 14.7) in the second trimester (P = 0.476) and 7.9 μg/L (IQR, 5.0 to 10.8) vs 8.0 μg/L (IQR, 4.7 to 14.3) in the third trimester (P = 0.967). The pooled median DBS-TSH and DBS-TT4 were 0.8 mIU/L (IQR, 0.6 to 1.2) and 107.7 nmol/L (IQR, 85.2 to 137.0), respectively. The median DBS-TSH was greater in the first trimester (median, 1.1 mIU/L; IQR, 0.9 to 1.4) than in the second (median, 0.8 mIU/L; IQR, 0.6 to 1.2) and third (median, 0.8 mIU/L; IQR, 0.6 to 1.0) trimesters. The difference was statistically significant for both (P < 0.01). The median DBS-TT4 did not differ among the trimesters (P = 0.088). The pooled data showed no overall relevant correlation between DBS-Tg and UIC (rs = 0.042; P = not statistically significant) or between DBS-Tg and DBS-TSH (rs = 0.033; P = not statistically significant). The only statistically significant positive overall correlation was found between DBS-Tg and DBS-TT4 (rs = 0.126; P = 0.002).
Assessment of iodine status in pregnancy using DBS-Tg and reference range
By country, Moroccan women had the lowest median UIC (31.5 μg/L, IQR, 16.7 to 57.6) and Tanzanian women the highest (429.3 μg/L, IQR, 270.1 to 614.9; Table 1). By country, Filipino women had the lowest median DBS-Tg (median, 6.4 μg/L; IQR, 3.2 to 10.9), and Moroccan women had the highest median DBS-Tg (median, 62.4 μg/L; IQR, 35.3 to 93.7; Table 1). The median age, gestational week, weight, height, and body mass index of the women are listed in Supplemental Table 1. Figure 2 shows the median DBS-Tg plotted against the median UIC by country. The frequency of elevated DBS-Tg values was significantly greater in iodine-deficient and more-than-adequate countries than in iodine-sufficient countries (P < 0.05; Table 1).
UIC and DBS-Tg in Pregnant Women Stratified by Country and Trimester
| Variables | Trimester of Pregnancy | |||
|---|---|---|---|---|
| First | Second | Third | All | |
| Morocco | ||||
| Pregnant women (n) | 51 | 118 | 76 | 245 |
| UIC (μg/L) | 35.7a (21.3–60.0) | 28.9a (14.5–57.4) | 30.8a (16.6–52.8) | 31.5 (16.7–57.6) |
| Tg (μg/L) | 54.4a (30.4–79.1) | 63.3a (34.1–93.8) | 72.6a (38.0–110.8) | 62.4 (35.2–93.7) |
| Elevated Tg (>43.5 μg/L) | 62.7 (32)a | 66.9 (79)a | 68.4 (52)a | 66.5 (163)b |
| TgAb-positive | 22.7 (5)a | 30.3 (20)a | 18.0 (9)a | 24.6 (34)c |
| Niger | ||||
| Pregnant women (n) | 13 | 178 | 254 | 445 |
| UIC (μg/L) | 81.3a (43.6–156.8) | 75.7a (41.9–118.6) | 63.9a (31.4–109.5) | 69.5 (37.6–115.9) |
| Tg (μg/L) | 26.5a (22.2–35.8) | 36.5a (25.3–51.1) | 33.5a (23.1–48.7) | 34.0 (23.7–49.3) |
| Elevated Tg (>43.5 μg/L) | 7.7 (1)a | 35.4 (63)a | 31.5 (80)a | 32.4 (144)d |
| TgAb-positive | 0 (0) | 51.7 (46)a | 48.9 (69)a | 49.4 (115)e |
| Philippines | ||||
| Pregnant women (n) | 96 | 98 | 98 | 292 |
| UIC (μg/L) | 155.5a (117.9–203.4) | 79.8f (59.4–88.6) | 74.7f,g (68.4–85.9) | 86.6 (71.6–119.5) |
| Tg (μg/L) | 8.5a (5.9–12.6) | 4.3f (2.0–6.8) | 6.6f,g (3.1–12.4) | 6.4 (3.2–10.9) |
| Elevated Tg (>43.5 μg/L) | 0a | 0a | 2.0 (2)a | 0.7 (2)c |
| TgAb-positive | NA | NA | NA | NA |
| Croatia | ||||
| Pregnant women (n) | 58 | 58 | 47 | 163 |
| UIC (μg/L) | 145.0a (90.3–223.0) | 125.5a (52.0–196.3) | 132.0a (68.0–240.0) | 135.0 (72.0–208.0) |
| Tg (μg/L) | 15.1a (9.6–21.1) | 13.0a (8.2–20.9) | 11.5a (7.7–19.2) | 13.0 (8.5–20.9) |
| Elevated Tg (>43.5 μg/L) | 3.4 (2)a | 1.7 (1)a | 2.1 (1)a | 2.5 (4)c |
| TgAb-positive | NA | NA | NA | NA |
| Switzerland | ||||
| Pregnant women (n) | 66 | 96 | 91 | 256 |
| UIC (μg/L) | 137.3a (70.7–309.8) | 131.8a (65.6–336.1) | 158.1a (57.6–311.7) | 143.2 (67.2–323.8) |
| Tg (μg/L) | 26.8a (17.0–37.8) | 21.8a (14.2–36.3) | 24.2a (15.5–38.0) | 24.6 (15.8–37.1) |
| Elevated Tg (>43.5 μg/L) | 15.2 (10)a | 14.6 (14)a | 15.4 (14)a | 15.0 (38)h |
| TgAb-positive | 24.2 (16)a | 25.3 (24)a | 20.9 (19)a | 23.4 (59)c |
| Thailand | ||||
| Pregnant women (n) | NA | 115 | 153 | 268 |
| UIC (μg/L) | NA | 145.2a (86.9–230.8) | 152.5a (108.9–216.5) | 148.7 (96.2–220.9) |
| Tg (μg/L) | NA | 8.5a (4.9–13.8) | 8.5a (5.7–13.7) | 8.5 (5.4–13.7) |
| Elevated Tg (>43.5 μg/L) | NA | 0.9 (1)a | 3.3 (5)a | 2.2 (6)c |
| TgAb-positive | NA | 15.9 (18)a | 7.3 (11)f | 11.0 (29)b,i |
| South Africa | ||||
| Pregnant women (n) | 7 | 95 | 105 | 207 |
| UIC (μg/L) | 146.2a (101.6–385.7) | 197.5a (107.2–291.2) | 157.5a (79.6–314.8) | 174.0 (95.3–297.6) |
| Tg (μg/L) | 10.6a (5.2–43.5) | 7.3a (4.1–14.7) | 8.3a (4.5–16.9) | 8.0 (4.1–15.1) |
| Elevated Tg (>43.5 μg/L) | 14.3 (1)a | 3.2 (3)a | 3.8 (4)a | 3.9 (8)c |
| TgAb-positive | 0 (0)a | 4.3 (4)a | 1.0 (1)a | 2.5 (5)d |
| China | ||||
| N | 113 | 124 | 102 | 339 |
| UIC (μg/L) | 204.2a (117.7–346.9) | 180.1a (110.8–303.8) | 157.9a (87.5–275.3) | 180.7 (102.8–307.1) |
| Tg (μg/L) | 29.9a (22.5–42.4) | 24.3f (17.9–33.7) | 22.5f,g (15.8–31.9) | 25.9 (18.7–35.8) |
| Elevated Tg (> 43.5 μg/L) | 23.9 (27)a | 15.3 (19)a,f | 6.9 (7)f | 15.6 (53)h |
| TgAb-positive | 19.0 (16)a | 21.0 (21)a | 19.6 (18)a | 19.9 (55)c,h,i |
| India | ||||
| N | 133 | 111 | 63 | 307 |
| UIC (μg/L) | 159.2a (94.7–313.8) | 207.5a (97.3–322.8) | 145.0a (70.8–307.1) | 184.4 (92.1–315.3) |
| Tg (μg/L) | 9.4a (6.6–15.0) | 8.8a (4.6–12.9) | 6.9a (3.6–14.2) | 9.0 (5.2–13.7) |
| Elevated Tg (> 43.5 μg/L) | 1.5 (2)a | 0.9 (1)a | 0a | 1.0 (3)c |
| TgAb-positive | 7.6 (10)a | 2.7 (3)a | 3.3 (2)a | 5.0 (15)b,d |
| Nepal | ||||
| Pregnant women (n) | NA | 85 | 71 | 156 |
| UIC (μg/L) | NA | 310.3a (165.5–427.0) | 274.3a (151.5–397.0) | 290.1 (161.5–403.8) |
| Tg (μg/L) | NA | 12.7a (8.6–18.6) | 8.8f (7.0–12.8) | 10.7 (7.4–15.1) |
| Elevated Tg (>43.5 μg/L) | NA | 3.5 (3)a | 1.4 (1)a | 2.6 (4)c |
| TgAb-positive | NA | 24.7 (21)a | 25.4 (18)a | 25.0 (39)c |
| Tanzania | ||||
| Pregnant women (n) | 16 | 159 | 131 | 306 |
| UIC (μg/L) | 474.0a (409.7–586.3) | 408.7a (267.6–610.8) | 439.4a (254.8–629.6) | 429.3 (270.1–614.9) |
| Tg (μg/L) | 20.9a (15.7–36.0) | 24.9a (17.2–35.6) | 28.9a (19.8–40.3) | 25.8 (18.2–38.4) |
| Elevated Tg (>43.5 μg/L) | 18.8 (3)a | 15.1 (24)a | 18.3 (24)a | 16.7 (51)h |
| TgAb-positive | 20.0 (2)a | 9.1 (9)a | 12.0 (10)a | 10.9 (21)b,h,i |
| All sites | ||||
| Pregnant women (n) | 553 | 1237 | 1191 | 2984 |
| UIC (μg/L) | 152.2a (81.2–257.2) | 133.1a (65.6–288.7) | 119.6a (63.5–255.7) | 132.4 (68.3–269.4) |
| Tg (μg/L) | 17.2a (9.2–31.1) | 18.7a (8.9–33.4) | 19.4f (8.7–34.2) | 18.8 (8.9–33.3) |
| Elevated Tg (>43.5 μg/L) | 14.1 (78)a | 16.8 (208)a | 16.0 (190)a | 16.0 (476) |
| TgAb-positive | 15.2 (49)a | 19.5 (166)a | 18.7 (157)a | 18.5 (372) |
Data presented as median (IQR) or % (n).
Abbreviation: NA, not available.
a–iStatistically significant differences for data in the same row or column with different superscript letters [P < 0.05; Kruskal-Wallis test within countries with Dunn-Bonferroni test for post hoc comparisons; generalized mixed effect model for pooled data sets (all sites)] with trimester as fixed factor and country as random factor, with Bonferroni test for post hoc comparisons; χ2 test followed by z-test for proportions].
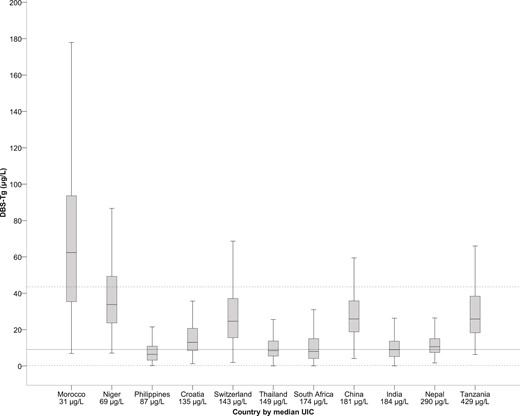
Box plot (median, interquartile range) of DBS-Tg vs median UIC stratified by country. Countries were ranked from lowest median UIC (Morocco, 31.5 µg/L) to highest median UIC (Tanzania, 429.3 µg/L). The top dotted line represents the 97.5 percentile upper reference limit. The middle, solid line represents the median (50th percentile). The bottom dotted line represents the 2.5 percentile lower reference limit.
Effect of DBS-TgAb on DBS-Tg
DBS-TgAb was measured in 2015 pregnant women. For the remaining 969 women, we did not have an adequate sample left on the DBS cards to measure TgAb after the analyses for the other thyroid parameters. The overall prevalence of TgAb-positive PW was 18.5% (n = 2015; Table 1). The overall percentage of TgAb-positive PW was not significantly different among trimesters: 15.2% in the first, 19.5% in the second, and 18.7% in the third trimester (P = 0.266; Table 1). We found no statistically significant difference in TgAb prevalence among gestational weeks (P = 0.274). The percentage of TgAb-positive PW was significantly greater in iodine-deficient countries (26.7%; n = 237) than in iodine-sufficient countries (12%; n = 135; P < 0.01). The overall median DBS-Tg concentration in TgAb-negative PW (n = 1643) was 16.8 μg/L (IQR, 8.7 to 30.8) and in TgAb-positive PW (n = 372) was 24.5 μg/L (IQR, 12.9 to 40.7) (P = 0.252; Supplemental Fig. 1). No statistically significant association was seen between DBS-Tg and the titers of DBS-TgAb (P = 0.391). Within the countries, comparing TgAb-negative and TgAb-positive PW, the median DBS-Tg was significantly different statistically only in Thailand (P = 0.039; Supplemental Table 2). The overall median DBS-Tg (18.3 μg/L) in all PW (including TgAb-positive women) was not substantially greater than when TgAb-positive women were excluded (16.8 μg/L; P = 0.683). Also, within all countries, we found no statistically significant difference comparing the median DBS-Tg in all PW to that in the TgAb-negative PW (P > 0.05 for all countries; Fig. 3). Although the percentage of elevated Tg values in TgAb-negative PW was 13.0% (n = 213) and was significantly lower statistically than in TgAb-positive women (22.8%; n = 85; P < 0.001), the percentage of elevated DBS-Tg values in all PW (14.8%, n = 298) was not significantly different statistically from the percentage when the TgAb-positive women were excluded (13%, n = 213; P = 0.113).
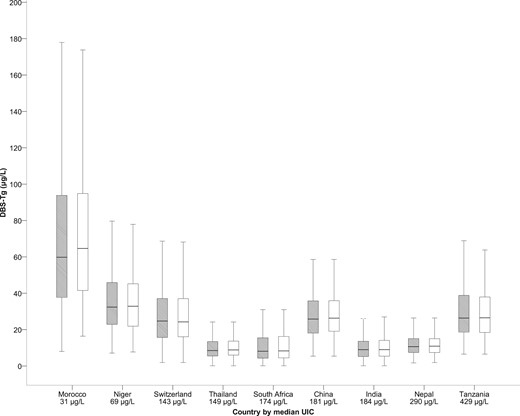
Box plot (median, interquartile range) of DBS-Tg for TgAb-positive and TgAb-negative (gray) vs TgAb-negative only (white) stratified by country.
Relationships between DBS-Tg and other thyroid function test results
The overall median DBS-TSH was 0.7 mIU/L (IQR, 0.5 to 1.0), and the overall median DBS-TT4 was 121.0 nmol/L (IQR, 90.0 to 158.7; Supplemental Table 3). No statistically significant difference was found in the pooled median UIC among trimesters. We found a statistically significant difference among trimesters for the pooled median DBS-TSH (P = 0.045), median DBS-TT4 (P < 0.01), and median DBS-Tg (P = 0.018). Although we did not have data on the gestational week for all women, in those women for whom we had gestational age data (n = 2437), the gestational week was a statistically significant predictor of DBS-Tg (P < 0.001). The prevalence of thyroid dysfunction, stratified by trimester and site, is presented in Supplemental Table 4. The pooled DBS-Tg value correlated statistically significantly and positively with the DBS-TT4 value (rs = 0.464, P < 0.01) and the DBS-TSH value (rs = 0.247, P < 0.01) and negatively with the UIC (rs = −0.164, P < 0.01; Supplemental Table 5). The overall regression of TT4, TSH, and UIC on DBS-Tg was statistically significant (R2 = 0.221; P < 0.001). The standardized coefficient was β = 0.400 for TT4, β = 0.070 for TSH, and β = −0.159 for UIC. The multiple regression for TT4, TSH, and UIC on DBS-Tg was statistically significant in the second and third trimesters (P < 0.001): R2 = 0.236, β = 0.395 for TT4, β = 0.100 for TSH, and β = −0.189 for UIC in the second trimester; and R2 = 0.255, β = 0.406 for TT4, β = 0.118 for TSH, and β = −0.133 for UIC in the third trimester. In the first trimester, linear regression of DBS-Tg on TT4 and TSH was conducted. The regression of TT4 and TSH on DBS-Tg was statistically significant (P < 0.001): R2 = 0.201, β = 0.405 for TT4 and β = 0.088 for TSH. Pooled TgAb correlated significantly and positively with DBS-TSH (rs = 0.207, P < 0.01), DBS-TT4 (rs = 0.421, P < 0.01), DBS-Tg (rs = 0.383, P < 0.01), and country (rs = 0.233, P < 0.01) and negatively with UIC (rs = −0.96, P < 0.01). The overall regression of TgAb on TT4, Tg, and TSH was statistically significant (R2 = 0.304, β = 0.421 for TT4, β = 0.153 for Tg, and β = 0.123 for TSH; P < 0.01).
Figure 4A and Supplemental Figs. 2A and 3A show the plots of DBS-Tg, DBS-TSH, and DBS-TT4 against UIC, including the Loess smoothed line depicting the best fit. To show the influence of iodine intake on thyroid function, we plotted the median UIC against the median DBS-Tg, DBS-TSH, and DBS-TT4 in the bubble plots (clustered by country; Fig. 4B and Supplemental Figs. 2B and 3B).
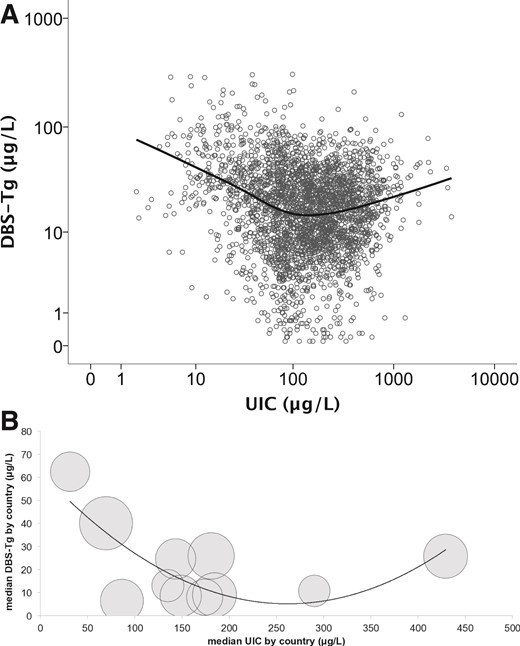
(A) Scatterplot (using individual values of 2984 pregnant women) of DBS-Tg vs UIC, with Loess smoothed line added to show best fit. Data are presented on a log scale for both UIC and DBS-Tg. (B) Bubble chart (clustered by country) of median DBS-Tg vs median UIC with a second-order polynomial trend line. The size of the bubbles reflects the sample size for each country.
Discussion
The proposed Tg reference ranges in iodine-sufficient areas for adults and children are generally in the range of 4 to 40 μg/L (4, 19). In the present study, we have proposed a reference range for DBS-Tg of 0.3 to 43.5 μg/L, slightly wider, but otherwise similar, to the Tg reference range proposed for other population groups (4, 19). These data suggest that a population of PW with a prevalence of <3% of DBS-Tg ≥44 μg/L could be categorized as iodine sufficient. In addition, from the pooled median DBS-Tg in the reference population of 9.2 μg/L and a 95% CI of 8.7 to 9.8 μg/L, a target median DBS-Tg of ∼10 μg/L can be used to categorize iodine sufficiency in a population of PW, a value comparable to those proposed for nonpregnant adult populations (2, 20). Previous studies of iodine-deficient PW (defined by a UIC <150 μg/L) have reported a median serum Tg of ≥10 μg/L (21–23) across trimesters. Similarly, previous studies of PW in iodine-deficient areas in which the UIC was not measured also support this median Tg value (24–26). In our reference population, the DBS-Tg concentrations did not differ significantly among the trimesters; thus, we have recommended a single reference range for all 3 trimesters.
In a range from severely deficient (Morocco) to more-than-adequate iodine intake (Tanzania), the median DBS-Tg showed a shallow U-shaped curve (Fig. 4). An increasing severity of iodine deficiency was associated with higher DBS-Tg and greater prevalence of elevated DBS-Tg. Greater Tg concentrations in iodine-deficient PW likely reflect an increase in thyroid activity and/or size (2, 3) to meet the increased maternal–fetal requirement for thyroid hormone despite the lack of iodine (8, 27, 28). The mechanism of the increase in Tg at high iodine intakes is uncertain but might involve a failure of the thyroid to escape from the Wolff-Chaikoff effect, resulting in inhibition of thyroid peroxidase and reduced Tg proteolysis (29). Our data suggest that Tg could be a sensitive functional indicator of both iodine deficiency and excess in PW and could be used in conjunction with UIC, the recommended exposure biomarker (6).
The prevalence of TgAb positivity among PW has been reported to vary from 2.3% to 20% (30, 31). In our data, the overall prevalence was 18.5%. Although thyroid autoimmunity typically wanes during the course of gestation (32–34), we did not find a consistent pattern of a lower prevalence of TgAbs in later gestation. The overall percentage of TgAb-positive PW was not significantly different among trimesters. In some countries (India, China, Switzerland, Thailand), a decline was seen in TgAb prevalence during gestation; however, in other countries (Nepal, South Africa, Morocco, Niger), an increase was seen. The prevalence of TgAbs was significantly greater in the women from iodine-deficient countries compared with those from iodine-sufficient countries. This is in contrast to studies of nonpregnant women, in whom the frequency of thyroid autoimmunity tends to be higher in iodine-sufficient than in iodine-deficient populations (35).
The cost of measuring TgAbs in large field studies to assess iodine status can only be justified if their concurrent measurement improves the estimates of DBS-Tg. Our data suggest concomitant TgAb measurement is unnecessary. Within countries, comparing all PW with those who were TgAb-negative (i.e., excluding TgAb-positive women), no statistically significant difference was seen in the median DBS-Tg or in the prevalence of elevated DBS-Tg values.
In our study, among PW in the countries with sufficient or more-than-adequate iodine intake, no statistically significant correlation was found between Tg and UIC or TSH or TT4, in agreement with previous studies of PW (8, 36–39). This might result by the iodine-deficient thyroid upregulating thyroid hormone synthesis and maintaining euthyroidism through mechanisms independent of TSH (40, 41). In contrast, in the iodine-deficient countries, Tg substantially and positively correlated with TSH in Morocco and the Philippines, but not in Niger. In contrast, Tg substantially and negatively correlated with UIC only in Morocco. Previous studies of correlations between Tg and UIC in iodine-deficient PW found a negative correlation (8, 21) or no statistically significant correlation (38, 42). The lack of correlation between Tg and UIC might result from confounding by the variable amounts of iodine stored in the thyroid in iodine-deficient pregnant women that can contribute to thyroid hormone synthesis and/or the wide interday variability in DBS-UIC (43).
The strengths of the present study include the international study population, the large sample size with wide variations in iodine status, the use of standardized methods for the UIC and thyroid function tests, and the co-measurement of TgAbs. A limitation of our study was that we used a single spot UIC, expressed as μg/L, to categorize iodine status, in accordance with the WHO recommendations (6). We tried to at least partially overcome this limitation by assessing the median DBS-Tg in populations of PW living in areas with varying iodine status and relating this to the median UIC. However, as discussed, this could have limited our ability to find correlations between UIC and Tg, except in the countries with the lowest iodine intake, where the day-to-day UIC might have been less variable. Also, we did not measure creatinine in the urine samples and express the iodine concentration per unit of creatinine, which might have improved our individual classification of iodine status (44). The use of DBS simplifies the collection and transport of samples, which can lower field costs compared with the use of serum assays. However, if the DBSs are collected poorly or incompletely dried, that could increase the variation. Another caveat is that large variations exist between different serum assays for Tg, limiting direct comparisons between our findings and studies using different Tg assays. We are uncertain why in 2 of the countries in our study with successful iodine programs, China and Switzerland, the median DBS-Tg was >10 μg/L. Despite these limitations, our findings suggest that the use of DBS-Tg in pregnancy, together with UIC, to define iodine status could be a promising approach. If Tg proves to be a sensitive biomarker of deficient and excess iodine intake in pregnancy, its future use might allow refinement of the current range of median UIC to define adequate iodine status in PW.
Abbreviations:
- Ab
antibody
- CI
confidence interval
- CV
coefficient of variation
- DBS
dried whole-blood spot
- IQR
interquartile range
- PW
pregnant woman
- Tg
thyroglobulin
- TgAb
autoantibody against Tg
- TSH
thyroid-stimulating hormone
- TT4
total thyroxin
- UIC
urinary iodine concentration
- WHO
World Health Organization
Acknowledgments
We thank Vincent Assey, Susanne Dold, Jessica Farebrother, Césaire Ouédraogo, Joshua Saltiban, Ryan Wessells, and Rebecca Young, the field workers who participated in the sample collection, and the participating pregnant women.
This work was funded by the Swiss State Secretariat for Education, Research and Innovation (Bern, Switzerland), Global Alliance for Improved Nutrition, the United Nations Children's Fund, and the Human Nutrition Laboratory, Institute of Food, Nutrition and Health, ETH Zurich (Zurich, Switzerland). Administrative support was provided by the European Union Horizon 2020 project (EUThyroid 15.0146).
Disclosure Summary: The authors have nothing to disclose.
References
Okosieme OE, Lazarus JH. Thyroglobulin: a thyroid autoantigen and marker of DTC. Available at: http://www.cli-online.com/fileadmin/pdf/pdf_general/thyroglobulin-a-thyroid-autoantigen-and-marker-of-dtc.pdf. Accessed 25 August, 2015.
Author notes
Address all correspondence and requests for reprints to: Sara Stinca, PhD, Human Nutrition Laboratory, Institute of Food Nutrition and Health, ETH Zurich, Schmelzbergstrasse 7, LFV D 27.2, Zurich 8092, Switzerland. E-mail: [email protected].
