


Abstract
Peak bone mass (PBM) and strength are important determinants of fracture risk in later life. During growth, bone is responsive to changes in nutrition and physical activity (PA), particularly before pubertal maturation.
In prepubertal healthy boys, protein intake (Prot-Int) enhances the impact of PA on weight-bearing bone. We hypothesized that the synergism between Prot-Int and PA on proximal femur as recorded at 7.4 years would track until PBM.
A total of 124 boys were followed from 7.4 to 15.2 and 22.6 years. At 7.4 years, they were dichotomized according to the median of both PA and Prot-Int.
In boys with PA greater than the median (310 vs 169 kcal ⋅ d−1), higher vs low Prot-Int (57.7 vs 38.0 g ⋅ d−1) was associated with +9.8% greater femoral neck (FN) bone mineral content (BMC) (P = 0.027) at 7.4 years. At 15.2 and 22.6 years, this difference was maintained: FN BMC: +12.7% (P = 0.012) and +11.3% (P = 0.016), respectively. With PA greater than the median, in Prot-Int greater than vs less than the median, differences in FN BMC z scores were +0.60, +0.70, and +0.68 at 7.4, 15.2, and 22.6 years, respectively. Microfinite element analysis of distal tibia at 15.2 and 22.6 years indicated that in the 2 groups with PA greater than the median, cross-sectional area, stiffness, and failure load were greater in Prot-Int greater than vs less than the median.
This study demonstrates the crucial influence of Prot-Int on the response to enhanced PA and the importance of prepubertal years for modifying the bone growth trajectory and, thereby, for achieving higher PBM and greater strength in healthy male participants.
Bone structure and strength acquired by the end of the growth period are an important determinant of the risk of fragility or osteoporotic fracture in later life (1–3). For the sake of simplicity, the term peak bone mass (PBM) is still used since it implicitly means the maximal values attained for both bone structure and strength in the first years of the third decade (1).
Among the determinants of PBM, twin studies revealed that genetic factors account for 60% to 80% of PBM variance (4). Thus, the 20% to 40% remaining variance appears to be determined by environmental factors and particularly by physical activity and nutrition (1).
Besides the relative contributions of the main determinants to PBM, an important issue was to identify when, during growth, bone would be most reactive to the impact of environmental factors. Counterintuitively, peripuberty (i.e., during the years of accelerated bone acquisition) was not shown to be the most sensitive period. By contrast, during infancy and childhood—in other words, before the onset of pubertal maturation—bone development was observed to be particularly responsive to either variations in physical activity or changes in nutrient consumption [for review, see Bonjour et al. (1)].
Such an observation would be of little practical interest if bone gain induced by modifiable environmental factors were transient and did not result in any protracted increase in skeletal structure and strength. However, follow-up studies have shown that bone gain acquired by modification of environmental factors before pubertal maturation can be maintained during several years (1, 5). An 8-year follow-up study in healthy boys recently reported that the positive impact of increased protein intake on the bone response to physical activity tracks from prepuberty to mid- to late adolescence (5, 6).
In the current study, we further report on the tracking over 15 years of the positive impact of protein intake on physical activity from prepuberty to young adulthood on both bone structure and strength of healthy males. This analysis emphasizes that early life alterations in environmental factors can affect the key structural and mechanical characteristics of young adult weight-bearing bones.
Materials and Methods
Participants
The analysis was performed on data obtained in 124 white healthy men with mean ± SD age of 22.6 ± 0.8 years. These participants belonged to an initial cohort of 235 healthy prepubertal white boys recruited at a mean ± SD age of 7.4 ± 0.4 years (range, 6.5 to 8.5 years) through the Public Health Youth Service of the Geneva district from September 1999 to September 2000 (7). Between 7.4 and 8.5 years, half of the cohort received a calcium supplementation as previously reported (7). Exclusion criteria were a ratio of weight to height below the third and above the 97th percentile according to the Geneva reference values, the presence of physical signs of puberty, chronic disease, gastrointestinal disease with malabsorption, congenital or acquired bone diseases, and regular use of medication. The 22.6-year-old participants presented in this report (n = 124) were included in the group examined at the age of 7.4 years (n = 235) (6) and 15.2 years (n = 174) (5) to study the relationship between protein intake and physical activity. Their inclusion in the present analysis was merely determined by the fact that these 124 participants accepted the invitation to be examined at the age of 7.4, 15.2, and 22.6 years, thus allowing us to calculate for each individual the progressive changes in anthropometric, dietary, and bone variables from prepuberty to mid-adolescence and young adulthood. The characteristics of these 124 participants did not differ from those recorded in the 235 participants initially enrolled and presented in a previous report (6).
The Ethics Committees of the Department of Pediatrics and the Department of Internal Medicine, Rehabilitation, and Geriatrics of the Geneva University Hospitals approved the protocol. Informed consent was initially obtained from the parents with the assent of their children. Another consent was obtained from the participants when they reached adult age.
Clinical assessment
Standing height, using a Harpenden stadiometer (Holtain, Crymych, UK), and body weight were measured, allowing us to calculate the body mass index (kg/m2). Tanner’s pubertal stages were determined at the age of 7.4 years by a pediatric endocrinologist (6). At the age of 15.2 years (5), pubertal maturation was determined by self-assessment based on drawings and a written description of Tanner’s classification. Participants who were still sexually immature (63%) at that age had become normally mature (Tanner stage 5) when aged 22.6 years. General health was assessed based on an interview by a medical physician. From 7.4 to 22.6 years, no pathological disorder susceptible of affecting the skeleton was detected among the 124 participants. As previously reported (8), 51% of the participants had experienced a fracture during childhood and adolescence, a quite usual rate for a cohort of physically active and healthy boys (9).
Intake of protein and calcium intake
At each visit, the consumption of protein and calcium was assessed by a food frequency questionnaire as previously described (5, 6). The total protein intake from animal sources was computed from dairy products, meat, fish, and eggs. Dairy products amounted to 49% of the recorded protein intake, whereas meat, fish, and eggs taken together amounted to 51% (6). Calcium intake was essentially determined from dairy sources.
Physical activity assessment
To assess physical activity, we used a questionnaire initially completed by parents, who reported the time that their children spent in physical education classes, organized sports, recreational activity, and usual walking and cycling (10). Later, the questionnaire was filled in by the participants themselves. The data were then expressed as physical activity energy expenditure (kcal/d) using established conversion formulas (11).
Bone measurements
A Hologic QDR 4500 instrument (Hologic, Waltham, MA) was used to measure by dual-energy X-ray absorptiometry (DXA) the areal bone mineral density and bone mineral content (BMC) at the level of the femoral neck (FN), as previously reported (5, 6). At this site, the coefficient of variation in repeated areal bone mineral density measurements determined in young healthy adults varied from 1.0% to 1.6% (7).
Volumetric bone mineral density (vBMD) and microstructure were measured at the distal tibia by high-resolution–peripheral computerized tomography (HR-pQCT). The operated XtremCT instrument (Scanco Medical AG, Brütittsellen, Switzerland) acquired a stack of 110 parallel computerized tomography slices (9 mm in length) with an isotropic voxel size of 82 µm, as previously described (8, 12). The first computerized tomography slice at the distal tibia was 22.5 mm proximal to the reference line, as described in a previous adult study (12). The following variables were measured: total, cortical, and trabecular volumetric bone mineral density, expressed as milligrams of hydroxyapatite per cubic centimeter; trabecular bone volume fraction; trabecular number, thickness (micrometers), and spacing (micrometers); mean cortical thickness (micrometers); and cross-sectional area (CSA) (mm2). The in vivo short-term reproducibility of HR-pQCT at the distal tibia assessed in 15 participants with repositioning varied by 0.6% to 1.0% and by 2.8% to 4.9% for bone density and for trabecular architecture, respectively. These reproducibility ranges are similar to those previously published (13). DXA and HR-pQCT measurements were usually performed on the nondominant limb. One technician per device performed all the scans. A daily quality control using a phantom was performed to check for possible drifts in the X-ray sources. Both the DXA and HR-pQCT scans were performed at a mean age of 7.4. 15.2, and 22.6 years by a single technician (G.C.), as acknowledged in previous (5, 6) and the present reports.
Finite element models of the tibia were created directly from the segmented HR-pQCT images using a procedure similar to that used in previous clinical studies (14–16). In summary, a voxel conversion procedure was used to convert each voxel of bone tissue into an equally sized brick element (17), thus creating microfinite element models that can represent the actual trabecular architecture in detail. The models contained approximately 5 million elements for the tibia and could be solved in approximately 5 hours. Material properties were chosen: isotropic and elastic. Both cortical and trabecular elements were assigned a Young’s modulus of 10 GPa and a Poisson’s ratio of 0.3 (15, 18). A compression test was simulated to represent loading conditions during a fall from standing height (19). The estimated bone failure load was calculated as the force for which 2% of the bone tissue would be loaded beyond 0.7% strain (18, 20). In addition to estimated failure load (N), microfinite element analysis (μFEA)-derived variables used in our study also included stiffness (kilo-Newtons per millimeter). In addition, an “apparent modulus” (N ⋅ mm−2) was calculated and defined as the stiffness multiplied by the height of the model (9 mm in all cases) and divided by the projected CSA. This measure thus provides information about the stiffness corrected for differences in height and CSA. All finite element analyses were done using the finite element solver integrated in the IPL software version 1.15 (Scanco Medical AG).
Expression of the results and statistical analysis
The various anthropometric, dietary, osteodensitometric, microstructural, and mechanical variables are given as mean ± SD. All variables were also analyzed after separation according to the median of both physical activity and protein intake assessed at 7.4 years by analysis of variance.
Anthropometric variables and BMC, area, width, and areal bone mineral density values at the FN were also expressed in standard deviation score (z scores) as computed from the measurements made in the whole cohort. Measurements made at the distal tibia (i.e., CSA, stiffness, and failure load) were also expressed as z scores.
A 2-way analysis of variance was used to analyze the interaction between protein intake and physical activity on bone variables. The significance level for 2-sided P values was 0.05 for all tests. The data were analyzed using STATA software, version 9.2 (StataCorp LP, College Station, TX).
Results
The normal age-related progression from prepuberty to mid- to late adolescence and to young adulthood of anthropometric variables, dietary calcium and protein intakes, and DXA-acquired proximal femur measurements is presented in Table 1. At the age of 15.2 years, standing height and total FN BMC were 96.1% and 86.9% of the respective adult values measured at the age of 22.6 years (Table 1). Between mid-adolescence and young adulthood, the relative greater increase in body weight (+23.8%) than in standing height (+4.0%) was expressed by a 15.0% progression in body mass index (Table 1). At the age of 7.4 and 15.2 years, the total protein intake corresponded to 62.6% and 84.3%, respectively, of the adult value (75.5 g ⋅ d−1) (Table 1).
Characteristics Assessed in 124 Healthy Boys at a Mean Age of 7.4, 15.2, and 22.6 Years
| Characteristic | 7.4 ± 0.4 | 15.2 ± 0.4 | 22.6 ± 0.8 | Δ 7.4 to 15.2 | Δ 15.2 to 22.6 | Δ 7.4 to 22.6 |
| Standing height, cm | 125.7 ± 5.9 | 171.8 ± 8.4 | 178.7 ± 6.2 | 46.3 ± 4.7 | 6.9 ± 5.5 | 53.2 ± 4.3 |
| Body weight, kg | 25.3 ± 4.6 | 59.3 ± 11.1 | 73.4 ± 12.8 | 34.3 ± 8.2 | 14.1 ± 8.9 | 48.4 ± 10.3 |
| BMI, kg/m2 | 15.9 ± 1.9 | 20.0 ± 2.7 | 23.0 ± 3.6 | 4.2 ± 2.0 | 3.0 ± 2.4 | 7.2 ± 3.0 |
| Calcium intake, mg ⋅ d−1 | 752 ± 263 | 1031 ± 569 | 949 ± 501 | 276 ± 531 | −85 ± 513 | 194 ± 515 |
| Protein intake, g ⋅ d−1 | 47.3 ± 11.6 | 63.7 ± 24.6 | 75.5 ± 27.0 | 16.6 ± 22.5 | 11.7 ± 30.7 | 28.5 ± 27.7 |
| Total PA, kcal ⋅ d−1 | 242 ± 94 | 722 ± 378 | 738 ± 530 | 487 ± 359 | 15 ± 525 | 498 ± 516 |
| FN BMC, mg | 2052 ± 337 | 4600 ± 803 | 5296 ± 839 | 2562 ± 662 | 680 ± 563 | 3250 ± 707 |
| FN area, cm2 | 3.00 ± 0.32 | 5.27 ± 0.43 | 5.65 ± 0.36 | 2.27 ± 0.37 | 0.38 ± 0.32 | 2.65 ± 0.35 |
| FN width, cm | 1.98 ± 0.21 | 3.49 ± 0.28 | 3.73 ± 0.24 | 1.50 ± 0.25 | 0.25 ± 0.21 | 1.75 ± 0.23 |
| FN aBMD, mg/cm2 | 675 ± 72 | 872 ± 122 | 938 ± 135a | 192 ± 92 | 63 ± 83 | 256 ± 108 |
All values are means ± SDs.
aBMD, areal bone mineral density; BMC, bone mineral content; BMI, body mass index; FN, Femoral neck variables assessed by dual-energy X-ray absorptiometry; PA, physical activity.
a Corresponds to a T-score = 0.06 ± 0.99, which is not significantly different from that used as for the clinical diagnosis of osteoporosis in the dual-energy X-ray absorptiometry unit of the University Hospitals of Geneva.
When aged 7.4 years, the cohort was separated into 4 groups, according to the median of both physical activity (PA) and protein intake (Prot-Int). At that age, in the 2 groups with PA greater than the median (297 and 319 kcal ⋅ d−1) compared with the 2 groups with PA less than the median (170 and 166 kcal ⋅ d−1), the impact of Prot-Int above vs below the median (57.7 vs 38.0 g ⋅ d−1) was associated with +9.8% greater FN BMC (P = 0.027) (Table 2). At 15.2 and 22.6 years, this difference was maintained, with an FN BMC of +12.7% (P = 0.012) and +11.3% (P = 0.016) (Table 2), respectively. The impact of Prot-Int with PA greater than the median on FN bone mineral content was structurally combined with an increase in the width of the FN (Table 2).
Impact of Physical Activity and Protein Intake Recorded at 7.4 Years on Anthropometric and Femoral Neck Characteristics Measured at 7.4, 15.2, and 22.6 Years
| Characteristic | (A) PA < Median Prot-Int < Median (n = 40) | (B) PA > Median Prot-Int < Median (n = 26) | (C) PA < Median Prot-Int > Median (n = 24) | (D) PA > Median Prot-Int > Median (n = 34) | Pa | +Pb |
|---|---|---|---|---|---|---|
| 7.4 years | ||||||
| Height, cm | 123.5 ± 5.2 | 123.9 ± 5.7 | 126.2 ± 5.3 | 128.5 ± 6.3 | 0.001 | 0.005 |
| Weight, kg | 23.5 ± 3.1 | 24.1 ± 3.2 | 24.5 ± 3.1 | 27.9 ± 5.9 | 0.0001 | 0.005 |
| BMI, kg/m2 | 15.4 ± 1.3 | 15.7 ± 1.6 | 15.3 ± 1.3 | 16.7 ± 2.2 | 0.003 | 0.054 |
| FN BMC, mg | 1989 ± 303 | 1969 ± 233 | 2051 ± 314 | 2162 ± 384 | 0.066 | 0.027 |
| FN area, cm2 | 2.96 ± 0.32 | 2.95 ± 0.33 | 2.95 ± 0.33 | 3.12 ± 0.30 | 0.088 | 0.045 |
| FN width, cm | 1.96 ± 0.21 | 1.95 ± 0.33 | 1.95 ± 0.22 | 2.06 ± 0.20 | 0.088 | 0.045 |
| FN aBMD, mg/cm2 | 672 ± 72 | 668 ± 62 | 696 ± 70 | 690 ± 79 | 0.384 | 0.249 |
| 15.2 years | ||||||
| Height, cm | 169.4 ± 8.8 | 169.9 ± 9.4 | 172.1 ± 6.9 | 175.9 ± 6.7 | 0.005 | 0.006 |
| Weight, kg | 55.3 ± 9.3 | 57.8 ± 9.9 | 59.5 ± 8.6 | 65.0 ± 13.2 | 0.002 | 0.023 |
| BMI, kg/m2 | 19.1 ± 1.9 | 19.9 ± 2.3 | 20.2 ± 3.2 | 20.9 ± 3.2 | 0.049 | 0.192 |
| FN BMC, mg | 4412 ± 769 | 4394 ± 837 | 4674 ± 683 | 4950 ± 803 | 0.013 | 0.012 |
| FN area, cm2 | 5.16 ± 0.44 | 5.24 ± 0.47 | 5.25 ± 0.40 | 5.44 ± 0.38 | 0.045 | 0.080 |
| FN width, cm | 3.41 ± 0.29 | 3.47 ± 0.31 | 3.47 ± 0.26 | 3.60 ± 0.25 | 0.045 | 0.080 |
| FN aBMD, mg/cm2 | 850 ± 110 | 836 ± 124 | 892 ± 108 | 916 ± 134 | 0.032 | 0.021 |
| 22.6 years | ||||||
| Height, cm | 177.6 ± 5.7 | 176.6 ± 5.5 | 178.2 ± 6.0 | 181.7 ± 6.6 | 0.006 | 0.003 |
| Weight, kg | 69.8 ± 9.4 | 70.7 ± 8.0 | 74.0 ± 13.4 | 79.8 ± 16.4 | 0.005 | 0.014 |
| BMI, kg/m2 | 22.1 ± 2.5 | 22.7 ± 2.7 | 23.3 ± 4.3 | 24.1 ± 4.6 | 0.110 | 0.172 |
| FN BMC, mg | 5049 ± 750 | 5118 ± 768 | 5363 ± 738 | 5694 ± 940 | 0.006 | 0.016 |
| FN area, cm2 | 5.61 ± 0.36 | 5.59 ± 0.31 | 5.59 ± 0.34 | 5.77 ± 0.38 | 0.127 | 0.055 |
| FN width, cm | 3.71 ± 0.24 | 3.70 ± 0.21 | 3.69 ± 0.23 | 3.82 ± 0.25 | 0.127 | 0.055 |
| FN aBMD, mg/cm2 | 901 ± 129 | 916 ± 128 | 960 ± 117 | 986 ± 148 | 0.037 | 0.066 |
Values are means ± SDs. Values in bold are significant (P < 0.05). There is no statistical significance for comparison of bone variables between groups A and C. There is no statistically significant interaction between physical activity and protein intake on bone variables.
aBMD, areal bone mineral density; BMC, bone mineral content; BMI, body mass index; FN, femoral neck; PA, physical activity; Prot-Int, protein intake.
aP by analysis of variance among all groups.
b+P comparison among groups B and D.
The impact of Prot-Int above vs below the median in groups with PA greater than the median was still associated with some gain in FN BMC from 7.4 to 15.2 years (P = 0.057) but not from 15.2 to 22.6 years (P = 0.721) (Supplemental Table 1). In contrast, the corresponding difference in FN width observed at 7.4 years was not further enhanced from 7.4 to 15.2 years and from 15.2 to 22.6 years (Supplemental Table 1). In PA greater than the median, the difference in FN BMC gain from 7.4 to 22.6 years (∆ = 354 mg) between Prot-Int above and below the median virtually equates with that recorded between 7.4 and 15.2 (∆ = 363 mg) (Supplemental Table 1). Thus, in PA greater than the median, the influence of Prot-Int on FN BMC gain from prepuberty to young adulthood is already achieved by mid-puberty.
In PA greater than the median, the differences in z score for FN BMC between Prot-Int above and below the median were 0.60, 0.70, and 0.68 at 7.4, 15.2, and 22.6 years, respectively (Figure 1A). The corresponding differences in z score for FN width were 0.52, 0.45, and 0.52, respectively (Figure 1B). The anthropometric z scores of the 4 groups distributed according to the median of both PA and Prot-Int are available online (Supplemental Table 2).
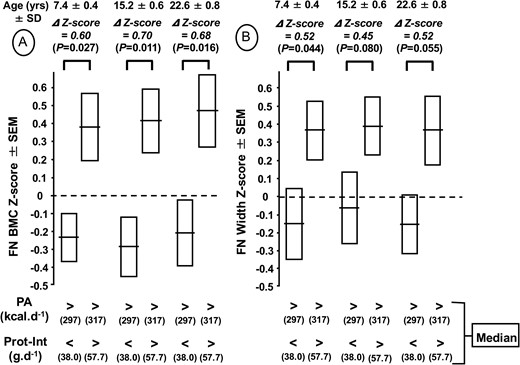
Femoral neck (FN) bone mineral content (BMC) (A) and femoral neck width (B) z scores measured at 7.4, 15.2, and 22.6 years according to physical activity (PA) and protein intake (Prot-Int) determined at 7.4 years. The cohort of 124 healthy boys was separated into 4 groups according to the median of both PA and Prot-Int. The absolute values of FN BMC and FN width of the 4 groups in relation to both PA and Prot-Int are presented in Table 2. The z score differences (∆) with P levels for FN BMC and FN width between the 2 groups with high PA and either low or high Prot-Int are indicated above the brackets connecting the 2 corresponding bars.
Most HR-pQCT measured microstructure variables in the distal tibia increased from 15.2 to 22.6 years, except for the trabecular number and space and CSA, which remained stable (Table 3). Cortical thickness that increased by 67.5% from 15.2 to 22.6 years was the greatest relative change recorded among the measured microstructural components (Table 3). Strength variables generated by µFEA indicate that stiffness, estimated failure load, and apparent modulus significantly increased by 26.7%, 24.1%, and 29.2% from 15.2 to 22.6 years (Table 3).
Microstructure and Strength of Distal Tibia Measured at 15.2 and 22.6 Years in 124 Healthy Boys
| Characteristic | 15.2 Years | 22.6 Years | Δ 15.2 to 22.6 Yearsa | Pb |
|---|---|---|---|---|
| Total vBMD, mg HA/cm2 | 267.5 ± 45.3 | 347.2 ± 46.3 | 79.3 ± 31.3 | <0.0001 |
| Cortical vBMD, mg HA/cm2 | 731.8 ± 55.0 | 884.2 ± 29.1 | 152.4 ± 50.5 | <0.0001 |
| Trabecular vBMD, mg HA/cm2 | 201.0 ± 27.4 | 223.3 ± 28.8 | 22.2 ± 13.5 | <0.0001 |
| BV/TV, % | 16.7 ± 2.3 | 18.6 ± 2.4 | 1.9 ± 1.1 | <0.0001 |
| Tb.N, mm−1 | 2.09 ± 0.28 | 2.12 ± 0.30 | 0.03 ± 0.17 | 0.441 |
| Tb.Th, μm | 80.8 ± 11.0 | 88.7 ± 10.8 | 7.6 ± 8.0 | <0.0001 |
| Tb.Sp, μm | 406.0 ± 59.1 | 393.0 ± 63.9 | −13.7 ± 38.4 | 0.098 |
| Ct.Th, μm | 825.0 ± 323.6 | 1384.2 ± 292.1 | 557.4 ± 264.3 | <0.0001 |
| CSA, mm2 | 873.5 ± 144.1 | 853.4 ± 135.4 | −16.5 ± 56.1 | 0.261 |
| Stiffness, KN/mm | 251.4 ± 51.9 | 317.9 ± 45.6 | 66.7 ± 32.9 | <0.0001 |
| Estimated failure load, N | 12,035 ± 2396 | 14,930 ± 2132 | 2916 ± 1429 | <0.0001 |
| Apparent modulus, N/mm2 | 2160 ± 424 | 2790 ± 391 | 630 ± 307 | <0.0001 |
Values are means ± SDs. Values in bold are significant (P < 0.05).
BV/TV, trabecular bone volume fraction; CSA, cross-sectional area; Ct.Th, cortical thickness; HA, hydroxyapatite; Tb.N, trabecular number; Tb.Sp, trabecular separation; Tb.Th, trabecular thickness; vBMD, volumetric bone mineral density.
a ∆ = difference between values at 15.2 and 22.6 years.
bP = comparison among values at 15.2 and 22.6 years.
At the age of 15.2 years, in the 2 groups with PA greater than the median, the impact of Prot-Int above rather than below the median was associated with greater trabecular number and CSA, with a trend toward an increase in both stiffness and estimated failure load (Table 4). From 15.2 to 22.6 years in the 2 groups with PA greater than the median, the absolute differences in CSA, stiffness, and estimated failure load between Prot-Int above and below the median did not increase further (Table 4). These results are illustrated by showing that the differences in z score of these 3 distal tibia strength-related variables observed at 15.2 years were maintained until young adulthood (Figure 2).
Impact of Physical Activity and Protein Intake Recorded at a Mean Age of 7.4 Years on Microstructure and Strength of Distal Tibia Measured at 15.2 and 22.6 Years in 124 Healthy Boys
| Characteristic | (A) PA < Median Prot-Int < Median (n = 40) | (B) PA > Median Prot-Int < Median (n = 26) | C) PA < Median Prot-Int > Median (n = 24) | (D) PA > Median Prot-Int > Median (n = 34) | Pa | +Pb |
|---|---|---|---|---|---|---|
| 15.2 years | ||||||
| Total vBMD, mg HA/cm2 | 245 ± 46 | 264 ± 54 | 276 ± 43 | 267 ± 40 | 0.747 | 0.746 |
| Cortical vBMD, mg HA/cm2 | 726 ± 56 | 736 ± 54 | 739 ± 54 | 731 ± 56 | 0.807 | 0.765 |
| Trabecular vBMD, mg HA/cm2 | 199 ± 27 | 195 ± 31 | 205 ± 25 | 205 ± 27 | 0.413 | 0.187 |
| BV/TV, % | 16.6 ± 2.2 | 16.3 ± 2.6 | 17.1 ± 2.1 | 17.1 ± 2.2 | 0.415 | 0.188 |
| Tb.N, mm−1 | 2.04 ± 0.23 | 2.00 ± 0.23 | 2.10 ± 0.25 | 2.21 ± 0.35 | 0.015 | 0.012 |
| Tb.Th, μm | 81.6 ± 10.5 | 81.6 ± 12.0 | 82.3 ± 10.9 | 78.3 ± 10.9 | 0.474 | 0.262 |
| Tb.Sp, μm | 415 ± 50 | 424 ± 57 | 402 ± 61 | 385 ± 65 | 0.044 | 0.016 |
| Ct.Th, μm | 798 ± 324 | 832 ± 367 | 878 ± 321 | 814 ± 298 | 0.809 | 0.828 |
| CSA, mm2 | 833 ± 126 | 854 ± 120 | 847 ± 111 | 955 ± 172 | 0.001 | 0.013 |
| Stiffness, KN/mm | 240 ± 52 | 246 ± 51 | 255 ± 50 | 267 ± 53 | 0.153 | 0.118 |
| Estimated failure load, N | 11,497 ± 2364 | 11,711 ± 2268 | 12,153 ± 2233 | 12,883 ± 2512 | 0.085 | 0.070 |
| Apparent modulus, N/mm2 | 2159 ± 439 | 2146 ± 467 | 2239 ± 415 | 2113 ± 384 | 0.747 | 0.769 |
| 22.6 years | ||||||
| Total vBMD, mg HA/cm2 | 342 ± 51 | 342 ± 45 | 360 ± 41 | 348 ± 46 | 0.439 | 0.616 |
| Cortical vBMD, mg HA/cm2 | 883 ± 24 | 883 ± 29 | 894 ± 27 | 879 ± 36 | 0.252 | 0.573 |
| Trabecular vBMD, mg HA/cm2 | 219 ± 28 | 219 ± 30 | 228 ± 27 | 228 ± 30 | 0.405 | 0.260 |
| BV/TV, % | 18.3 ± 2.3 | 18.3 ± 2.5 | 19.0 ± 2.2 | 19.0 ± 2.5 | 0.406 | 0.261 |
| Tb.N, mm−1 | 2.06 ± 0.26 | 2.06 ± 0.21 | 2.18 ± 0.27 | 2.19 ± 0.40 | 0.128 | 0.118 |
| Tb.Th, μm | 89.4 ± 11.8 | 89.0 ± 9.7 | 87.8 ± 8.8 | 88.2 ± 11.9 | 0.929 | 0.780 |
| Tb.Sp, μm | 403 ± 56 | 403 ± 51 | 379 ± 64 | 383 ± 79 | 0.304 | 0.270 |
| Ct.Th, μm | 1346 ± 282 | 1372 ± 266 | 1439 ± 272 | 1401 ± 339 | 0.644 | 0.725 |
| CSA, mm2 | 834 ± 131 | 845 ± 110 | 821 ± 104 | 907 ± 166 | 0.055 | 0.104 |
| Stiffness, KN/mm | 308 ± 37 | 314 ± 39 | 318 ± 49 | 333 ± 54 | 0.123 | 0.131 |
| Estimated failure load, N | 14,487 ± 1767 | 14,686 ± 1741 | 14,915 ± 2196 | 15,654 ± 2611 | 0.119 | 0.109 |
| Apparent modulus, N/mm2 | 2759 ± 440 | 2786 ± 372 | 2887 ± 368 | 2761 ± 366 | 0.598 | 0.798 |
Values are means ± SDs. Values in bold are significant (P < 0.05). There is no statistical significance for comparison of bone variables between groups A and C. There is no statistically significant interaction between physical activity and protein intake on bone variables.
BV/TV, trabecular bone volume fraction; CSA, cross-sectional area; Ct.Th, cortical thickness; HA, hydroxyapatite; Tb.N, trabecular number; Tb.Sp, trabecular separation; Tb.Th, trabecular thickness; vBMD, volumetric bone mineral density.
aP by analysis of variance among all groups.
b+P comparison among groups B and D.
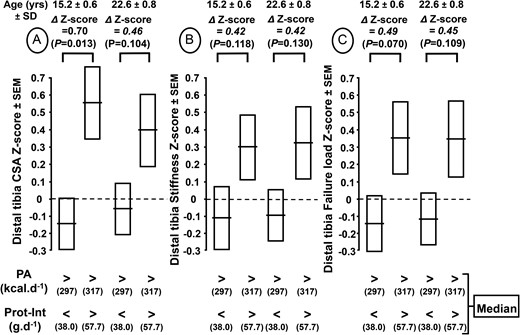
Cross-sectional area (CSA) (A), stiffness (B), and failure load (C) z scores of distal tibia measured at 15.2 and 22.6 years according to the physical activity (PA) and protein intake (Prot-Int) determined at 7.4 years. The cohort of 124 healthy boys was separated into 4 groups according to the medians of both PA and Prot-Int. The absolute values of CSA, stiffness, and failure load of the 4 groups in relation to both PA and Prot-Int are presented in Table 4. The z score difference (∆) with P levels for CSA, stiffness, and failure load between the 2 groups with high PA and either low or high Prot-Int are indicated above the brackets connecting the 2 corresponding bars.
Discussion
Main reported results
This study shows that, before pubertal maturation, environmental factors affecting skeletal development can modify structural and strength components of young adult bone. This more than 15-year prospective study, from 7.4 to 22.6 years, shows the tracking of interactive environmental determinants of peak bone mass and strength in a cohort of healthy males. It complements and corroborates findings of 2 previous reports that describe the positive effect of protein intake on the bone response to higher physical activity (5, 6). In these 2 previous analyses (5, 6) conducted in boys belonging to the same cohort, the protein but not the calcium intake influenced the bone impact of increased physical activity.
Tracking of bone development
Bone structure tracks during growth until PBM (1, 2, 21), a phenomenon most often ascribed to the well-known genetic determinant of PBM (4, 22). Familial resemblance in bone traits between premenopausal mothers and their daughters was shown to be expressed before the onset of pubertal maturation (23). Nevertheless, the trajectory of bone development can be influenced by factors other than those related to heritability.
Protracted influence of environmental factors affecting bone development
Mechanical factors
The protracted bone impact until adulthood of enhanced mechanical loading during childhood has been reported, particularly in young athletes involved in various competitive sports [for review, see Bonjour et al. (1), Daly (24), and Kontulainen et al. (25)].
Nutritional factors
A retrospective study suggests that milk intake during childhood and adolescence is positively associated with hip BMC in women aged 20 to 49 years (26).
There is evidence that before the onset of pubertal maturation, childhood years represent an opportune time for modifying the trajectory of bone development through lifestyle factors including mechanical loading and nutrition and, thereby, to favorably influence the structural and strength components of the so-called peak bone mass (1).
Biomechanical development of bone strength during growth
During childhood and adolescence, bone structure is altered in length and width. The main alteration in bone mass acquisition is an increase in size with a relatively small change in volumetric density [for review, see Kontulainen et al. (25), Bonjour et al. (27), and Rizzoli and Bonjour (28)]. Longitudinal bone growth is determined by the rate of endochondral ossification, a process that continues throughout childhood and undergoes an acceleration during the pubertal growth spurt. In this crucial growth period, the change in the velocity of bone mass accumulation lags behind that of standing height (29). This asynchrony is clearly demonstrated in the foregoing prospective cohort study since, at 15.2 years, the percentage of values measured at 22.6 years was about 10% less for FN BMC (86.9%) than for standing height (96.1%) (Table 1).
Variability in the individual responses to environmental factors
During growth, the bone response to either mechanical or nutritional intervention markedly varies from one child to another [for review, see Bonjour et al. (30)]. This variability suggests the involvement of genetic factors that might modulate the magnitude of the response to changes in environmental factors. This modulation could be related to bone gene polymorphisms, as suggested for the effects of either calcium supplement or exercise interventions (31–35). To our knowledge, whether the bone response to protein intake might be associated with some genetic variants has not yet been reported.
Implication of increased bone mass and strength in early adulthood
The substantial upward shift in the bone development trajectory by amendable environmental factors is of special interest since its outcome is an increased PBM and strength. Such an effect may reduce the risk of osteoporosis in later life, as bone features track not only during development but also over several decades during adult life (2, 3).
Protein vs calcium intake interaction with physical activity
As documented in 2 previous analyses made in participants belonging to the same cohort at a mean age of 7.4 and 15.2 years (5, 6), the positive effect of protein on bone traits contrasts with the noninfluence of dietary calcium (from 546–971 mg ⋅ d−1) in participants with a relatively high degree of physical activity (310 vs 169 kcal ⋅ d−1). The positive effect of protein intake in healthy prepuberal children who are regularly engaged in relatively high physical activity is in keeping with several observational or interventional studies carried out in adults of various ages combining resistance exercise and dietary protein ingestion [for reviews, see Phillips (36) and Wall et al. (37)].
Structural modification and possible mechanism in response to protein intake
With environmental factors combining high physical activity and high protein intake, the bone structural changes are characterized by an increase in both mineral content and width of the FN. With the same combination, an enlargement in the CSA and its derived perimeter without a reduction in the volumetric mineral density is documented in the distal tibia. Therefore, relatively high levels of both physical activity and protein intake are associated with an increment in the size of weight-bearing bones. Such a modification should confer a greater bone resistance to mechanical loading (38). Furthermore, these structural/macroarchitectural “modeling” changes might be more stable throughout adult life than other modifications of bone variables undergoing more active “remodeling” such as the trabecular framework. Protein intake increases bone growth in both longitudinal and cross-sectional dimensions. These effects could be mediated by insulin-like growth factor-I, which stimulates bone growth in these 2 axial directions [for review, see Bonjour et al. (1) and Bikle et al. (39)]. The effects of physical activity on several bone components (24) as well as the relationship between exercise training and insulin-like growth factor-I during childhood and adolescence (40) are also compatible with the bone structural alterations reported here.
In the 2 groups with relatively high physical activity, the greater structural (increased CSA) and mechanical resistance (increased stiffness and failure load) measured in the group with protein intake above vs below the median at 15.2 years tended to be maintained at 22.6 years. Since these 2 environmental factors were recorded at a mean age of 7.4 years, it strongly suggests that key bone characteristics measured in young adulthood can be modified by environmental factors when applied early during skeleton development. These results obtained in healthy males who were followed for more than 15 years are in keeping with the notion that prepuberty is an optimal time to intervene for improving bone health in the long term (1).
Strengths of the study
Several strengths can be mentioned: (1) a cohort of more than 120 healthy boys followed from a mean age of 7.4 to 22.6 years with an intermediate examination at mid-adolescence; (2) a group of participants with a narrow age range as documented by a standard deviation of <1 year at 7.4, 15.2, and 22.6 years; (3) a 15-year follow-up including the crucial years of bone development of weight-bearing bone from prepuberty to young adulthood once peak bone mass was attained; (4) measurements by DXA of proximal femur macrostructure combined with estimates of microstructure and strength by HR-pQCT and µFEA of distal tibia; (5) highlighting of the interaction of 2 environmental factors, physical activity and protein intake, that positively modify the trajectory of bone development from childhood to young adulthood; and (6) a plausible mechanistic hypothesis based on preclinical and clinical studies showing that protein intake enhances the impact of physical exercise on skeletal structure and strength.
Limitations of the study
Weaknesses that can be underlined are as follows: (1) both physical activity and protein intake were evaluated by frequency questionnaires, which are a method that cannot accurately measure the absolute energy expenditure due to physical activity or the actual amount of protein consumed. Nevertheless, this method enables one to compare intergroup differences in either physical activity or protein intake. (2) Energy intake was not assessed in this cohort; therefore, the impact of protein intake on bone variables could be related to a difference in energy intake. As previously discussed (5), the energy expenditure was measured by taking into account all kinds of physical activity and expressed in kcal/d. This measurement can be considered as reflecting the energy intake. Since the impact of relatively high vs low protein intake on bone mass, structure, and strength was revealed in participants expending the same amount of energy, it may be inferred that it was not related to the difference in the overall energy intake but rather to difference in the protein intake. (3) Another limitation is that technology that assesses the microstructure and mechanical resistance characteristics of a weight-bearing long bone, which was used when the cohort was aged 15.2 and 22.6 years, was not available when this cohort was aged 7.4 years. Therefore, it is not established that at 7.4 years of age, the impact of protein intake on distal tibia variables was already present.
Conclusions
Structural and mechanical characteristics were measured by DXA, HR-pQCT, and µFEA. Using these tools, the reported study carried out in a cohort of 124 healthy males prospectively followed from 7.4 to 22.6 years old demonstrates the crucial influence of protein intake in the response to enhanced physical activity on weight-bearing bones such as the proximal femur and distal tibia. The results further pinpoint the importance of prepubertal years for modifying the bone growth trajectory through environmental factors and, thereby, for achieving higher peak bone mass and strength in healthy male participants.
Abbreviations:
- BMC
bone mineral content
- CSA
cross-sectional area
- DXA
dual-energy X-ray absorptiometry
- FN
femoral neck
- HR-pQCT
high-resolution–peripheral computerized tomography
- PA
physical activity
- PBM
peak bone mass
- Prot-Int
protein intake
- μFEA
microfinite element analysis
Acknowledgments
We thank Giulio Conicella and the team of the Division of Nuclear Medicine for DXA and HR-pQCT measurements and François Herrmann for help with statistical analysis.
The Swiss National Science Foundation supported this study (grant 159985). This work was also funded in part by an unrestricted grant from the Carlos and Elsie De Reuter Foundation, which had no input into the study design or data analysis.
Author contributions: Study design: T.C., J.-P.B., S.F., and R.R. Data collection: F.M., M.-C.A., and T.C. Data analysis and drafting manuscript: T.C. and J.-P.B. Revising manuscript content and approving final version of manuscript: T.C., J.-P.B., F.M., M.-C.A., B.v.R., R.R., and S.F. All authors edited the paper.
Disclosure Summary: B.v.R. is consultant for Scanco Medical AG. The remaining authors have nothing to disclose.
References
Author notes
Address all correspondence and requests for reprints to: Thierry Chevalley, MD, Division of Bone Diseases, Geneva University Hospitals and Faculty of Medicine, Rue Gabrielle Perret-Gentil 4, CH–1205 Geneva, Switzerland. E-mail: [email protected].
