


Abstract
It is imperative that novel approaches to treatment of type 1 diabetes (T1D) are devised.
The objective of the study was to investigate whether addition of dapagliflozin to insulin and liraglutide results in a significant reduction in glycemia and body weight.
This was a randomized clinical trial.
The study was conducted at a single academic medical center.
Participants included T1D patients on liraglutide therapy for at least last 6 months.
Thirty T1D patients were randomized (in 2:1 ratio) to receive either dapagliflozin 10 mg or placebo daily for 12 weeks.
Change in mean glycated hemoglobin after 12 weeks of dapagliflozin when compared with placebo was measured.
In the dapagliflozin group, glycated hemoglobin fell by 0.66% ± 0.08% from 7.8% ± 0.21% (P < .01 vs placebo), whereas it did not change significantly in the placebo group from 7.40% ± 0.20% to 7.30% ± 0.20%. The body weight fell by1.9 ± 0.54kg (P < .05 vs placebo). There was no additional hypoglycemia (blood glucose < 3.88 mmol/L; P = .52 vs placebo). In the dapagliflozin group, there were significant increases in the plasma concentrations of glucagon by 35% ± 13% (P < .05), hormone-sensitive lipase by 29% ± 11% (P < .05), free fatty acids by 74% ± 32% (P < .05), acetoacetate by 67% ± 34% (P < .05), and β-hydroxybutyrate by 254% ± 81% (P < .05). Urinary ketone levels also increased significantly (P < .05). None of these changes was observed in the placebo group. Two patients in the dapagliflozin group developed diabetic ketoacidosis.
Addition of dapagliflozin to insulin and liraglutide in patients with T1D results in a significant improvement in glycemia and weight loss while increasing ketosis. If it is decided to use this approach, then it must be used only by a knowledgeable patient along with an endocrinologist who is well versed with it.
Abstract
Addition of dapagliflozin to insulin and liraglutide in patients with T1D results in a significant improvement in glycemia and weight loss while increasing ketosis.
In view of the fact that an overwhelming majority of patients with type 1 diabetes (T1D) are not at the glycemic goal of a glycated hemoglobin (HbA1c) of less than 7% (53 mmol/mmol), it is imperative that novel approaches to its treatment are devised (1, 2). We and others have recently used liraglutide, a glucagon-like peptide-1 (GLP-1) receptor agonist, to improve glycemic control in these patients (1–7). These agents have potent effects on glucose homeostasis, independently of β-cell stimulation. These β-cell-independent effects include the suppression of appetite, the slowing of gastric emptying, and the suppression of glucagon (5–7). Sodium-glucose co-transporter-2 (SGLT2) inhibitors block renal tubular reabsorption of glucose, induce glycosuria, and thus lower blood glucose concentrations. Indeed, short-term preliminary studies have already shown significant improvements in the glycemic levels in T1D patients after the use of these agents (8–11). A recent case series reported seven cases of euglycemic diabetic ketoacidosis (DKA) in patients with T1D on SGLT-2 inhibitor canagliflozin (12). A phase 2 trial also showed increased incidence of DKA (4.3%, 6.0%, 0%) with canagliflozin 100 and 300 mg vs placebo (13). DKA in this setting is believed to be due to a potential SGLT2 inhibitor-associated increase in glucagon, elevated free fatty acids (FFAs) inducing insulin resistance, and inadequate insulin to suppress hepatic ketogenesis in the setting of an acute illness and inadequate carbohydrate intake. However, this complication is absent in patients with T1D treated with liraglutide despite reductions in insulin doses. Preliminary data from another study also showed that liraglutide suppresses ketogenesis acutely (14).
In view of the above, we hypothesized that the addition of dapagliflozin, another SGLT-2 inhibitor to insulin and liraglutide (ie, triple therapy in T1D), would result in further improvement in glycemia without an increase in glucagon concentrations and mediators of ketosis.
Materials and Methods
This study is a single-center, randomized, placebo-controlled, double-blind, phase IV study conducted from August 2015 to December 2015 at the Diabetes and Endocrinology Center of Western New York at the University at Buffalo. The local institutional review board approved the study protocol. The trial is registered at https://clinicaltrials.gov/ (number NCT02518945). All patients provided written informed consent.
Patients were eligible for enrollment in the trial if they were adults 18–75 years of age with T1D; fasting c-peptide less than 0.1 nmol/L; on insulin therapy either via continuous subcutaneous insulin infusion (CSII) or multiple (four or more) injections of insulin per day for more than 12 months with or without a history of diabetic ketoacidosis. All were on liraglutide therapy at maximal tolerated doses for at least 6 months prior to start of the study and were willing to use continuous glucose monitoring (CGM). All had an HbA1c of 9.2% or less (97 mmol/mmol) and were well versed with carbohydrate counting. Exclusion criteria were T1D for less than 12 months; a coronary event or procedure (myocardial infarction, unstable angina, coronary artery bypass, surgery or coronary angioplasty) in the previous 3 months; hepatic disease (transaminase > 3 times normal) or cirrhosis; renal impairment (serum creatinine > 1.5 mg/dL); HIV- or hepatitis C-positive status; any other life-threatening, noncardiac disease; a history of pancreatitis; a history of bladder cancer; a history of gastroparesis; a history of medullary thyroid carcinoma or multiple endocrine neoplasia 2 syndrome; a family history of multiple endocrine neoplasia 2, a family history of medullary thyroid cancer, or a previous history of medullary thyroid cancer; women who were pregnant or of child-bearing potential not using adequate contraception; participation in any other concurrent clinical trial; use of an investigational agent or therapeutic regimen within 30 days of study; and an inability to give informed consent.
Patients who met the criteria were assigned a number by a computerized random number generation program (Microsoft office [Excel]) and randomized (in 2:1 ratio, drug: placebo) to receive either dapagliflozin 10 mg (20 patients) or placebo (10 patients) daily for 12 weeks. Ninety percent of the randomized patients initiated liraglutide treatment as a part of a research study at our center investigating its effects over a period of 6 months, and it was subsequently continued in our clinic setting. The remaining 10% initiated liraglutide treatment at our clinic. The subjects, study coordinators, and investigators who were involved in adjusting insulin and dapagliflozin doses were blinded to the treatment.
All patients were seen by a registered dietitian to ensure accurate recording of carbohydrate and dietary intake. All patients were advised to monitor their capillary blood glucose by finger stick before each meal and at bedtime and to wear their CGM for the entire duration of the study. Twenty-four-hour urine collections were made before and at the end of the study to assess glycosuria and ketonuria. Patients in the drug arm started on 5 mg of daily for 1 week followed by 10 mg daily of dapagliflozin for 11 weeks. Patients were seen weekly for the first 3 weeks, every 2 weeks until week 10, and then every week until the completion of the study at 12 weeks. Insulin doses were titrated to maintain target glucose concentrations between 3.8 and 8.8 mmol/L. All patients were educated to maintain adequate hydration, avoid alcohol use, and not miss their insulin dose.
All patients were blinded to their CGM (DEXCOM G4 system) including the patients who were already using unblinded CGM because CGM use alone has been shown to improve glycemic control, and this may undermine the effects of dapagiflozin (15). Furthermore, we undertook this step to ensure that all patients had similar data availability from finger stick glucose tests. We have previously found that the provision of CGM, especially to novices, leads to frequent interference/variations in insulin rates. All patients were allowed to see the downloaded CGM reports at the end of their weekly or two-weekly visits, and this was discussed with them along with their finger stick blood glucose concentrations and food diaries for patients on multiple daily injections (MDIs). In addition, the downloaded insulin pump reports were also discussed with patients on CSII. None of the randomized patients were on Enlite 530 G System with threshold suspend.
Average weekly glucose, fasting glucose, SD, and percentage time spent in different glycemic thresholds were obtained from CGM. Insulin doses, carbohydrate intake (grams), and carbohydrate helpings (frequency of eating) were obtained from insulin pump and patient food/insulin dose/blood glucose diaries for patients on CSII and MDIs, respectively. These parameters were measured every week, whereas blood pressure (BP) was measured at weeks 1, 2, 3, 5, 7, 9, 10, 11, and 12. BP was measured manually after 10 minutes in sitting position and average of three BP readings were obtained at each visit. The SD in CGM represents the variability of blood glucose concentrations.
The primary end point of the study was the change in mean HbA1c after 12 weeks of dapagliflozin, compared with placebo. The change in insulin dose, percentage time spent in different glycemic ranges (3.8–8.8 mmol/L, ie, 70–160 mg/dL; 8.8–13.3 mmol/L, ie, 160–240 mg/dL; 13.3–22.25 mmol/L, ie, 240–400 mg/dL; 3.05–3.88 mmol/L, ie, 55–70 mg/dL; <3.05 mmol/L, ie, 55 mg/dL), SD (measure of variability in blood glucose concentrations), body weight, systolic BP, carbohydrate intake, and the mediators of ketosis were secondary end points.
Plasma and urine measurements
Serum and plasma samples were prepared from whole blood within 30 minutes and stored at −80°C until analysis. Urine (24 h) samples were centrifuged and clear supernatant stored at −80°C until analysis. Ketone bodies were measured using commercially available kits for β-hydroxybutyrate (Cayman Chemicals) and for acetoacetate (Biovision,). Glucose levels were measured in plasma by YSI 2300 STAT Plus glucose analyzer (Yellow Springs Instruments). FFA levels were measured by a colorimetric assay (Roche). Glucagon was measured using an ELISA kit (R&D Systems Inc) from samples collected in and protease inhibitor cocktail (Sigma) to prevent GLP-1 and other peptide degradations. A hormone-sensitive lipase (HSL) assay in plasma was measured using an ELISA (LifeSpan Biosciences, Inc).
Statistical methods
There are no previous randomized studies that have examined the effects of dapagliflozin as additional treatments to insulin and liraglutide in patients with T1D. Conservatively estimating a difference in mean HbA1c (the primary end point) of 0.5% before and after the treatment, and a sample size of 30 (2:1 drug to placebo ratio) should provide adequate power (β = .8) to detect a significant difference (α = .05) provided the standard deviation of the residuals in not greater than 0.4%. The sample size includes an additional 20% to account for the potential dropout.
Data are presented as mean ± SEM. The combination of dapagliflozin, liraglutide, and insulin is referred to as the triple therapy. Final analysis was done based on an intention-to-treat principle. A Student's t test was used to compare baseline characteristics (Table 1) of the two groups (dapagliflozin and placebo groups) and to compare the change in mean weekly blood glucose concentrations, percentage of time spent in different glycemic thresholds, insulin doses, body weight, body mass index (BMI), carbohydrate intake, and BP in the dapagliflozin group compared with placebo. A χ2 test was used to test difference in proportions and frequency of hypoglycemic episodes. Changes in these end points were calculated by averaging the differences in weekly average values from baseline. Pearson correlation was used to test the relationships among variables. All end points were normally distributed. A value of P < .05 was considered significant. SPSS Software (SPSS, Inc) was used for analysis.
Baseline Characteristics of Patients in the Study Groups
| Parameters | Baseline Characteristics | ||
|---|---|---|---|
| Placebo (n = 9) | Triple Therapy (n = 17) | P Value | |
| Mean age, y | 52 ± 3 | 55 ± 3 | .52 |
| Age at T1D diagnosis, y | 27 ± 2 | 30 ± 3 | .59 |
| Duration of T1D, y | 31 ± 5 | 25 ± 3 | .48 |
| Gender (M/F) | 3/6 | 7/10 | 1.00a |
| HbA1c, % | 7.40 ± 0.20 | 7.80 ± 0.21 | .28 |
| HbA1c, mmol/mmol | 57 ± 2.2 | 62 ± 2.3 | |
| Average glucose (CGM) | |||
| CGM, mmol/L | 9.32 ± 0.49 | 9.16 ± 0.38 | .60 |
| CGM, mg/dL | 168 ± 9 | 165 ± 7 | |
| Fasting glucose (mmol/L) (CGM) | |||
| CGM, mmol/L | 8.43 ± 0.55 | 8.38 ± 0.55 | .97 |
| CGM, mg/dL | 152 ± 10 | 151 ± 10 | |
| SD (CGM) | |||
| SD, mmol/L | 3.99 ± 0.22 | 3.82 ± 0.22 | .67 |
| SD, mg/dL | 72 ± 4 | 69 ± 4 | |
| Coefficient of variation, % | 43 ± 2 | 42 ± 2 | .94 |
| Body weight, kg | 79 ± 3.8 | 85 ± 3.8 | .30 |
| BMI, kg/m2 | 27 ± 2 | 31 ± 1 | .09 |
| Total insulin dose, U | 44.7 ± 10.2 | 59.8 ± 7.6 | .26 |
| Basal insulin dose, U | 23.3 ± 4.5 | 33.70 ± 4.53 | .16 |
| Bolus insulin dose, U | 26 ± 4.1 | 26 ± 4.1 | .54 |
| Systolic BP, mm Hg | 121 ± 4 | 123 ± 2 | .69 |
| Diastolic BP, mm Hg | 78 ± 2 | 75 ± 2 | .42 |
| Pulse rate, bpm | 75 ± 3 | 81 ± 3 | .14 |
| CGM, mmol/L (milligrams per deciliter) | |||
| <3.05 mmol/L (55) | 5.5 ± 2.0 | 4.7 ± 1.4 | .74 |
| 3.05–3.88 mmol/L (55–70) | 3.8 ± 0.5 | 4.2 ± 0.8 | .62 |
| 3.8–8.8 mmol/L (70–160) | 37.8 ± 5.8 | 44.3 ± 4.0 | .35 |
| 8.8–13.3 mmol/L (160–240) | 31.4 ± 2.7 | 32 ± 2.5 | .85 |
| 13.3–22.25 mmol/L (240–400) | 27.0 ± 3.7 | 15.6 ± 3.2 | <.05 |
| Episodes of hypoglycemia per total number of SMBG readings, incidence % | |||
| <3.05 mmol/L (55 mg/dL) | 0/28 (0) | 1/30 (3) | 1.00b |
| 3.05–3.88 mmol/L (55–70 mg/dL) | 1/28 (4) | 2/30 (7) | 1.00b |
| Number of patients with hypoglycemia per total number of patients | |||
| <3.05 mmol/L (55 mg/dL) | 1/9 | 9/17 | .22b |
| 3.05–3.88 mmol/L (55–70 mg/dL) | 3/9 | 9/17 | .71b |
| Lipid panel | |||
| Total cholesterol | 176 ± 11 | 167 ± 8 | .56 |
| LDL | 89 ± 8 | 90 ± 7 | .91 |
| HDL | 71 ± 10 | 60 ± 4 | .19 |
| Triglycerides | 82 ± 11 | 87 ± 10 | .78 |
| eGFR | 97 ± 7 | 83 ± 4.0 | <.05 |
Abbreviations: eGFR, estimated glomerular filtration rate; F, female; HDL, high-density lipoprotein; M, male. SD indicates the variability of blood glucose concentrations.
χ2 test.
Fisher exact t test.
Results
Twenty-six patients completed the study (placebo = 9, 10% dropout rate; dapagliflozin = 17, 15% dropout rate). Baseline characteristics of study subjects are presented in Table 1. Both groups had similar age, duration of T1D, BMI, glycemic control, total insulin dose, and BP. All patients had a history of at least one previous episode of DKA. All randomized patients had nondetectable C-peptide concentrations and were on CSII with insulin pumps except one in the placebo group on MDIs. All randomized patients, except two were on 1.8 mg of liraglutide for 7 ± 1 months. Two patients were on 1.2 mg of liraglutide. There were 24 Caucasian, one African American, and one Asian patient.
Effect of triple therapy on glycemic control
HbA1c in triple therapy group fell by 0.66% ± 0.08% (7.2 ± 0.9 mmol/mmol) and the dapagliflozin group from 7.8% ± 0.21% (62 ± 2.3 mmol/mmol) (P < .01 vs placebo), whereas there was no significant change in the placebo group (from 7.40% ± 0.20%, ie, 57 ± 2.2 mmol/mmol, to 7.30% ± 0.20%, ie, 56 ± 2.2 mmol/mmol).
The mean weekly glucose concentration fell in the triple therapy group by 0.83 ± 0.33 mmol/L, ie, 15 ± 6 mg/dL (P < .05 vs baseline, P = .07 vs placebo), with no significant change in placebo group. The incidence of hypoglycemia, defined as glucose less than 55 mg/dL, remained unchanged in the placebo and triple therapy groups at 0% and 3%, respectively, whereas that in the range of 55–70 mg/dL remained unchanged at 4% and 7%, respectively (Tables 1 and 2). There was no severe hypoglycemic episode requiring hospitalization or urgent medical attention in both groups (Table 2). The change in HbA1c was related to the baseline HbA1c (r = 0.87, P < .0001) in the triple therapy group. Change in plasma glucose was related to a change in glucagon (r = 0.50; P < .05) in the triple therapy group.
Effect of Triple Therapy (Dapagliflozin Plus Liraglutide and Insulin Treatment) on Glycemic Control, Body Weight, Insulin Dose, BP, Lipid Profile, and eGFR
| Parameters | Change After 12 Wk | P Value | |
|---|---|---|---|
| Placebo (n = 9) | Triple Therapy (n = 17) | ||
| Average glucose (CGM) | |||
| mmol/L | 0.04 ± 0 | −0.83 ± 0.33 | .07 |
| mg/dL | 3.1 ± 6 | −15 ± 6 | |
| HbA1c, % | 0 ± 0.2 | −0.66 ± 0.08 | <.01 |
| mmol/mmol | 0 ± 2.2 | −7.2 ± 0.9 | |
| Fasting glucose (CGM) | |||
| mmol/L | 0.27 ± 0.83 | −0.72 ± 0.61 | .35 |
| mg/dL | 5 ± 15 | −13 ± 11 | |
| Glucose SD (CGM) | |||
| mmol/L | −0.02 ± 0.04 | −0.5 ± 0.27 | .16 |
| mg/dL | 2 ± 6 | −9 ± 5 | |
| Coefficient of variation, % | 2 ± 3 | 2 ± 2 | 016 |
| Total insulin dose, U | 0.1 ± 2.4 | −3.5 ± 1.9 | .29 |
| Basal insulin dose, U | 1.9 ± 0.5 | −0.72 ± 0.96 | <.05 |
| Bolus insulin dose, U | −1.8 ± 2.4 | −2.8 ± 2.3 | .79 |
| Time spent at BG concentrations, % | |||
| CGM: mmol/L (mg/dL) | |||
| <3.05 mmol/L (55) | −0.1 ± 0.4 | −1.5 ± 1.0 | .15 |
| 3.05–3.88 mmol/L (55–70) | 0.3 ± 0.4 | 0.4 ± 1.0 | .52 |
| 3.8–8.8 mmol/L (70–160) | −1.4 ± 1.0 | 10 ± 4 | .12 |
| 8.8–13.3 mmol/L (160–240) | −0.5 ± 2.1 | −4.2 ± 3.7 | .27 |
| 13.3–22.25 mmol/L (240–400) | −6.9 ± 4.5 | −6 ± 2.5 | .82 |
| Episodes of hypoglycemia per total number of SMBG readings, incidence % | |||
| <3.05 mmol/L (55 mg/dL) | 0/28 (0) | 1/30 (3) | .53a |
| 3.05–3.88 mmol/L (55–70 mg/dL | 1/28 (4) | 2/30 (7) | .69a |
| Patients with hypoglycemia per total number of patients, n | |||
| <3.05 mmol/L (55 mg/dL) | 3/9 | 9/17 | .74a |
| 3.05–3.88 mmol/L (55–70 mg/dL) | 2/9 | 10/17 | .44a |
| Body weight, kg | 0.7 ± 1.5 | −1.9 ± 0.54b | <.05 |
| BMI, kg/m2 | −0 ± 0.2 | −1 ± 0.6b | <.05 |
| SBP, mm Hg | 0 ± 4 | 0 ± 2 | .91 |
| DBP, mm Hg | −3 ± 3 | 3 ± 2 | .15 |
| Pulse rate | −6 ± 3 | −6 ± 3 | 094 |
| Lipid panel | |||
| Total cholesterol | −19 ± 5 | 11 ± 5 | <.01 |
| LDL | −15 ± 5 | 7 ± 4 | <.01 |
| HDL | −3 ± 5 | 2 ± 1 | .82 |
| Triglycerides | −2 ± 4 | 2 ± 8 | .65 |
| eGFR | 0 ± 5 | −7 ± 2 | .21 |
Abbreviations: DBP, Diastolic BP; eGFR, estimated glomerular filtration rate; HDL, high-density lipoprotein; SBP, Systolic BP. Data are presented as mean ± SE. All P values are comparing change in triple therapy group vs placebo.
Fisher's exact t test.
P < .05 for change compared with baseline within group (paired t test).
The mean absolute total insulin dose (Tables 1 and 2) remained unchanged in both groups. When adjusted for body weight, the total insulin dose remained unchanged also in the placebo and triple therapy groups at 0.6 ± 0.1 U/kg and 0.7 ± 0.1 U/kg, respectively, both at baseline and at 12 weeks. The correctional bolus dose of insulin in triple therapy group was diminished but not significantly (from 5.2 ± 1.9 to 3.0 ± 0 U, P = .14, vs baseline; P = NS vs placebo).
Effect on mediators of ketosis, ketones, and glycosuria
There was a significant increase in fasting glucagon concentrations by 35% ± 13% (from 91 ± 12 to 114 ± 19 pg/mL, P < .05), HSL by 29% ± 11% (from 4.95 ± 0.66 to 6.32 ± 0.75 ng/mL, P < .05), FFAs by 74% ± 32% (from 0.34 ± 0.04 to 0.59 ± 0.11 mM; P < .05), acetoacetate by 67% ± 34% (from 0.32 ± 0.09 to 0.53 ± 0.11 mM, P < .05), and β-hydroxybutyrate by 254% ± 81% (from 0.11 ± 0.02 to 0.39 ± 0.09 mM, P < .05), whereas there was no change in the placebo group (Figure 1, A–E). Glycerol trended higher (from 11.2 ± 2.4 to 13.6 ± 3.5 mg/L, P = NS) in the triple therapy group, whereas there was no change in the plasma bicarbonate concentrations. Urinary total ketone (acetoacetate and β-hydroxybutyrate) levels also increased significantly from 0.68 ± 0.19 to 1.28 ± 0.34 μM/mg creatinine (P < .05, Figure 1F). Fasting serum β-hydroxybutyrate levels were related to FFA concentrations (r = 0.374, P < .05) and inversely to total insulin dose at 12 weeks (r = −0.297, P < .05) but not to HSL or glucagon levels. Changes in mean the FFA concentrations were related to a change in the mean glucagon (r = 0.51, P < .05) and a change in mean β-hydroxybutyrate (r = 0.76, P < .001).
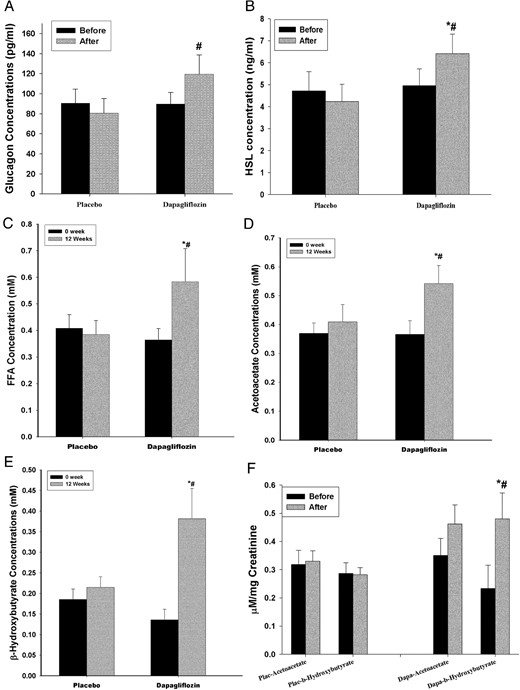
Change in plasma glucagon (A), HSL (B), FFAs (C), acetoacetate (D), β-hydroxybutyrate (E), and urinary ketones (F) in T1D patients on liraglutide and insulin therapy before and after 12 weeks of treatment with dapagliflozin 10 mg (n = 17) or placebo (n = 9).
Data are presented as mean ± SE. *, P < .05 compared with baseline; #, P < .05 compared with placebo.
Twenty-four-hour urinary glucose increased by 66.9 ± 4.7 g/d from a baseline of 2.4 g/d (P < .001) after dapagliflozin when compared with 2.1 ± 1.1 g/d in the placebo group in whom it remained unchanged. Urinary volume increased by 500 ± 140 mL/d (P < .01).
Effect on body weight
Body weight fell by 1.9 ± 0.54 kg (P < .05 vs placebo) in the triple therapy group, whereas it remained unchanged in the placebo group. Fourteen of 17 patients on triple therapy lost weight; two patients gained 0.22 kg, whereas one patient had unchanged weight.
Effect on BP and lipids
The total cholesterol and low-density lipoprotein (LDL) cholesterol increased by 6% and 8% from 167 ± 8 and 90 ± 7 mg/dL (P < .01 vs placebo for both) in the dapagliflozin group, whereas it decreased by 11% and 17% in the placebo group (P < .05 for both vs baseline) from 176 ± 11 and 89 ± 8 mg/dL, respectively. Systolic and diastolic BP remained unchanged.
Adverse effects
Two patients in the dapagliflozin group suffered from DKA within a day after increasing the dose of dapagliflozin to 10 mg and were withdrawn from the study. Both patients had an arterial pH of less than 7.10. They did not have malfunction of their insulin pump. Both were appropriately rehydrated, treated with iv insulin, and reverted to the combination of insulin and liraglutide without any further DKA episodes, in the long term. The descriptions of these two cases are as follows.
Patient A (Figure 2A)
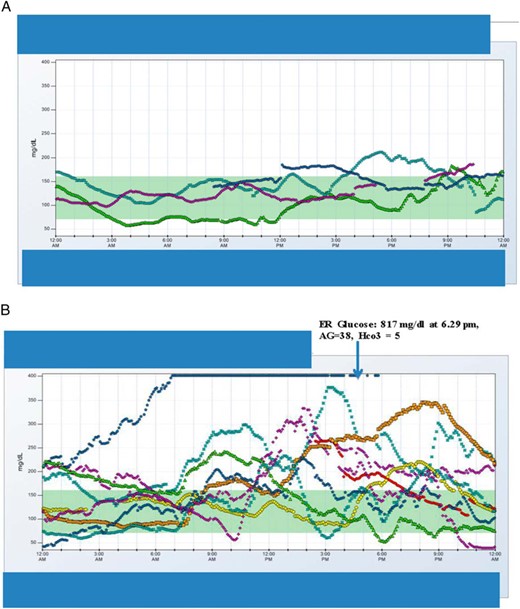
CGM data of patient A during a euglycemic DKA episode (A) and CGM data for patient B 1 day before and during hyperglycemic DKA (B) are shown.
For the patient with euglycemic DKA, at the time of hospital admission for DKA, she reported symptoms consistent with upper respiratory tract infection along with cough with clear sputum production, body aches, and joint pains for about a week. She attributed this to a viral illness because her other family members (two children and a husband) developed diarrhea in the same week. Her blood glucose concentrations were less than 8.88 mmol/L, ie,160 mg/dL. While on liraglutide previously, she had experienced a marked reduction in total insulin dose (from 48 U, ie, 0.56 U/kg to 33 U, ie, 0.45 U/kg). With the addition of dapagliflozin 5 mg, insulin requirements fell from 33 U (0.45 U/kg) to 26 U (0.35 U/kg) daily. Her carbohydrate intake had been reduced from 70 g/ to 37 g/ while on liraglutide. With the addition of dapagliflozin, it increased from 37 to 50 g in first week and to 95 g in second week. She had 13 kg weight loss while on liraglutide.
Patient B (Figure 2B)
For this patient with hyperglycemic DKA, she reported not feeling well with nausea 3–4 hours after taking 10 mg of dapagliflozin and subsequently began vomiting, which continued until the next day. Blood glucose levels fluctuated between 50 and 300 mg/dL throughout this day (Figure 2B). The blood glucose levels overnight increased until it consistently read high (Figure 2B, single pointed arrow), and she also felt weak and dizzy upon walking. She was severely hyperglycemic for approximately 30 hours before she decided to go to the hospital emergency department where DKA was diagnosed and she was treated with iv fluids and insulin. Her total insulin dose had fallen from 32.5 U to 26 U while on liraglutide treatment (but unchanged in terms of units per kilogram at 0.5 U/kg daily). After the addition of dapagliflozin, the total dose remained unchanged at 26 U (0.5 U/kg). Her carbohydrate intake had remained essentially unchanged at around 162 ± 40 g while on liraglutide and with subsequent addition of dapagliflozin. She had 12 kg weight loss with liraglutide.
Two female patients in the dapagliflozin group had one episode of genital mycotic infection each, which was treated with fluconazole.
Discussion
Our data demonstrate clearly that the addition of dapagliflozin to the combination of liraglutide and insulin (triple therapy) over a period of 12 weeks resulted in additional improvement in glycemic control with a reduction in HbA1c of 0.66% (7.2 mmol/mmol), a fall in mean blood glucose concentration with no significant increase in hypoglycemia (<3.88 mmol/L, ie, 70 mg/dL). This could, in part, be due to marked improvements in hyperglycemic spikes after the induction of glycosuria with dapagliflozin. In addition to the improvement in glycemia, there was weight loss of 1.9 kg. The dose of insulin did not diminish significantly in the entire group, except in one patient, who later developed DKA. Blood pressure did not change either.
Our data also show that the addition of dapagliflozin to insulin and liraglutide was associated with DKA in two patients. This is consistent with the recent reports of DKA after the use of other SGLT2 inhibitors in patients with T1D. To analyze further the pathogenesis of this phenomenon, we investigated whether they had an increase in lipolysis and ketogenesis, especially in view of the fact that the administration of this drug has been shown to induce hyperglucagonemia in patients with type 2 diabetes mellitus (16). Indeed, we found that the fasting concentrations of glucagon, HSL, FFAs, glycerol, acetoacetate, and β-hydroxybutyrate were increased significantly after the administration of dapagliflozin. It would thus appear that dapagliflozin-triggered glucagon release induced an increase in HSL, which, in turn, induced lipolysis and an increase in FFAs, which provided the substrate for ketogenesis at the hepatic level. The magnitude of the increase in acetoacetate concentrations was approximately 67%, whereas that of β-hydroxybutyrate was by greater than 250% over the baseline, paralleled by increases in urinary acetoacetate and β-hydroxybutyrate concentrations. The concentrations of acetoacetate and β-hydroxybutyrate were still far below those observed in DKA. The fact that both plasma and urinary ketone concentrations increased simultaneously implies that ketogenesis increased markedly, contrary to the suggestion that ketosis may be due to a diminution in urinary ketone excretion (17). Despite the increase in glucagon induced by dapagliflozin in triple therapy, liraglutide is still working through the suppression of appetite and possibly an insulin-sensitizing action (3, 7, 18).
The limitation of our study is that patients who were on unblinded CGM prior to start of study were blinded during the study period, which may potentially increase the incidence of hypoglycemia; however, it was not seen in our study. Furthermore, the outcomes in those who were blinded after having been on CGM before were not different from those given blinded CGM for the first time. The mechanism explaining less hypoglycemia despite good glycemic control in triple therapy group is unclear and needs further investigation.
The two patients who developed ketoacidosis had significant reductions in insulin doses while on liraglutide therapy, even prior to adding dapagliflozin, and this factor probably contributed to enhanced ketogenesis and eventual ketoacidosis. We therefore posit that the pathogenesis of DKA in these patients was due to the ketogenic effect of dapagliflozin, which was accelerated further by the lack of insulin, inadequate carbohydrate intake, and a precipitating infectious illness in one of our two patients. These factors may also be relevant to the occurrence of DKA with other drugs of this class, canagliflozin and empagliflozin. We had used a dose of 10 mg dapagliflozin to maximize its therapeutic benefit, but because of the potential ketogenesis, which could be dose dependent, we suggest using lower doses of SGLT2 inhibitors in T1D. It is relevant that in our large series of patients with T1D treated with the combination of insulin and liraglutide, we have observed no increase in DKA despite a reductions in insulin doses. In fact, our recent data show that even a single dose of liraglutide has an inhibitory effect on ketogenesis (14). It would thus appear that the ketogenic effect of dapagliflozin overwhelms the suppressive action of liraglutide on this process.
The combination of a reduction in glycemia and body weight implies a reversal in two cardinal features of the metabolic syndrome and hence should result in the overall cardiovascular risk in these patients in addition to the risk for microvascular complications. However, there was a small increase in LDL cholesterol concentrations. In this context, it is relevant to mention that empagliflozin, another SGLT2 inhibitor, has recently been shown to be effective in reducing cardiovascular mortality (19) and the deterioration of diabetic nephropathy (20). Whether dapagliflozin also has such an effect is currently the subject of investigation.
In conclusion, our data demonstrate that the addition of dapagliflozin to insulin and liraglutide results in a significant improvement in glycemia as reflected in both HbA1c and glucose concentrations as assessed by CGM. In addition, there is significant weight loss. These actions provide the basis for further larger prospectively controlled trials to establish the use of this combination in the treatment of this condition. However, there is also a concomitant increase in plasma glucagon concentrations, HSL, lipolysis, FFA concentrations, and ketogenesis, with an increase in acetoacetate and β-hydroxybutyrate concentrations. This metabolic milieu in association with marked reductions in insulin doses may set the stage for DKA. A better understanding of these mechanisms will allow us to further understand the strategy for the effective and safe use of these agents in T1D without the occurrence of untoward side effects like DKA.
Acknowledgments
We thank research volunteers Ajantha Nithi and Mahesh Kumar (University at Buffalo) for their help in the execution of the study.
Author contributions included the following: N.D.K., P.D., and H.G. conceived the study concept and design. N.D.K. spearheaded the conduct of the study, contributed in the recruitment of the study participants, titration of the insulin doses, and the management of the patients. N.D.K. and H.G. performed the statistical analysis and interpretation of the data. N.D.K., P.D., and H.G. wrote the manuscript, while A.C., A.Ma., and M.B. reviewed and edited the manuscript and contributed to the discussion. A.Me., J.H., M.G., S.K., and B.T. were involved with the conduct of the study and the management of the patients including the handling of the continuous glucose monitoring data on glycemia. N.D.K., H.G., and P.D. take full responsibility for the work as a whole, including the study design, access to the data to all the authors, and the decision to submit and publish the manuscript.
This study had a clinical trial number of NCT02518945.
Disclosure Summary: N.D.K. is on the speaker panel for Novo Nordisk and Astra Zeneca; A.C. is on the speaker panel for Novo Nordisk and Astra Zeneca; P.D. does research support for GlaxoSmithKline, Novo Nordisk, Bristol Meyer Squibb, Takeda Pharmaceuticals, Allergan, Sanofi-Aventis, Conjuchem, Dannipon Pharmaceutical, Procter and Gamble Pharma, Mitsubishi, Quigley Pharma Inc, Solvay Pharmaceuticals, Transition Therapeutics, and ToleRx and honorarium for Eli Lilly, Novartis, GlaxoSmithKline, Merck, Novo Nordisk, Takeda, Sanofi-Aventis Grants, National Institutes of Health, GlaxoSmithKline, Centers for Disease Control and Prevention, Bristol Meyers Squibb, Novartis Pharmaceuticals, Abbott Labs, Takeda Pharmaceuticals, Sankyo Pharmaceuticals North America, and Oishei Foundation. The other authors have nothing to disclose.
Abbreviations
- BMI
body mass index
- BP
blood pressure
- CGM
continuous glucose monitoring
- DKA
diabetic ketoacidosis
- FFA
free fatty acid
- GLP-1
glucagon-like peptide-1
- HbA1c
glycated hemoglobin
- HSL
hormone-sensitive lipase
- LDL
low-density lipoprotein
- MDI
multiple daily injection
- SGLT2
sodium-glucose co-transporter-2
- T1D
type 1 diabetes.
