


Abstract
Anti-Müllerian hormone (AMH) reduces aromatase activity and sensitivity of follicles to FSH stimulation. Therefore, elevated serum AMH may indicate a higher threshold for response to ovulation induction in women with polycystic ovary syndrome (PCOS).
This study sought to determine the association between AMH levels and ovulatory response to treatment among the women enrolled into the Pregnancy in PCOS II (PPCOS II) trial.
This was a secondary analysis of data from a randomized clinical trial in academic health centers throughout the United States
A total of 748 women age 18–40 years, with PCOS and measured AMH levels at baseline, were included in this study.
Couples were followed for up to five treatment cycles to determine ovulation (midluteal serum progesterone > 5 ng/mL) and the dose required to achieve ovulation.
A lower mean AMH and AMH per follicle was observed among women who ovulated compared with women who never achieved ovulation during the study (geometric mean AMH, 5.54 vs 7.35 ng/mL; P = .0001; geometric mean AMH per follicle, 0.14 vs 0.18; P = .01) after adjustment for age, body mass index, T, and insulin level. As AMH levels increased, the dose of ovulation induction medication needed to achieve ovulation also increased. No associations were observed between antral follicle count and ovulation.
These results suggest that high serum AMH is associated with a reduced response to ovulation induction among women with PCOS. Women with higher AMH levels may require higher doses of medication to achieve ovulation.
Abstract
High baseline serum AMH was associated with a reduced response to ovulation induction among women with PCOS; women with higher AMH levels may require higher doses of medication to achieve ovulation.
Anti-Müllerian hormone (AMH) is a dimeric glycoprotein member of the TGF-β family. In women, AMH is derived primarily from preantral and early antral follicles and has been shown in recent years to accurately reflect the follicular pool (1–3). Although the AMH level is used to assess the ovarian reserve in many scenarios, it has served most commonly to assess the likelihood of an adequate response during ovarian stimulation for assisted reproduction (4–8). In this context, AMH is predictive of the number of oocytes retrieved (9–15), and increasingly is being used to guide selection of the stimulation protocol (16–20).
During the last decade, serum AMH has also been evaluated in women with polycystic ovary syndrome (PCOS). Women with this disorder have an increased follicular pool and frequently present with oligo- or anovulation. Since 2003, the diagnostic criteria for PCOS has included an assessment of the follicular pool by specific ultrasound findings (21). There is support for the notion that AMH serves as a surrogate marker for the antral follicle count in the diagnosis of PCOS (22–28), and it has been posited that elevated AMH due to follicular excess, rather than facilitating ovulation, plays a critical role in the arrest of follicular growth that is characteristic of PCOS (29, 30).
An association between the high circulating AMH in women with PCOS and their chronic anovulation has long been noted, and seems to be due to several mechanisms. First, AMH directly inhibits aromatase activity in human and rodent granulosa cells (31–33). Further, Durlinger noted in an in vitro mouse model that direct culture with AMH inhibited the start of follicle growth from the pool of resting primordial follicles and attenuated FSH-stimulated preantral follicle growth (34). In vitro studies with human granulosa cells have shown an inhibition of aromatase activity and reduced follicular response to FSH in the presence of AMH (32, 35). Thus, excess AMH inhibits estradiol production and FSH action, stalling the FSH/E2-induced feed-forward loop that further increases the cellular FSH receptor and allows follicles to grow and mature. In this manner, it can be conceptualized that excess AMH is detrimental to the process of folliculogenesis.
Our objective was to evaluate the association between AMH level and ovulation in PCOS patients randomly assigned to treatment with either clomiphene citrate or letrozole. We hypothesized that a higher AMH level would be associated with lower ovulation rates in response to ovulation induction, and for those who did ovulate, that a higher AMH level would be associated with greater medication dose requirements to achieve ovulation.
Materials and Methods
Design and target population
This is a secondary analysis utilizing data from the PPCOS II trial, a multicenter, double-blind, randomized clinical trial (36, 37) comparing ovulation and live-birth rate in response to treatment with escalating doses of clomiphene citrate or letrozole for up to a total of five cycles. We have previously reported baseline AMH levels (38) and their change at end of study (36). The trial was registered on ClinicalTrials.gov as number NCT00719186. Each participating center's Institutional Review Board approved the study, and participants provided written informed consent. A Data Safety and Monitoring Board (DSMB) provided oversight.
The study design, methods, inclusion, and exclusion criteria have been described in detail elsewhere (36–38). In brief, 750 women with PCOS who were actively seeking pregnancy were enrolled. Females were between 18 and 40 years, with anovulation (defined as menstrual interval at least 45 days and/or ≤ 8 menses/y), combined with either hyperandrogenism (hirsutism or hyperandrogenemia) or polycystic appearing ovaries by ultrasound according to the Rotterdam criteria (39). Documentation of tubal patency was required, as well as a semen analysis with at least 14 million sperm per milliliter for the male partners. Exclusion criteria included contraindications to clomiphene or letrozole, poorly controlled diabetes, previously undiagnosed liver dysfunction, renal disease, significant anemia, history of thromboembolic events, or uncontrolled hypertension. Participants were randomly assigned to receive either an initial oral dose of 50 mg of clomiphene citrate or 2.5 mg of letrozole for 5 days per menstrual cycle and for up to five treatment cycles. The dose was increased in subsequent cycles in cases of nonresponse (midluteal progesterone < 3 ng/mL) or poor ovulatory response (progesterone levels indicative of ovulation but with values clustering just above the cutoff) (36–38), up to a maximum of 150 mg/d of clomiphene citrate or 7.5 mg/d of letrozole, both given for 5 days.
Data collection
Demographics and reproductive history were obtained using standardized forms, and waist circumference was measured to the nearest 0.1 cm. The degree of hirsutism was assessed at baseline using the modified Ferriman-Gallwey method (40). Fasting blood collected at baseline was used for all hormonal assays (38). Samples were batched and analyzed at the Ligand Assay and Analysis Core Laboratory at the University of Virginia. AMH was analyzed on samples stored at –80°C for approximately 13 months, using the Beckman-Coulter Gen 2 ELISA assay with no predilution. The sensitivity of the assay was to 0.25 ng/mL, with a range of 0.25–15 ng/mL. The interassay coefficient of variation was 7.0%, and the intraassay coefficient of variation was 3.0% (38). AMH levels were available for 748 of the 750 women enrolled onto the trial, and the data from the remaining 748 women were analyzed below. Insulin and LH were measured using the Immulite assay (Siemens Diagnostics), with all intra- and interassay coefficients of variation less than 6.2% (38). Fasting glucose levels were determined on a glucose analyzer using the glucose oxidase method, with all intra- and interassay coefficients of variation less than 1.5% (38). Insulin resistance (homeostasis model assessment for insulin resistance [HOMA-IR]) was calculated based on the homeostasis model (41). Total T was measured by RIA (Siemens Diagnostics), with intra- and interassay coefficients of variation less than 7.1% (38). This assay has been shown to have similar precision and quality control measures as commonly used liquid chromatography–tandem mass spectrometry assays of total T (42). Antral follicle count, which included both the left and right ovaries, was assessed during transvaginal ultrasound (using a 5–9-mHz vaginal probe, most centers used 5 mHz) at baseline, using standardized procedures as outlined previously (36). AMH per follicle was based on a concomitant AMH divided by the total antral follicle count.
The primary outcomes for this analysis were ovulation and the lowest dose required to achieve ovulation. Ovulation was defined as the first treatment cycle with a midluteal serum progesterone level greater than 5 ng/mL.
Statistical analysis
Descriptive statistics were used to compare characteristics between women by quartile of baseline AMH level, given that at present international standards for AMH thresholds do not exist (43). ANOVA, Kruskal-Wallis tests, χ2 tests, or Fisher's exact tests were used, as appropriate, to determine differences across quartiles. Geometric means and 95% confidence intervals (CIs) of AMH level, AMH level per follicle, and antral follicle count were compared by ovulatory status and by treatment group adjusted for age, body mass index (BMI), T, and insulin level. Geometric means were used given that AMH levels were not normally distributed. Further, geometric means and 95% CIs were compared by dose and treatment group adjusted for the same factors. The percentage of ovulatory and anovulatory cycles were compared by quartiles of AMH, AMH per follicle, and antral follicle count. Logistic regression models were used to estimate odds ratios (ORs) and 95% CIs for the association between AMH, AMH per follicle, and antral follicle count, and achieved ovulation using both continuous and quartiles models. Unadjusted models were compared with models that 1) adjusted for age alone, 2) adjusted for age, BMI, T, and insulin level, 3) adjusted for age, BMI, T, insulin, and treatment group, and 4) adjusted for age, waist circumference, T, and insulin. Additional models were evaluated that assessed the association between AMH, AMH per follicle, and antral follicle count and ovulatory status per cycle using modified Poisson regression with robust errors to estimate the risk of an ovulatory cycle and 95% CIs accounting for multiple cycles per woman. The area under the receiver operating characteristics curve was also calculated. Analyses were conducted in SAS version 9.4 (SAS Institute).
Results
Demographic characteristics of participants overall, and by quartile of AMH level are shown in Table 1. Treatment arms were similar with regard to all characteristics assessed and are presented elsewhere (36). Women in the highest quartile of AMH level tended to be younger, have lower BMI, smaller waist circumference, lower insulin, glucose, HOMA-IR, as well as higher T and LH concentrations. No differences in hirsutism, smoking status, or treatment assignment were observed by AMH quartile.
Demographic Characteristics of Women in PPCOS II by Quartile of Baseline AMH Level
| Characteristicsa | AMH (ng/mL)b | |||||
|---|---|---|---|---|---|---|
| Overall | Quartile1: <3.58 | Quartile 2: 3.58–6.19 | Quartile 3: 6.20–10.23 | Quartile 4: >10.23 | P-valuec | |
| n, (%) | 748 | 187 (25) | 187 (25) | 187 (25) | 187 (25) | |
| Age, y | 28.9 ± 4.2 | 30.1 ± 4.6 | 28.2 ± 3.9 | 28.7 ± 4.1 | 28.5 ± 4.2 | <.0001 |
| BMI, kg/m2 | 35.1 ± 9.2 | 39.7 ± 9.7 | 35.0 ± 8.6 | 34.5 ± 8.2 | 31.2 ± 8.3 | <.0001 |
| Waist circumference, cm | 105.9 ± 20.5 | 114.7 ± 19.6 | 105.8 ± 19.0 | 105.3 ± 19.5 | 97.7 ± 20.3 | <.0001 |
| Hirsutism, mFG score | ||||||
| Mean ± sd | 17.0 ± 8.5 | 17.2 ± 8.5 | 17.5 ± 8.4 | 17.3 ± 8.8 | 15.9 ± 8.4 | .27 |
| mFG <8 | 97 (13) | 17 (9) | 22 (12) | 28 (15) | 30 (16) | .12 |
| mFG 8–16 | 276 (37) | 80 (43) | 60 (32) | 64 (34) | 72 (39) | |
| mFG >16 | 375 (50) | 90 (48) | 105 (56) | 95 (51) | 85 (45) | |
| Insulin, μIU/mL | 19.3 ± 27.0 | 24.8 ± 42.6 | 18.6 ± 17.2 | 18.9 ± 21.8 | 14.7 ± 17.4 | <.0001 |
| Glucose, mg/dL | 86.0 ± 12.6 | 89.3 ± 15.2 | 86.0 ± 10.8 | 84.7 ± 12.0 | 84.2 ± 11.5 | .0003 |
| HOMA-IR | 4.4 ± 9.1 | 6.1 ± 16.2 | 4.0 ± 3.6 | 4.2 ± 6.1 | 3.2 ± 4.2 | <.0001 |
| T, ng/dL | 55.0 ± 28.8 | 40.3 ± 19.3 | 53.5 ± 31.0 | 57.6 ± 25.3 | 68.7 ± 30.7 | <.0001 |
| LH, mIU/mL | 11.1 ± 8.5 | 8.6 ± 8.0 | 11.7 ± 8.8 | 11.3 ± 7.2 | 13.0 ± 9.4 | <.0001 |
| Current smokingd | 111 (35) | 25 (34) | 31 (33) | 28 (39) | 27 (34) | .88 |
| Treatment | ||||||
| Clomiphene Citrate | 375 (50) | 91 (49) | 90 (48) | 99 (53) | 95 (51) | .78 |
| Letrozole | 373 (50) | 96 (51) | 97 (52) | 88 (47) | 92 (49) | |
Abbreviation: ; mFG, modified Ferriman-Gallwey.
Values are Mean ± sd and n (%) as indicated.
AMH levels not available for two participants (one in each treatment group of the original trial).
Two-sided P-values for continuous variables calculated using ANOVA or the Kruskal-Wallis test, and for categorical variables using χ2 tests or Fisher's exact test where appropriate.
There were 430 values missing for current smoking status.
AMH levels were significantly lower among women who achieved ovulation over the trial (up to five treatment cycles), compared with women who did not achieve ovulation both overall, and within each treatment group (P = .0001) (Figure 1A). There were no significant differences between the treatment groups. AMH per follicle was also significantly lower among women who achieved ovulation compared with women who did not achieve ovulation overall, and among women treated with clomiphene, but not among those women treated with letrozole (Figure 1B). No differences in antral follicle count were observed between women who did and did not achieve ovulation either overall, or by treatment group (Figure 1C). A trend toward higher AMH levels at increased doses of ovulation induction medication was observed for both clomiphene citrate and letrozole (Table 2). Results were similar for AMH per follicle, although no differences were observed for antral follicle count. Importantly, we did not observe a level of AMH at or above which no one ovulated, and the area under the receiver operating characteristics curve was 0.59.
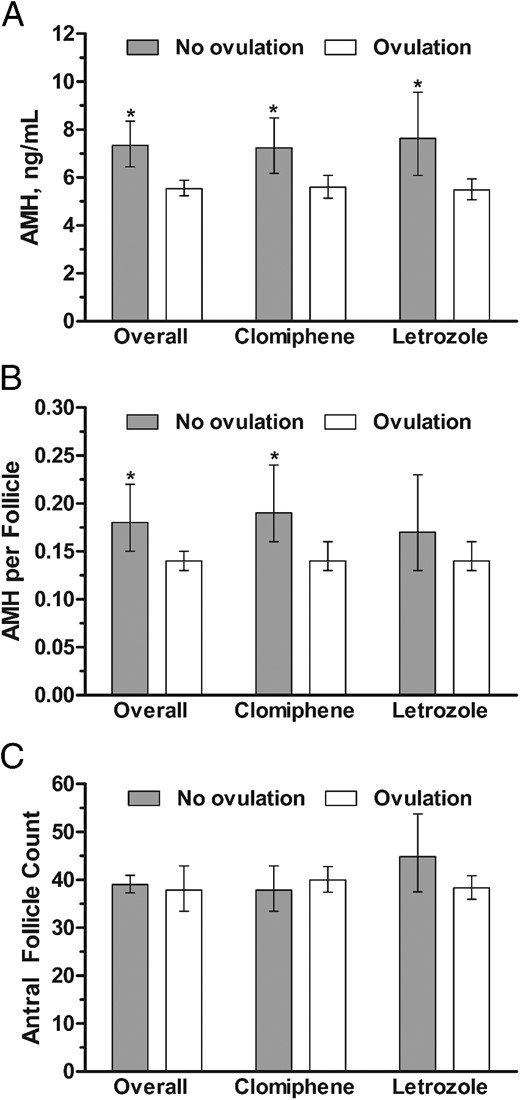
Comparison of geometric means (95% CIs) for (A) AMH concentrations, (B) AMH per follicle, and (C) antral follicle count by ovulatory status (comparing women who did not ovulate with women who achieved ovulation during the study) overall and by treatment group, adjusted for age, BMI, T, and insulin.
*, P < .05 for comparison between ovulation and no-ovulation groups.
AMH, AMH per Follicle, and Antral Follicle Count by Ovulation Induction Dose at First Ovulatory Response Overall and by Treatment Group Unadjusted and Adjusted For Age, BMI, T, and Insulin
| Dose at First Ovulatory Response1 | Unadjusted | Adjusted | ||||
|---|---|---|---|---|---|---|
| Overall2 | Clomiphene | Letrozole | Overall | Clomiphene | Letrozole | |
| AMH | ||||||
| First dose | 4.90 (4.38, 5.47)a | 5.45 (4.66, 6.38)a | 4.43 (3.79, 5.18)a | 4.75 (4.31, 5.23)a | 4.94 (4.29, 5.70)a | 4.66 (4.08, 5.33)a |
| Second dose | 6.07 (5.39, 6.83)ab | 5.43 (4.53, 6.52)a | 6.56 (5.60, 7.68)b | 5.98 (5.40, 6.63)b | 5.74 (4.89, 6.74)ab | 6.05 (5.28, 6.93)b |
| Third dose | 6.04 (5.34, 6.84)ab | 6.17 (5.19, 7.34)a | 5.92 (4.96, 7.07)ab | 6.21 (5.58, 6.92)b | 6.41 (5.50, 7.48)ab | 5.97 (5.13, 6.95)ab |
| Never ovulated | 6.87 (5.99, 7.88)b | 6.81 (5.77, 8.04)a | 6.97 (5.49, 8.85)b | 7.09 (6.29, 7.99)b | 7.01 (6.04, 8.13)b | 7.33 (5.96, 9.01)b |
| P-trend | 0.0002 | 0.04 | 0.002 | <0.0001 | 0.0006 | 0.0004 |
| AMH per follicle | ||||||
| First dose | 0.12 (0.10, 0.14)ac | 0.13 (0.11, 0.17)a | 0.11 (0.09, 0.13)a | 0.12 (0.10, 0.13)a | 0.12 (0.10, 0.14)a | 0.11 (0.09, 0.14)a |
| Second dose | 0.16 (0.14, 0.19)b | 0.14 (0.11, 0.18)a | 0.17 (0.14, 0.21)b | 0.16 (0.14, 0.18)b | 0.15 (0.12, 0.19)ab | 0.16 (0.13, 0.19)b |
| Third dose | 0.16 (0.14, 0.19)c | 0.15 (0.12, 0.19)a | 0.17 (0.14, 0.22)b | 0.17 (0.15, 0.20)b | 0.16 (0.13, 0.20)ab | 0.18 (0.14, 0.21)b |
| Never ovulated | 0.17 (0.14, 0.21)bc | 0.18 (0.14, 0.23)a | 0.15 (0.11, 0.21)ab | 0.18 (0.15, 0.21)b | 0.19 (0.15, 0.23)a | 0.16 (0.12, 0.21)ab |
| P-trend | 0.002 | 0.05 | 0.008 | <0.0001 | 0.002 | 0.004 |
| Antral Follicle Count | ||||||
| First dose | 41.3 (38.2, 44.6)a | 40.9 (36.6, 45.7)a | 41.6 (37.5, 46.3)ab | 41.3 (38.3, 44.6)a | 41.7 (37.4, 46.6)a | 41.3 (37.1, 45.9)ab |
| Second dose | 38.4 (35.4, 41.7)a | 38.7 (34.1, 43.9)a | 38.2 (34.3, 42.5)ab | 38.4 (35.3, 41.6)a | 37.9 (33.4, 42.9)a | 38.5 (34.5, 42.9)ab |
| Third dose | 36.9 (33.9, 40.2)a | 40.0 (35.4, 45.1)a | 34.1 (30.3, 38.5)a | 36.8 (33.8, 40.1)a | 39.8 (35.3, 44.9)a | 34.2 (30.3, 38.7)a |
| Never ovulated | 40.6 (36.9, 44.6)a | 38.3 (34.1, 43.1)a | 45.2 (38.4, 53.3)b | 40.7 (36.9, 44.7)a | 38.2 (34.0, 43.0)a | 45.2 (38.3, 53.3)b |
| P-trend | 0.45 | 0.52 | 0.65 | 0.45 | 0.39 | 0.73 |
Dose: For letrozole: first dose, 2.5 mg; second dose, 5.0 mg; third dose, 7.5 mg; and for clomiphene: first dose, 50 mg; second dose, 100 mg; third dose, 150 mg.
Values are geometric means and 95% CIs. Labeled means without a common letter differ. P < .05 (adjusted for multiple comparisons).
We also observed that women in the highest quartile of baseline AMH had a lower odds of ovulation compared with women in the lowest quartile (75% achieved ovulation in the fourth quartile compared with 87% in the first quartile; Table 3). This held after adjustment for age alone, as well as adjustment for age, BMI, T, and insulin, and additional adjustment for treatment group. Adjustment for waist circumference rather than BMI yielded similar results. Similar results were also observed for AMH per follicle, in that women in the second, third, and fourth quartiles compared with the first quartile had a lower odds of anovulation. Women in the third quartile of antral follicle count had a lower odds of ovulation compared with women in the lowest quartile. Similar results were observed when utilizing all cycles for analysis (Supplemental Table 1). Each one unit increase in AMH level and AMH per follicle was also associated with lower odds of ovulation after adjustment for age, BMI, T, and insulin levels, although the association was only marginally significant for AMH per follicle (AMH: OR, 0.94; 95% CI, 0.92–0.97; AMH per follicle: OR, 0.71; 95% CI, 0.49–1.03). No associations were observed with antral follicle count (OR, 1.00; 95% CI, 0.99–1.01)
ORs and 95% CIs for the Association Between AMH levels, AMH per Follicle, Antral Follicle Count, and Ovulation
| Model | Quartile1 | Quartile 2 | Quartile 3 | Quartile 4 |
|---|---|---|---|---|
| Women, n | 187 | 187 | 187 | 187 |
| AMH, ng/mL | <3.58 | 3.58–6.19 | 6.20–10.23 | >10.23 |
| Anovulatory, n (%) | 25 (13) | 23 (12) | 36 (19) | 46 (25) |
| Ovulatory, n(%) | 162 (87) | 164 (88) | 151 (81) | 141 (75) |
| Unadjusteda | Reference | 1.10 (0.60, 2.02) | 0.65 (0.37, 1.13) | 0.47 (0.28, 0.81) |
| Age adjusted | Reference | 1.14 (0.62, 2.10) | 0.66 (0.38, 1.16) | 0.49 (0.28, 0.84) |
| Adjusted model 1 | Reference | 0.82 (0.43, 1.57) | 0.45 (0.24, 0.83) | 0.26 (0.14, 0.50) |
| Adjusted model 2 | Reference | 0.81 (0.42, 1.58) | 0.45 (0.24, 0.84) | 0.26 (0.13, 0.50) |
| Adjusted model 3 | Reference | 0.86 (0.45, 1.65) | 0.49 (0.26, 0.89) | 0.28 (0.15, 0.53) |
| AMH per follicle | <0.08 | 0.08–0.15 | 0.16–0.33 | >0.33 |
| Anovulatory, n (%) | 21 (11) | 34 (18) | 32 (17) | 39 (21) |
| Ovulatory, n (%) | 163 (89) | 150 (82) | 153 (83) | 145 (79) |
| Unadjusted | Reference | 0.57 (0.32, 1.02) | 0.62 (0.34, 1.12) | 0.48 (0.27, 0.85) |
| Age adjusted | Reference | 0.58 (0.32, 1.04) | 0.63 (0.35, 1.13) | 0.49 (0.27, 0.88) |
| Adjusted model 1 | Reference | 0.48 (0.26, 0.88) | 0.49 (0.26, 0.93) | 0.34 (0.18, 0.66) |
| Adjusted model 2 | Reference | 0.49 (0.26, 0.91) | 0.48 (0.25, 0.92) | 0.35 (0.18, 0.68) |
| Adjusted model 3 | Reference | 0.51 (0.28, 0.94) | 0.48 (0.25, 0.92) | 0.38 (0.20, 0.72) |
| Antral follicle Count | <27 | 27–40 | 41–58 | >58 |
| Anovulatory, n (%) | 28 (15) | 31 (16) | 45 (25) | 23 (13) |
| Ovulatory, n (%) | 159 (85) | 159 (84) | 134 (75) | 161 (87) |
| Unadjusted | Reference | 0.90 (0.52, 1.58) | 0.52 (0.31, 0.89) | 1.23 (0.68, 2.23) |
| Age adjusted | Reference | 0.89 (0.51, 1.55) | 0.52 (0.30, 0.87) | 1.21 (0.67, 2.20) |
| Adjusted model 1 | Reference | 0.84 (0.47, 1.49) | 0.49 (0.28, 0.84) | 1.21 (0.66, 2.24) |
| Adjusted model 2 | Reference | 0.84 (0.47, 1.51) | 0.46 (0.27, 0.81) | 1.23 (0.66, 2.27) |
| Adjusted model 3 | Reference | 0.74 (0.41, 1.33) | 0.41 (0.23, 0.72) | 1.15 (0.62, 2.14) |
Logistic regression models to estimate ORs and 95% CIs. Adjusted model 1 is adjusted for age, BMI, T, and insulin. Adjusted model 2 is adjusted for the factors included in adjusted model 1, but is additionally adjusted for treatment. Adjusted model 3 is adjusted for age, waist circumference, T, and insulin.
Discussion
In a cohort of women with PCOS, we have observed that AMH levels were significantly lower among women who ovulated in response to medical treatment compared with women who never achieved an ovulatory cycle. Moreover, baseline AMH levels were lowest among women requiring the lowest dose to achieve ovulation, suggesting that high AMH is associated with a reduced response to ovulation induction, and women with higher AMH levels tended to need higher doses of ovulatory medication to achieve ovulation.
These results are consistent with prior studies of ovulation induction in smaller numbers of women with PCOS that observed an association of high AMH levels and lack of ovulation after treatment with laparoscopic ovarian diathermy and clomiphene (44, 45), and after ovulation induction with gonadotropins (4). We found that higher doses of ovulation induction agents were required to achieve ovulation for women with higher AMH levels, in agreement with the work of others (4, 44, 45). The prior studies associating high levels of AMH with a lack of response to ovarian stimulation suggested that anovulation occurred at AMH levels that were lower than those observed in the present study. This discrepancy could be due to differences in the assays used given that the Beckman-Coulter assay tends to yield higher results (3, 46–52). Our findings differ from one prior study of 68 obese women with PCOS that observed higher AMH levels among women who responded to clomiphene citrate compared with those who did not respond (53). Importantly, the women in this prior study started the study receiving a relatively high dose of clomiphene (150 mg) compared with clinical practice protocols, and the protocol for the current study, which use an escalating dose schedule and start at 50 mg. This difference in protocol could partially explain the differences in findings between the studies. Notably, the women with PCOS in this prior study who did not respond to treatment had AMH levels that were even lower than the non-PCOS control group (53). Typically, AMH levels are higher among women with PCOS, which calls into question the comparability of the two study populations despite the fact that BMI was similar (the average BMI in the PCOS group in their study was 36.7 kg/m2). Although we found no associations with antral follicle count, it may be due to inaccuracy of counting in the high ranges given that the counts in this study were so high. Our results expand upon the findings in the previous studies by evaluating both clomiphene and letrozole, as well as accounting for potentially confounding factors, and using a much larger sample size (the largest previous study included only 68 women) from a well-designed randomized clinical trial.
These results are also in agreement with what is known from in vivo and in vitro studies regarding the important role of AMH in the regulation of ovarian function (54), and regulation of GnRH release (55). In particular, AMH has been shown to inhibit primordial follicle recruitment, as well as decrease the responsiveness of the follicle to FSH, which could have important downstream implications for ovulatory function (56–58). Elevated serum AMH reflects increased production of intraovarian AMH, which likely plays a role in the aberrations of follicle growth and ovulatory response seen among women with PCOS (59–61). In normal ovaries it has been shown that a reduction of AMH in follicles greater than 9 mm seems to be important in the selection of the dominant follicle (59–61). These findings may thus be particularly relevant for women with PCOS, given that women with PCOS are producing excess AMH in their granulosa cells, which could thus restrict the early stages of folliculogenesis and lead to anovulation (27, 32, 60–62). These AMH-induced processes make women with PCOS exceptionally challenging to treat because their large supply of preantral follicles, when recruited with exogenous FSH, can rapidly spiral into uncontrolled multiple follicle growth and risks for ovarian hyperstimulation (63). It should also be noted that other factors also influence follicle maturation, including obesity and insulin resistance (29, 64). Given that the women in this study had PCOS and were also obese, it may be that the effects were accentuated, although we adjusted for BMI as well as waist circumference to account for this factor.
Our study has many strengths, including measurement of AMH in a large cohort of over 700 women, making this the largest study of this kind to evaluate associations between AMH and response to ovulation induction in women with PCOS. Moreover, trial outcomes were well defined and well documented, and the study participants were monitored prospectively during frequent scheduled study visits to precisely document ovulation. One weakness is that given the variability in AMH assays and a lack of standardization, individual programs will need to assess their own cut points based on local assays. However, given that we did not identify a cut point above which no one ovulated, the observations that women with higher AMH levels may require higher doses of ovulation induction treatment still stand although this work does not reveal a predictive AMH threshold. It is also important to recognize that we evaluated AMH in relation to achieved ovulation during the study, which may have taken multiple cycles. As such, this may have potentially limited the power to detect associations even in this large cohort, although we observed similar associations when evaluating the association with ovulatory status during each cycle under study.
In summary, we observed that in women with PCOS, baseline serum AMH levels were higher among women who did not respond to ovulation induction, although we did not find an absolute level of AMH above which women did not respond, and that AMH levels were significantly lower among women who ovulated. In addition, women with higher baseline AMH levels required higher doses of clomiphene or letrozole to achieve ovulation. These findings suggest that AMH may be a marker of ovarian resistance to ovulation induction.
Acknowledgments
In addition to the authors, other members of the NICHD Reproductive Medicine Network were as follows: Penn State College of Medicine, Hershey: C. Bartlebaugh, W. Dodson, S. Estes, C. Gnatuk, R Ladda, J. Ober; University of Texas Health Science Center at San Antonio: C. Easton, A. Hernandez, M. Leija, D. Pierce, R. Robinson; Wayne State University: A. Awonuga, L. Cedo, A. Cline, K. Collins, E. Puscheck, M. Singh, M. Yoscovits; University of Pennsylvania: K. Barnhart, K. Lecks, L. Martino, R. Marunich; University of Colorado: A. Comfort, M. Crow; University of Vermont: A. Hohmann, S. Mallette; University of Michigan: M. Ringbloom, J. Tang; University of Alabama Birmingham: S. Mason; Carolinas Medical Center: N. DiMaria; Virginia Commonwealth University: M. Rhea; Stanford University Medical Center: K. Turner; Yale University: D. DelBasso, Y. Li, H. Kuang, R. Makuch, P. Patrizio, L. Sakai, L. Scahill, H. Taylor, T. Thomas, S. Tsang, M. Zhang; Eunice Kennedy Shriver National Institute of Child Health and Human Development: C. Lamar, L. DePaolo. Advisory Board: D. Guzick (Chair), A. Herring, J. Bruce Redmond, M. Thomas, P. Turek, J. Wactawski-Wende. Data and Safety Monitoring Committee: R. Rebar (Chair), P. Cato, V. Dukic, V. Lewis, P. Schlegel, F. Witter.
This study was registered in ClinicalTrials.gov as trial number NCT00719186.
The content is solely the responsibility of the authors and does not necessarily represent the official views of the NICHD or the NIH.
This work was presented in part at the Annual Meeting of the Endocrine Society, Chicago, IL, June 21–24, 2014.
This work was supported by the Intramural Research Program of the Eunice Kennedy Shriver National Institute of Child Health and Human Development (NICHD); National Institutes of Health (NIH), Bethesda, MD; and by grants from NICHD (U10 HD27049, to C.C.; U10 HD38992, to R.S.L.; U10HD055925, to H.Z.; U10 HD39005, to M.P.D.; U10 HD38998, to W.D.S.; U10 HD055936, to G.M.C.; U10 HD055942, to C.C.; U10 HD055944, to P.R.C.; and U54-HD29834, to the University of Virginia Center for Research in Reproduction Ligand Assay and Analysis Core of the Specialized Cooperative Centers Program in Reproduction and Infertility Research); and by the National Center for Research Resources and the National Center for Advancing Translational Sciences through an NIH grant (UL1 TR000127) to Pennsylvania State University.
Disclosure Summary: R.S.L. has received consulting fees from Euroscreen, Astra Zeneca, Sprout, Takeda, Kindex, Clarus, and Bayer, and research support from Ferring and Astra Zeneca. M.P.D. reports receiving consulting fees from EMD Serono and serving on the board of directors of and owning stock in Advanced Reproductive Care. N.S. reports receiving grant support from Bayer and holding stock options in MenoGeniX. S.L.M., C.C., A.Z.S., W.D.S., R.A., G.M.C., P.R.C., H.H., E.E., H.Z., and M.I.C. have nothing to disclose.
Abbreviations
- AMH
anti-Müllerian hormone
- BMI
body mass index
- CI
confidence interval
- HOMA-IR
homeostasis model assessment for insulin resistance
- PCOS
polycystic ovary syndrome
- PPCOS
Pregnancy in PCOS II trial.
