


Abstract
There is a paucity of data regarding the association between glycosylated hemoglobin (HbA1c) variability and risk of microvascular complications in adolescents with type 1 diabetes (T1D).
To investigate the association between HbA1c variability and risk of microvascular complications in adolescents with T1D.
Prospective cohort study from 1990 to 2014 (median follow-up, 8.1 y).
Tertiary pediatric hospital.
A total of 1706 adolescents (aged 12–20 minimum diabetes duration 5 y) with median age of 15.9 years (interquartile range, 14.3–17.5) and diabetes duration of 8.1 years (6.3–10.8).
Glycemic variability was computed as the SD of all HbA1c measurements (SD-HbA1c) after diagnosis. Retinopathy was detected using 7-field fundal photography, renal function assessed using albumin excretion rate, peripheral neuropathy detected using thermal and vibration threshold testing, and cardiac autonomic neuropathy (CAN) detected using time- and frequency-domain analyses of electrocardiogram recordings. Generalized estimating equations were used to examine the relationship between complications outcomes and HbA1c variability, after adjusting for known risk factors, including HbA1c, diabetes duration, blood pressure, and lipids.
In multivariable analysis, SD-HbA1c was associated with early retinopathy (odds ratio [OR] 1.32; 95% confidence interval, 1.00–1.73), albuminuria (OR 1.81; 1.04–3.14), increased log10 albumin excretion rate (OR 1.10; 1.05–1.15) and CAN (OR 2.28; 1.23–4.21) but not peripheral neuropathy.
Greater HbA1c variability predicts retinopathy, early nephropathy, and CAN, in addition to established risk factors, in adolescents with T1D. Minimizing long term fluctuations in glycemia may provide additional protection against the development of microvascular complications.
Abstract
In 1706 adolescents with type 1 diabetes, greater HbA1c variability was associated with an increased risk of retinopathy, albuminuria and cardiac autonomic neuropathy.
The Diabetes Control and Complications Trial conclusively demonstrated the risk of microvascular complications rises markedly as glycosylated hemoglobin (HbA1c) increases (1). However, even within the same mean HbA1c levels, individuals can vary widely in their glycemic excursions, and more recent studies suggest visit-to-visit variation in HbA1c may be an additional risk factor for the development of retinopathy (2–4) and nephropathy (4, 5) in adults.
To date, however, there have been no studies assessing the association between HbA1c fluctuations and the risk of either peripheral or autonomic neuropathy. There is also a paucity of evidence on the relationship between HbA1c variability and complications risk in children and adolescents with type 1 diabetes (T1D) (5). The clinical significance of HbA1c variability is of particular interest in this group given their distinct risk factors for complications (eg, puberty) and the unique psychosocial and physiological challenges associated with the management of their glycemia (6).
The objective of this study was thus to examine the association between HbA1c variability and the development of microvascular complications in a longitudinal cohort of young people with T1D.
Research Design and Methods
Study population
The study population consisted of adolescents with T1D who were prospectively assessed for complications at The Children's Hospital at Westmead from January 1990 to May 2014. Inclusion criteria were age between 12 and 20 years, diabetes duration of at least 5 years, and availability of more than 5 serial HbA1c measurements since diagnosis. This latter criterion was instituted as a larger number of HbA1c measurements produce more reliable measures of glycemic variability (2, 7). Ethics approval was obtained from The Sydney Children's Hospital Network Ethics Committee. Informed consent was obtained from all patients (and their families if aged <18 y).
Assessment of glycemic variability
Glycemic control was assessed by measuring glycated hemoglobin (GHb) calorimetrically before February 1994 (8) and afterward by measurement of HbA1c using HPLC (Diamat Bio-Rad Analyzer; Bio-Rad; nondiabetic range 4%–6%). GHb values were converted to HbA1c (Diamat = 1.9088 + 0.0043 × GHb; r = 0.92) (9).
For each patient, the intrapersonal mean and SD of all recorded glycemic control measurements were calculated, and the SD-HbA1c was considered a measure of glycemic variability. Because the number of individual visits (n) could influence the SD-HbA1c (with fewer visits likely to artificially inflate SD), values for SD-HbA1c were divided by to adjust for this possibility (4). We also calculated coefficient of variation (CV), a normalized measure of glycemic variability. CV was computed as the division of SD-HbA1c by a factor of mean HbA1c (ie, CV = SD-HbA1c/[0.1 × mean HbA1c]).
Complications assessment
Retinopathy was assessed by 7-field stereoscopic fundal photography using the IMAGEnet2000Lite system to digitalize images. The same ophthalmologist graded photographs according to the modified Airlie House classification (10). Retinopathy was defined as the presence of at least one microaneurysm or hemorrhage (grade 21/10 or higher) in either eye.
Albumin excretion rate (AER) was determined using the mean of 3 consecutive timed overnight urine collections. Albumin was measured using Pharmacia Radioimmunoassay (Beckman Coulter Australia) before 2000, Immage Immunoassay (Beckman Coulter Australia) from 2000 to 2003, and Immulite Immunoassay (Simens Healthcare) thereafter. Regression equations for albumin had high correlation (R2 = 0.98; y-intercept of −0.5 and −0.56 mg/L). Albuminuria was defined as mean AER more than or equal to 20 μg/min or mean ACR more than or equal to 2.8 mg/mmol (male) and more than or equal to 4.1 (female) (see reference 12 below).
Peripheral nerve function was assessed by thermal threshold testing for hot and cold sensation at the dorsum of the left foot and vibration threshold testing at the left malleolus and left great toe (Neurosensory TSA-II and Vibratory Sensory Analyzer; Medoc Ltd), as previously described (11). Cardiac autonomic neuropathy (CAN) was assessed by measures of heart rate variability (HRV) obtained from analysis of 10-minute continuous electrocardiogram recordings using the LabChart Pro (ADInstruments). Derived time-domain measures included the SD of mean NN intervals (where NN is the time between adjacent QRS complexes) and the root mean squared differences of successive NN intervals. Frequency-domain measures included low-frequency and high-frequency spectral components, and the low frequency to high frequency ratio. Together, these measures provide an estimate of both overall HRV and the relative parasympathetic and sympathetic balance (12). Age- and gender-adjusted reference ranges used to define abnormality were derived from nondiabetic adolescent controls (9). Peripheral neuropathy was defined as either a vibration or thermal threshold test score above the 95th percentile. CAN was defined as a measurement below the 5th percentile on at least one time-domain or frequency-domain measure of HRV.
Height, weight, and body mass index (BMI) from each complications assessment were converted to z-scores using the 2000 Centers for Disease Control reference standards (13). Systolic blood pressure (SBP) and diastolic BP (DBP) z-scores for age and sex were derived using the United States Task Force Report (14). Cholesterol was measured using a Beckman CX5 from 1990 to 1999, a Dimension RXL from 2000 to 2005 and a Vitros analyzer (Ortho Clinical Diagnostics) thereafter. Participants were classified into either a socioeconomically disadvantaged (deciles 1–3) or socioeconomically advantaged (deciles 4–10) group using a postcode-based system derived from the Australian Bureau of Statistics Socio-Economic Indexes for Areas database (15).
Statistical analysis
Descriptive statistics are reported using mean ± SD for normally distributed continuous variables, and median (interquartile range) for skewed data. Differences between 2 groups were analyzed using independent samples t test for normally distributed variables and the Mann-Whitney U test for skewed data. Trends across more than 2 groups were analyzed using linear polynomial contrasts (ANOVA) for normally distributed variables and the Jonckheere-Terpstra test for skewed data. Categorical variables were compared using Pearson's χ2 or linear-by-linear association test (trend across more than 2 groups). Multiple linear regression was used to identify baseline factors associated with glycemic variability, after applying a natural logarithmic transformation to SD-HbA1c.
To longitudinally examine the association between glycemic variability and microvascular complications, generalized estimating equations were used so that correlations between repeat visits for an individual patient could be taken into account (16). Regression models were adjusted for the following covariates: mean HbA1c (%), age (y), sex, diabetes duration (y), SBP and DBP (z-scores), cholesterol (mmol/L), height (z-score), BMI (z-score), and socioeconomic disadvantage. Spearman's rank correlation coefficient (rs) was used to assess strength of association between covariates and screen for collinearity.
To account for the possible influence of mean HbA1c on SD-HbA1c, 2 models were constructed. Model 1 used SD-HbA1c as a measure of glycemic variability, whereas model 2 used CV. Clinically relevant interaction terms (eg, age*SD-HbA1c, age*CV, sex*SD-HbA1c, sex*CV, duration*SD-HbA1c, duration*CV, age*sex*SD-HbA1c, age*sex*CV, duration*sex*SD-HbA1c, and duration*sex*CV) were not significant, and were excluded from the final models. Quadratic terms for SD-HbA1c and CV used to test for curvature were not significant. The Quasi Likelihood Under Independence Model Criterion was used to summarize goodness of fit of multivariable models, and assess the added predictive value of glycemic variability (see Pan [17]). Results are reported as odds ratios (ORs) with 95% confidence intervals (CIs). SPSS version 22.0 (IBM) was used for statistical analysis.
Results
Overall, 1706 patients (47% male) met the inclusion criteria and results from 3995 complications assessments were included in the analysis. Those excluded due to the lack of serial HbA1c measurements (n = 301) had significantly shorter diabetes duration (median, 7.1 vs. 8.1 y; P < .001) but were not significantly different in regards to proportion male, socioeconomic disadvantage, insulin dose, BP, cholesterol, or BMI SD score (SDS).
Median age at last assessment was 15.9 years (14.3–17.5), diabetes duration 8.1 year (6.3–10.8), and HbA1c measurements per patient 22 (14–29), ie, 2.7 per patient per year. At last assessment, median intrapersonal mean HbA1c was 8.5% (7.9–9.0) (69 mmol/mol [63–75]) and SD-HbA1c was 0.95% (0.71–1.26). There was a significant correlation between the last single-measurement of HbA1c and the mean of serial HbA1c (rs = 0.570; P < .001).
Patient characteristics and complication rates at last assessment are presented in Table 1, stratified by ascending quartiles of SD-HbA1c. Those with higher SD-HbA1c were older, had longer diabetes duration, shorter stature, higher daily insulin dose, mean HbA1c, BP (z-scores) and cholesterol, and were less likely to be treated with intensive insulin therapy.
Characteristics and Complication Rates in Adolescents With T1D Stratified by Ascending Quartiles of Glycemic Variability (HbA1c SD)
| 1st | 2nd | 3rd | 4th | P Value for Trend | |
|---|---|---|---|---|---|
| Characteristics | |||||
| Number | 426 | 427 | 427 | 426 | – |
| Male | 196 (46) | 208 (49) | 214 (50) | 186 (44) | .603 |
| Age (y) | 15.4 [13.9–17.2] | 15.9 [14.3–17.3] | 16.0 [14.3–17.5] | 16.3 [15.0–17.7] | <.001 |
| Diabetes duration (y) | 7.7 [6.2–10.0] | 8.0 [6.4–10.6] | 8.4 [6.6–11.1] | 8.3 [6.3–11.1] | .006 |
| Mean HbA1c (%) | 8.0 [7.5–8.4] | 8.3 [7.9–8.8] | 8.6 [8.1–9.1] | 9.0 [8.5–9.7] | <.001 |
| Mean HbA1c (mmol/mol) | 64 [58–68] | 67 [63–73] | 70 [65–76] | 75 [69–83] | <.001 |
| Insulin dose (U/kg·d) | 1.01 [0.88–1.25] | 1.09 [0.88–1.27] | 1.13 [0.92–1.39] | 1.11 [0.91–1.34] | <.001 |
| Height SDS | 0.29 ± 1.00 | 0.16 ± 1.02 | 0.17 ± 1.01 | 0.00 ± 0.97 | <.001 |
| Weight SDS | 0.76 [0.18–1.35] | 0.77 [0.12–1.27] | 0.79 [0.18–1.35] | 0.69 [0.05–1.14] | .051 |
| BMI SDS | 0.68 [0.13–1.24] | 0.75 [0.23–1.21) | 0.79 [0.22–1.31] | 0.65 [0.13–1.14] | .499 |
| Cholesterol (mmol/L) | 4.3 [3.8–4.8] | 4.4 [3.9–5.0] | 4.3 [3.8–5.0] | 4.6 [4.0–5.2] | <.001 |
| SBP SDS | −0.16 [−0.83–0.61] | 0.02 [−0.70–0.63] | 0.15 [−0.59–0.92] | 0.17 [−0.37–0.92] | <.001 |
| DBP SDS | 0.19 [−0.23–0.81] | 0.34 [−0.20–0.92] | 0.56 [−0.05–1.00] | 0.74 [0.19–1.27] | <.001 |
| SE disadvantage | 55/424 (13) | 70/426 (16) | 62/419 (15) | 59/421 (14) | .845 |
| ≥3 injections or CSII | 357/424 (84) | 345/420 (82) | 264/421 (63) | 213/421 (51) | <.001 |
| Complications | |||||
| Retinopathy | 64/414 (16) | 102/414 (25) | 123/408 (30) | 152/405 (38) | <.001 |
| Albuminuria | 13/378 (3) | 7/364 (2) | 14/353 (4) | 27/304 (9) | <.001 |
| Median AER | 4.73 [3.42–7.15] | 4.84 [3.63–7.40] | 5.73 [3.77–9.30] | 6.28 [4.04–10.38] | <.001 |
| CAN | 36/167 (22) | 26/129 (20) | 15/60 (25) | 30/60 (50) | <.001 |
| Peripheral neuropathy | 58/220 (26) | 66/189 (35) | 33/108 (31) | 28/85 (33) | .268 |
Data are n (%), mean ± SD, or median [IQR]. CSII, continuous sc insulin infusion; SES, socioeconomic status.
The prevalence of retinopathy, albuminuria and CAN increased significantly across ascending quartiles of SD-HbA1c (Table 1 and Figure 1). Patients in higher quartiles of SD-HbA1c displayed significantly higher median AER. However, no trend was observed for peripheral neuropathy.
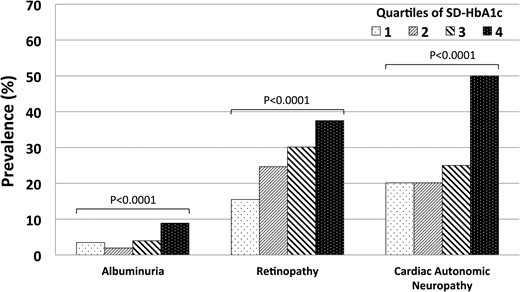
Bar graph demonstrating the relationship between ascending quartiles of HbA1c and prevalence of microvascular complications.
Table 2 shows the relationship between glycemic variability and the development of microvascular complications after adjusting for mean HbA1c and other covariates, using generalized estimating equations. Model 1 included SD-HbA1c, whereas model 2 included HbA1c CV. Using either measure, greater glycemic variability was associated with the development of retinopathy, albuminuria, increased log10AER and CAN after adjustment for known risk factors. A 1-U increase in SD-HbA1c was associated with 32% higher odds of retinopathy, 81% higher odds of albuminuria, 128% higher odds of CAN, and 10% increase in log10AER. For each of these outcomes, the addition of either SD-HbA1c or CV improved the goodness of fit of the multivariable models (Table 3). There was no association between peripheral neuropathy and glycemic variability (as measured by either SD-HbA1c or CV).
Generalized Estimating Equations for Factors Associated With Microvascular Complications in Adolescents With T1D
| Factors and Outcome | Model 1 | Model 2 | ||
|---|---|---|---|---|
| OR (95% CI) | P Value | OR (95% CI) | P Value | |
| Retinopathy | ||||
| Duration | 1.11 (1.08–1.15) | <.001 | 1.11 (1.08–1.15) | <.001 |
| Age | 1.09 (1.04–1.14) | <.001 | 1.09 (1.04–1.14) | <.001 |
| SBP SDS | 1.19 (1.07–1.31) | .001 | 1.18 (1.07–1.31) | .001 |
| Height SDS | 0.85 (0.77–0.93) | .001 | 0.85 (0.77–0.94) | .001 |
| Mean HbA1c | 1.88 (1.63–2.17) | <.001 | 1.94 (1.70–2.21) | <.001 |
| SD-HbA1c | 1.32 (1.00–1.73) | .049 | — | — |
| CV (SD-HbA1c/mean HbA1c) | — | — | 1.31 (1.03–1.66) | .028 |
| Albuminuria | ||||
| DBP SDS | 1.32 (1.05–1.68) | .019 | 1.33 (1.05–1.68) | .018 |
| Mean HbA1c | 1.54 (1.20–1.97) | .001 | 1.67 (1.35–2.06) | <.001 |
| SD-HbA1c | 1.81 (1.04–3.14) | .036 | — | — |
| CV (SD-HbA1c/mean HbA1c) | — | — | 1.68 (1.02–2.76) | .040 |
| Log10AER | ||||
| Female | 0.93 (0.90–0.96) | <.001 | 0.93 (0.90–0.96) | <.001 |
| Age | 1.02 (1.01–1.02) | <.001 | 1.02 (1.01–1.02) | <.001 |
| Height SDS | 1.02 (1.00–1.03) | .016 | 1.02 (1.00–1.03) | .017 |
| Mean HbA1c | 1.03 (1.01–1.06) | .003 | 1.05 (1.03–1.07) | <.001 |
| SD-HbA1c | 1.10 (1.05–1.15) | <.001 | — | — |
| CV (SD-HbA1c/mean HbA1c) | — | — | 1.08 (1.04–1.12) | <.001 |
| CAN | ||||
| Age | 1.21 (1.09–1.34) | <.001 | 1.21 (1.09–1.35) | <.001 |
| SBP SDS | 1.24 (1.01–1.52) | .041 | 1.24 (1.01–1.51) | .042 |
| Cholesterol | 1.36 (1.08–1.72) | .008 | 1.36 (1.08–1.71) | .008 |
| Mean HbA1c | 1.28 (0.97–1.69) | .080 | 1.41 (1.11–1.79) | .004 |
| SD-HbA1c | 2.28 (1.23–4.21) | .009 | — | — |
| CV (SD-HbA1c/mean HbA1c) | — | — | 2.06 (1.23–3.46) | .006 |
| Peripheral neuropathy | ||||
| Age | 1.15 (1.07–1.24) | <.001 | 1.15 (1.06–1.24) | <.001 |
| Female | 0.61 (0.45–0.84) | .002 | 0.61 (0.45–0.84) | .002 |
| Height SDS | 1.55 (1.32–1.81) | <.001 | 1.55 (1.32–1.81) | <.001 |
| BMI SDS | 1.23 (1.01–1.50) | .036 | 1.23 (1.01–1.50) | .035 |
| Mean HbA1c | 1.19 (0.95–1.49) | .122 | 1.18 (0.97–1.44) | .092 |
| SD-HbA1c | 1.00 (0.63–1.60) | .997 | — | — |
| CV (SD-HbA1c/mean HbA1c) | — | — | 1.05 (0.70–1.56) | .822 |
Both models adjusted for age (y), sex, diabetes duration (y), SBP (SDS), DBP (SDS), cholesterol (mmol/L), height (SDS), BMI (SDS), and socioeconomic disadvantage.
Goodness of Fit Statistics of Generalized Estimating Equations Assessing Factors Associated With Microvascular Complications in Adolescents With T1D
| Outcome | Quasi Likelihood Under Independence Model Criterion | ||
|---|---|---|---|
| Reference Model | Model With SD-HbA1c | Model With CV (SD-HbA1c/Mean HbA1c) | |
| Retinopathy | 3821.6 | 3818.9 | 3817.4 |
| Albuminuria | 1074.4 | 1070.5 | 1070.7 |
| CAN | 832.7 | 826.0 | 825.4 |
| Peripheral neuropathy | 684.1 | 685.7 | 685.5 |
Model criterion are in smaller-is-better form. Reference model includes age (y), sex, diabetes duration (y), SBP (SDS), DBP (SDS), cholesterol (mmol/L), height (SDS), BMI (SDS), and socioeconomic disadvantage.
Conclusions
In this observational study involving 1 706 adolescents with T1D, HbA1c variability was significantly associated with an increased risk of retinopathy, albuminuria, elevated AER, and CAN after adjusting for established risk factors. This is the first time that glycemic variability has been associated with CAN. Although our results for retinopathy and early nephropathy are consistent with a recent analysis of the Diabetes Control and Complications Trial (4) as well as several cohort studies involving adults with T1D (2, 3, 18), we demonstrate the association between HbA1c instability and these complications in an adolescent population, in whom such clinical data had been scarce (5). Moreover, in contrast to the more advanced endpoints employed in previous studies, we defined retinopathy as a 1-level worsening on the Early Treatment Diabetic Retinopathy Scale and examined early elevation of AER, which predicts future development of microalbuminuria (19). Thus, by employing earlier clinical endpoints, we have demonstrated the association with HbA1c variability applies across the entire spectrum of retinal and renal disease.
Our most novel finding was the significant association between glycemic variability and CAN. A 1-U increase in SD-HbA1c more than doubled the odds of CAN. The effect size was greater than that observed for any other microvascular complication, and is of substantial clinical significance considering that CAN is linked with increased mortality and a higher risk of sudden cardiac death (20). Furthermore, in the case of CAN, the impact of glycemic variability was considerably greater than that of mean HbA1c, which had a comparatively modest effect (Table 2). This raises the question of whether fluctuations in glycemia may play a greater role in the development of CAN than hyperglycemia itself.
In contrast, peripheral neuropathy was not associated with HbA1c variability. The conflicting results for autonomic and peripheral neuropathy are particularly surprising given the strong epidemiological data supporting their shared association with hyperglycemia and other metabolic risk factors (21, 22). The negative finding for peripheral neuropathy is almost certainly not a chance result considering both the point estimate of the OR and the value of the significance test approach unity. Moreover, given the large sample size and relatively high event rate, the analysis was sufficiently powered to detect even a weak association. These results may instead reflect differences in the sensitivity of autonomic and peripheral nerves or the effect of unknown confounders that were not adjusted for in the present study.
There are several possible explanations for the association observed between glycemic variability and increased complications risk. There may be underlying confounders driving this relationship, such as the effect of residual β-cell function and endogenous insulin secretion, which is plausible considering glycemic variability may directly contribute to β-cell apoptosis (see reference 24 below). Alternatively, comorbidities and factors affecting treatment compliance may have contributed to both higher glycemic variability and an increased risk of microvascular complications in this cohort.
It has been hypothesized that fluctuations in HbA1c independently contribute to increased oxidative stress, which plays a key role in the pathogenesis of diabetic complications (4, 23). This relationship between HbA1c variability and oxidative stress is extrapolated from animal and in vitro studies that show increased superoxide production in the setting of higher short-term (within-day) glucose variability (24–26). However, in studies of individuals with T1D, short-term glucose variability is not associated with oxidative stress (27) or the risk of microvascular complications (28–31). Other putative mechanisms include the induction of inflammatory cytokines (32) or stimulation of epigenetic changes that may promote systemic inflammation (33).
Another possible underlying mechanism may be the “normoglycemic reentry phenomenon,” whereby retinopathy frequently worsens following a reduction in HbA1c, before improving as glycemic control is maintained (34). However, patients with widely fluctuating HbA1c may be caught in a cycle where the transient worsening associated with periods of low glycemia is followed by hyperglycemia-induced damage, and vice versa. Although this phenomenon has been mainly observed for retinopathy, homeostatic disturbances caused by an unstable glycemic environment may also be detrimental for other complications (18). Alternatively, the association with HbA1c variability may be related to the “metabolic memory” hypothesis, which proposes that periods of hyperglycemia are “remembered” in the organs in which microvascular disease later occurs. This is supported by data from the Epidemiology of Diabetes Intervention and Complications study demonstrating early glycemic control is a key determinant of future complications risk (32, 33, 35, 36). Moreover, the metabolic memory effect is weakest forperipheral neuropathy, which may partially explain its lack of an association with glycemic variability in the present study (37).
Our findings have several implications for clinical practice. From a prognostic standpoint, we have demonstrated a more complete and informative assessment of both glycemic control and complications risk can be obtained by also considering a measure of glycemic variability. Moreover, although this was not an interventional study, we found the use of intensive insulin therapy was strongly associated with lower glycemic variability. This implies intensive regimens may provide additional protection beyond their role in reducing HbA1c and extends our previous observations that intensive insulin therapy is associated with a lower risk of microvascular complications in adolescents (12, 38). The possibility of dual protection is appealing as reduction of HbA1c alone is difficult in practice, with fewer than half of all patients able to maintain levels below the pediatric target of 7.5% (58 mmol/mol) (39).
Our findings may be limited by several factors. Firstly, the number of measurements per patient varied, so to minimize this potential bias, we divided SD-HbA1c by a function of the number of measurements. Secondly, although correlation testing did not suggest prohibitive collinearity, it is possible that the presence of both mean HbA1c and SD-HbA1c in regression models may have artificially inflated the significance of one, or both, of these variables. Thirdly, there were fewer patients included in the analysis of CAN as HRV testing was only available in more recent years. However, it is unclear how this temporal bias could have systematically favored an association between glycemic variability and CAN.
Further research is required to elucidate the precise mechanisms mediating the association between HbA1c variability and complications risk, and to clarify why studies investigating short-term glucose variability have produced discrepant results. Future studies may also extend our endpoints to include markers of macrovascular disease. A recent meta-analysis of randomized controlled trials showed multiple daily injection therapy and continuous sc insulin infusion pumps provide similar HbA1c reduction in adolescents with T1D (40). For our findings to be of direct clinical benefit, the mode of insulin delivery that best stabilizes HbA1c and reduces complications risk need to be identified.
Acknowledgments
We thank the patients and their families for their participation.
Author contributions: S.A.V. contributed to statistical analysis and data interpretation and wrote the manuscript; K.C.D. contributed to data collection, statistical analysis, and data interpretation and revised the manuscript; Y.H.C. and P.B.-A. contributed to data collection and revised the manuscript; S.H. and A.P. contributed to data collection; A.C. contributed to data collection and statistical analysis; M.E.C. contributed to data collection, statistical analysis, and data interpretation and revised the manuscript and is the guarantor of this article.
This work was supported by a National Health and Medical Research Council Practitioner Fellowship (M.E.C.) and by an Australian Postgraduate Award Scholarship (Y.H.C.).
Disclosure Summary: The authors have nothing to disclose.
Abbreviations
- AER
albumin excretion rate
- BMI
body mass index
- CAN
cardiac autonomic neuropathy
- CI
confidence interval
- CV
coefficient of variation
- DBP
diastolic BP
- GHb
glycated hemoglobin
- HbA1c
glycosylated hemoglobin
- HRV
heart rate variability
- NN
interval between successive normal heart beats
- OR
odds ratio
- SBP
systolic blood pressure
- SDS
SD score
- T1D
type 1 diabetes.
