


Single nucleotide polymorphisms altering FSH action (FSHB -211G>T, FSHR -29G>A, and FSHR 2039A>G) are associated with peripubertal and adult levels of reproductive hormones and age at pubertal onset in girls.
To investigate whether genetic polymorphisms altering FSH action affect serum levels of female reproductive hormones and breast development as early as during minipuberty.
Longitudinal study.
Population-based cohort study.
A total of 402 healthy girls at 3 months of age.
Analyses of single nucleotide polymorphisms by PCR using Kompetitive Allele Specific PCR genotyping assays; identification of glandular breast tissue by palpation and measurement of the diameter. Serum levels of anti-Müllerian hormone, FSH, LH, estradiol, inhibin B, and sex hormone-binding globulin were assessed by immunoassays.
FSHR -29G>A was associated with both FSH and anti-Müllerian hormone levels with an A allele effect size of −0.8 IU/L (P = .005) and 1.4 nmol/L (P = .003), respectively. FSHR 2039A>G correlated with breast tissue size with a negative additive effect of minor alleles (P = .021), whereas the effect on estradiol levels was only present in homozygotes. FSHB -211T carriers had smaller breast tissue size than girls who without a minor allele; GT+TT 10.5 (confidence interval 9.4–11.5) mm vs GG 12.1 (confidence interval 11.4–12.8) mm, P = .014.
Our study indicates that 3 genetic polymorphisms altering FSH action, especially FSHR -29G>A and FSHR 2039A>G, affect female hormone profile and glandular breast tissue development already during minipuberty. Thus, genetic variations of FSH signaling appear to determine the individual set point of the hypothalamic-pituitary-gonadal axis already early in life.
Three genetic polymorphisms (FSHB -211G>T, FSHR -29G>A, FSHR 2039A>G) were associated with serum reproductive hormone levels and glandular breast tissue size during minipuberty in 402 healthy girls.
FSH from the pituitary gland stimulates follicle maturation in the ovaries, thereby playing a key role in female reproductive health and fertility. During the menstrual cycle, FSH is essential for granulosa cell proliferation and synthesis of estradiol (1). Recently, 3 single nucleotide polymorphisms (SNPs) in the genes encoding the FSHβ subunit (FSHB -211G>T; rs10835638) and the FSH receptor (FSHR -29G>A; rs1394205, FSHR 2039A>G; rs6166) have been associated (alone or in combination) with alterations in female reproductive function (2–6) as well as age at pubertal onset in girls (7). No data are currently available concerning the impact of these SNPs on female reproductive health during the brief postnatal activation of the hypothalamic-pituitary-gonadal (HPG) axis, so-called minipuberty, which takes place during the first months of life (8, 9).
FSHR 2039A>G is located in an exon of the intracellular domain of the FSH receptor gene, and its association with the ovarian response to FSH is well established. In vitro, granulosa cell cultures from homozygotic minor allele (GG) carriers have slower intracellular cAMP production after FSH stimulation and thus need double the time to reach plateau levels compared with cells of AA carriers (10). In vivo, the G allele causes a partial FSH resistance (4) resulting in an increased ovarian threshold to FSH (5). Consequently, female FSHR 2039GG carriers have higher basal serum FSH levels (4, 6) and require higher doses of exogenous FSH to induce ovulation and achieve oocyte retrieval than major allele (AA) carriers (6).
FSHR -29G>A is located in the promoter region of FSHR, and a reduced receptor expression at the mRNA and protein level as well as cell surface expression is seen in granulosa cells obtained from AA carriers (11). In healthy girls, carriers of FSHR -29AA entered puberty 7.4 months later than wild-type allele carriers (7). A poor ovarian response to exogenous FSH treatment has also been observed in adult women with the AA genotype (3, 11), and FSH levels seem compensatorily elevated in minor allele carriers in peripubertal girls (12) and adult men (see reference 17 below).
FSHB -211G>T is located in the promoter region of the gene encoding the FSHβ subunit and alters the transcriptional efficiency of the gene. In vitro, G to T substitution leads to about 50% reduced transcriptional activity of the gene (13). The minor allele frequency (MAF) is very low, and studies with sufficient numbers are needed to clarify the effect of this SNP. Increasing total minor allele count of FSHB -211G>T and FSHR -29G>A is associated with later pubertal onset in girls (7). Furthermore, the FSHB -211T allele reduces serum FSH levels in young men (14–17) and is more prevalent in men with oligozoospermia than in men with normal sperm count (14, 18).
In infant boys, minipuberty is associated with a testicular testosterone surge with physiological androgen effects such as penile and testicular growth (19), as well as an increase in the numbers of Sertoli and germ cells (20, 21). Hence, this phase is considered important in reproductive differentiation and genital growth in boys. The effect of minipuberty in infant girls is poorly understood. However, it has similarly been associated with transient gonadal stimulation with follicular maturation and increased anti-Müllerian hormone (AMH) production (22, 23), as well as with increased estradiol levels stimulating growth of glandular breast tissue (24) and uterus (22). It has been speculated that the early postnatal activation of the pituitary-gonadal axis may be a developmental window, during which the individual set point for the HPG axis and follicle maturation may be determined (9, 25).
In the present study, we evaluate the effect of 3 SNPs altering FSH action (FSHB -211G>T, FSHR -29G>A, and FSHR 2039A>G) on reproductive hormones and breast development in 3-month-old girls. We hypothesized that the associations between the 3 SNPs and reproductive parameters during infancy resemble those found in pubertal girls and adult women.
Materials and Methods
Study participants
This study was based on 3-month-old girls participating in the Copenhagen Mother-Child Cohort, an ongoing population-based longitudinal birth cohort study of healthy Danish children (8, 26). We included girls genotyped for FSHB and FSHR polymorphisms in a previous investigation of pubertal onset (7), and in whom measurements of reproductive hormones and glandular breast tissue diameter at 3 months of age were also available (total n = 402). Reproductive hormones and glandular breast tissue measurements during minipuberty have been reported previously (8, 24, 27).
Clinical examinations
The same team of 7 trained medical doctors performed all examinations, and all methods were standardized at repetitive workshops (24). For all anthropometric measures, the means of 3 observations were calculated. Glandular breast tissue was identified by palpation as a firm sc disc and the diameter was measured once to the nearest 0.1 mm using a small slide gauge (Baty International). Diameters below 3 mm were considered unmeasurable, ie, equivalent to the nipple diameter, and registered as 1 mm (24).
Hormone measurements
Nonfasting peripheral venous blood samples were taken from an antecubital vein between midmorning and late afternoon. Samples were separated by centrifugation and stored at −20°C until analysis (8) which was blinded for the technician. Serum levels of FSH and LH were measured by a 2-sided time-resolved fluoroimmunoassay (DELFIA; Wallac, Inc) with limits of detection (LODs) of 0.06 and 0.05 IU/L, respectively. The intra- and interassay coefficients of variation (CVs) were less than 5% in both assays (8). Serum estradiol was measured by a RIA (Pantex Corp, Immunodiagnostic Systems Ltd), and the intraassay CV was less than 7.5%, the interassay CV less than 13%, and LOD was 18 pmol/L (8). Serum inhibin B was measured, in duplicate, in a double antibody enzyme-immunometric assay using a monoclonal antibody raised against the inhibin βB subunit in combination with a labeled antibody raised against the α-subunit. LOD for inhibin B was 20 pg/mL (8), and intra- and interassay CVs were less than 15% and 18%, respectively. The cross-reactivities for inhibin B in these 2 specific assays were 0.1% and 0.5%, respectively (8). Serum AMH levels were determined using the Beckman Coulter enzyme immunometric assay generation I (Immunotech, Beckman Coulter Ltd) with LOD of 2.0 pmol/L, and intraassay CVs were less than 10.8% and 9.2% at 18 and 99 pmol/L, respectively (28). Sex hormone-binding globulin was measured by time-resolved fluoroimmunoassay (DELFIA; Wallac, Inc) with LOD of 0.23 nmol/L, and both intra- and interassay CVs below 5% (29)
Genotyping
Peripheral blood (0.2-mL EDTA preserved) was used for isolation of genomic DNA using the QuickGene-810 Nucleic Acid Isolation System (Fujifilm, Life Science Products) and quantified on a NanoDrop ND-1000 spectrophotometer (Saveen Werner). All SNPs were analyzed by PCR using Kompetitive Allele Specific PCR (KASP) genotyping assays (LGC Genomics). KASP assays facilitate biallelic discrimination by competitive PCR and allele specific primers containing fluorescent resonance energy transfer quencher cassettes. KASP genotyping assays were designed and verified by LGC Genomics towards the following sequences: FSHB -211G>T (rs10835638), TATCAAATTTAATTT[G/T]TACAAAATCATCAT; FSHR -29G>A (rs1394205), TCTCTGCAAATGCAG[A/G]AAGAAATCAGGTGG; and FSHR 2039A>G (rs6166), ATGTAAGTGGAACCA[C/T]TGGTGACTCTGGGA.
Quantitative assessment of the competitive PCR was performed on a Stratagene Mx3000P quantitative PCR instrument (Agilent Technologies), and only samples that clearly clustered into distinct genotypes were considered. All homozygotic minor alleles were confirmed by repeating the analysis on another aliquot of the DNA. In one case, genotyping was incomplete due to lack of material: 1 sample was only analyzed for FSHB -211G>T. Allele distributions were consistent with the Hardy-Weinberg equilibrium (Pearson's χ2 = 1.06, P = .306; χ2 = 0.21, P = .647; and χ2 = 2.97, P = .09, respectively).
Statistical analyses
Results are reported as geometric means (serum hormone concentrations) and means (sums of right and left breast diameter). Confidence intervals (CIs) are given as 95% intervals.
Natural logarithmic transformation was applied to serum hormone concentrations to obtain a normal distribution. Correlations between serum levels of reproductive hormones were tested by Pearson's rank correlation test. Differences between groups were evaluated by Tobit analysis (30). This allowed taking into account hormone concentrations below LOD and bilaterally unmeasurable glandular breast tissue. Such values were treated as left-censored data in the analyses. For graphical representation of data, hormone concentrations below LOD were assigned LOD/2.
Firstly, we tested the association between genotype and phenotype (hormones, glandular breast tissue) in an additive model, assuming an intermediate effect in heterozygotes. Regressions were calculated over, eg, FSHR -29GG vs GA vs AA unadjusted and adjusted for the 2 other polymorphisms. Secondarily, associations were tested in a recessive model, assuming a strong effect only in minor allele homozygotes (eg, FSHR -29GG+GA vs AA). Due to the low frequency of the FSHB -211TT variant, the effect of FSHB -211G>T was only tested in a dominant model (GG vs GT+TT). The statistical analyses were generated using the statistical package SAS version 9.4 (SAS Institute, Inc). P < .05 was considered statistically significant. Figures were constructed in R (R Core Team [2014], R Foundation for Statistical Computing) using the ggplot2 package.
The girls had the following MAF distributions: FSHB -211G>T, 16.4%; FSHR -29G>A, 26.5%; and FSHR 2039A>G, 48.3%.
Ethics
The Copenhagen Mother-Child Cohort was approved by the Ethical Committee of the Capital Region of Denmark (KF 01 030/97) as well as the Danish Data Protection Agency (1997–1200-074). The study was conducted in accordance with the Helsinki II Declaration. All families received written information and informed consent was obtained from all participants.
Results
Results of genotype frequencies, serum hormone levels and their associations with genotypes are shown in Table 1. Results of glandular breast tissue diameter measurements and their associations with genotypes are shown in Table 2.
Geometric Means for Hormone Levels (95% CI) in Healthy 3-Month-Old Girls According to 3 SNPs Altering FSH Action
| Genotype | Effect of Genotypes on Hormone Levels (P Values) | |||
|---|---|---|---|---|
| Additive Model | ||||
| FSHR −29G>A | GG | GA | AA | GG vs GA vs AA |
| Frequencya | 219 (54.5%) | 153 (38.1%) | 30 (7.5%) | |
| n = 236 | 136 | 83 | 17 | |
| FSH (IU/L) | 4.4 (3.9–4.9) | 3.7 (3.2–4.3) | 2.7 (1.9–3.7) | .005 |
| n = 223 | 130 | 76 | 17 | |
| AMH (nmol/L) | 9.5 (8.0–11.4) | 14.8 (11.7–18.6) | 15.5 (9.5–25.4) | .003 |
| n = 245 | 140 | 86 | 19 | |
| Estradiol (pmol/L) | 30.6 (28.3–33.2) | 33.1 (29.9–36.6) | 28.3 (22.8–35.2) | .810 |
| n = 233 | 134 | 82 | 17 | |
| Inhibin B (pg/mL) | 60.0 (52.0–69.2) | 72.6 (60.5–87.0) | 52.4 (35.2–78.0) | .587 |
| FSHR 2039A>G | AA | AG | GG | AA vs AG vs GG |
| Frequencya | 99 (24.6%) | 218 (54.2%) | 85 (21.1%) | |
| n = 236 | 65 | 129 | 42 | |
| FSH (IU/L) | 3.7 (3.1–4.4) | 4.0 (3.6–4.6) | 4.2 (3.4–5.3) | .396 |
| n = 223 | 60 | 119 | 44 | |
| AMH (nmol/L) | 12.4 (9.5–16.1) | 10.6 (8.8–12.8) | 12.8 (9.4–17.5) | .978 |
| n = 245 | 66 | 134 | 45 | |
| Estradiol (pmol/L) | 31.8 (28.4–35.7) | 32.5 (30.0–35.3) | 27.1 (23.5–31.2) | .136 |
| n = 233 | 62 | 127 | 44 | |
| Inhibin B (pg/mL) | 71.3 (57.9–87.9) | 60.5 (52.2–70.1) | 61.7 (48.1–79.1) | .322 |
| FSHB −211G>T | GG | GT | TT | Dominant model |
| GG vs GT + TT | ||||
| Frequencya | 278 (69.2%) | 116 (28.9%) | 8 (2.0%) | |
| n = 236 | 163 | 71 | 2 | |
| FSH (IU/L) | 4.2 (3.8–4.7) | 3.5 (3.0–4.2) | 3.7 (1.3–10.0) | .093 |
| n = 223 | 155 | 66 | 2 | |
| AMH (nmol/L) | 11.6 (9.8–13.7) | 11.1 (8.6–14.3) | 17.3 (4.0–75.1) | .832 |
| n = 245 | 169 | 74 | 2 | |
| Estradiol (pmol/L) | 31.4 (29.2–33.8) | 30.7 (27.5–34.3) | 43.0 (22.2–83.3) | .846 |
| n = 233 | 161 | 70 | 2 | |
| Inhibin B (pg/mL) | 67.0 (58.8–76.3) | 55.6 (45.6–67.8) | 86.9 (27.5–274.7) | .148 |
Associations between genotypes and reproductive hormone levels were tested in an additive model for FSHR −29G>A and FSHR 2039A>G and in a dominant model for FSHB −211G>T by Tobit analysis. Hormone concentrations below LOD were treated as left censored values. P < .05 were considered statistically significant.
Allele distributions in the study population are given below each SNP.
Mean Glandular Breast Tissue Size (Sum of Left and Right Breast Diameter; 95% CI) in Healthy 3-Month-Old Girls According to 3 SNPs Altering FSH Action
| Genotype | Effect of Genotypes on Glandular Breast Tissue Diameter (P Values) | |||
|---|---|---|---|---|
| Additive Model | ||||
| FSHR −29G>A | GG | GA | AA | GG vs GA vs AA |
| n = 397 | 216 | 151 | 30 | |
| Size (mm) | 11.2 (10.4–12.0) | 12.1 (11.1–13.1) | 11.6 (9.4–13.7) | .286 |
| FSHR 2039A>G | AA | AG | GG | AA vs AG vs GG |
| n = 397 | 99 | 214 | 84 | |
| Size (mm) | 12.8 (11.6–13.9) | 11.3 (10.5–12.1) | 10.8 (9.5–12.0) | .021 |
| Dominant model | ||||
| FSHB −211G>T | GG | GT | TT | GG vs GT + TT |
| n = 398 | 275 | 115 | 8 | |
| Size (mm) | 12.1 (11.4–12.8) | 10.3 (9.2–11.4) | 13.4 (9.2–17.4) | .014 |
Associations between genotypes and breast tissue size were tested in an additive model for FSHR −29G>A and FSHR 2039A>G and in a dominant model for FSHB −211G>T by Tobit analysis. Bilaterally unmeasurable breast tissue was treated as a left censored value. P < .05 were considered statistically significant.
FSHR -29G>A was negatively associated with circulating FSH and positively associated with AMH levels (Table 1 and Figure 1); the A allele effect size was −0.8 IU/L (P = .005) and 1.4 nmol/L (P = .003), respectively. Associations remained significant after adjusting for the other SNPs (P = .007 and P = .003, respectively) (data not shown). When evaluated separately, FSHB -211G>T and FSHR 2039A>G were not associated with FSH or AMH levels (Table 1).
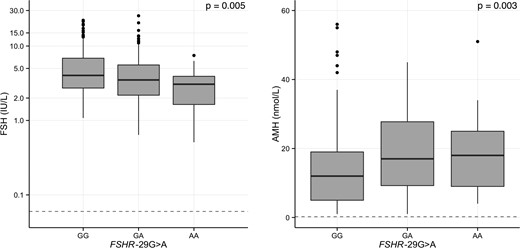
Effect of FSHR -29G>A on serum FSH and AMH in 3-month-old girls.
Boxplots of serum FSH and AMH are shown according to FSHR -29G>A. Differences between groups were tested by Tobit analysis in an additive model. The gray dashed lines denote LODs. Please note the logarithmic scale on the y-axis on the left-hand panel.
The association between FSHR 2039A>G and estradiol serum concentrations was nonsignificant (P = .136) (Table 1). When evaluated in a recessive model, however, lower serum estradiol was observed in minor allele homozygotes compared with wild-type carriers (AA+AG vs GG, P = .027) (data not shown). No other SNP was associated with estradiol serum concentrations. No other correlations were significant in a recessive model (data not shown). Glandular breast tissue diameter correlated negatively with the number of FSHR 2039A>G minor alleles with a reduction of 1.0 mm per G allele (P = .021) (Table 2 and Figure 2). This association remained significant after adjusting for other SNPs (P = .019).
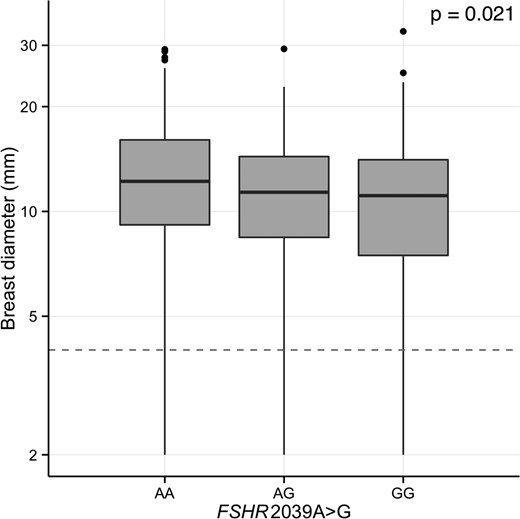
Effect of FSHR 2039A>G polymorphism on breast tissue size in 3-month-old girls.
Boxplot of glandular breast tissue size is shown according to FSHR 2039A>G. Differences between groups were tested by Tobit analysis in an additive model. The gray dashed line denotes bilateral unmeasurable glandular breast tissue.
FSHB -211T carriers had reduced mammary gland diameters compared with carriers of FSHB -211 GG; GG 12.1 (CI 11.4–12.8) vs GT+TT 10.5 mm (CI 9.4–11.5), P = .014 (Table 2). FSHB -211G>T was not associated with any serum hormone level. There was no effect of the 3 SNPs on inhibin B (Table 1), LH, or sex hormone-binding globulin levels (data not shown).
AMH was negatively correlated to FSH (r = −0.65, P < .001) and LH (r = −0.18, P = .008) and positively correlated to inhibin B (r = 0.64, P < .001).
Discussion
To our knowledge, this is the first study to explore the effects of genetic polymorphisms altering FSH action during the early postnatal activation of the pituitary-gonadal axis in infant girls. We studied 3 SNPs recently associated with pubertal timing in girls (7) and follicle growth in adult women (3, 5).
Overall, we found subtle effects of all 3 SNPs on some but not all outcomes, and findings concerning reproductive hormones and glandular breast tissue were not absolutely coherent. Serum FSH was lower and AMH levels higher in carriers of the FSHR -29AA genotype (reduced number of FSH receptors). Girls with the FSHR 2039GG genotype (reduced FSHR signal transduction) had significantly smaller glandular breast tissue size and lower estradiol serum concentrations. Furthermore, smaller glandular breast tissue size was found in carriers of the FSHB -211G>T minor allele (reduced FSH production). Data showed considerable overlap in absolute hormonal levels between genotypes, which is in part caused by the large interindividual variation in serum hormone levels during minipuberty and their rapid changes with postnatal age (23) as well as their effects on target tissue (22).
Previously, the FSHR -29AA genotype has been associated with later pubertal onset in girls (7), peripubertal hormone levels in girls (12), and a reduced ovarian response to exogenous FSH stimulation (3). However, few studies exist on the effect of this polymorphism on circulating FSH levels. FSHR -29AA seems associated with a compensatory increase in FSH levels in adult men (31) and peripubertal girls (12), whereas no effect has been found in the few studies reported on adult women (11). We did not expect to find lower FSH levels in infants with the FSHR -29AA genotype. Further studies are needed to clarify whether this is due to an altered course of the minipuberty compared with puberty later in life, an immature feedback system or an incidental finding. However, we know little about the precise age at which gonadotropin levels peak during female minipuberty and may have missed the optimal window for blood sampling. Recently, it was suggested that the postnatal surge in girls is less distinct and more fluctuating than in boys (9). In addition, we speculate that our finding could be explained by a shift of the postnatal surge timing in AA carriers. Longitudinal studies are needed to elucidate if this is the case, and to establish if carriers of FSHR -29 AA peak earlier or later than other infants. Increased AMH levels indicate an accumulating number of small follicles. We did not obtain ultrasound of the ovaries in our study to clarify whether the lack of correlation of this SNP with serum inhibin B and estradiol levels are caused by alterations in the relative distribution of small, medium, and large follicles.
Carriers of the FSHR 2039GG genotype had smaller glandular breast tissue and lower estradiol concentrations. We observed higher FSH levels as well, which, however, did not become significant most likely due to a relatively low number of minor allele homozygotes. In combination, our results were consistent with in vitro observations of an attenuated FSHR transduction (10), and a compensatory increase of serum FSH levels (4, 6) and decreased estradiol levels (6) as observed in adult women.
Similarly, we found smaller glandular breast tissue and a trend towards lower FSH levels in carriers of the FSHB -211G>T minor allele. FSHB -211TT has previously been associated with reduced FSHB transcription in vitro (13) and lower FSH concentrations in pubertal girls (2), which is consistent with our findings. The above may indicate similar effects of FSHB transcription and FSHR transduction on the female HPG axis during minipuberty and puberty. However, our results for FSHB -211G>T need to be interpreted with much caution due to its low MAF.
Although the postnatal rise in reproductive hormones was acknowledged many years ago (32), its significance for female reproductive development is still poorly understood. In male infants, Sertoli and germ cell numbers increase during this period (20, 21), the testes and penis grow (19), and due to the distinct short-term peak in reproductive hormones, this phase can be used to diagnose hypogonadotropic hypogonadism (33) and to start treatment early in order to mimic physiology (29). Thus, in gonadotropin deficient patients minipuberty appears to mirror findings in puberty (34). However, the predictive potential of minipuberty in healthy infants for future adult reproductive health, ie, fertility or hormone-dependent cancers, is poorly investigated. Folliculogenesis is initiated approximately 15 weeks after conception, and at birth most oocytes are contained as primary follicles (35). AMH serum levels correlate well with the number of antral follicles both in healthy adult women (36) and peripubertal girls (28). The transient increase of AMH levels during minipuberty in girls (23, 27) is also attributed to ovarian stimulation and numbers of small antral follicles (37). A longitudinal study by Kuiri-Hänninen et al found antral follicles more than 6 mm in 74.6% of healthy infant girls, indicating FSH-dependent follicular growth (23). They also found increased AMH levels concomitantly with more antral follicles (23), and there was an inverse relationship between AMH and FSH, which we also found in our cohort. Similarly, serum estradiol in infant girls correlates with glandular breast tissue diameter (22, 24) and uterine size (22), thus exerting a biological effect, ie, growth and differentiation, on estrogen sensitive tissue, which may be significant to future fertility. In both boys and girls, the glandular breast tissue diameter is largest at birth potentially reflecting placental and maternal estrogen levels (22). However, the longer persistence of glandular breast tissue in girls than in boys probably results from endogenous estrogen (22). Thus, the female minipuberty may be an important phase in reproductive priming.
The postnatal activation of the pituitary-gonadal axis in girls is much less pronounced and more prolonged than in boys (9). Gonadotropins peak between 1 and 3 months postnatally in both boys and girls (9). Although testosterone levels in boys demonstrate a clear peak at this time point (19), estradiol levels in girls appear to fluctuate (22). It has been proposed that this reflects cyclic maturation and atrophy of ovarian follicles (22). This suggests that single measurements of reproductive hormones as done in our study may not adequately describe the activity of the HPG axis in infancy. This may have added considerable noise to the present data, which may have contributed to the fact that only few associations reached statistical significance and that there was a considerable overlap between genotype groups. We performed multiple tests, which may have caused incidental findings by mass significance, and a statistical correction for this phenomenon would have resulted in nonsignificant findings throughout. However, such a correction may in fact overcorrect as pituitary and gonadal hormones are not independent, but dependent through the negative feedback mechanisms. This study should therefore be considered a pilot.
The study population represents the general population, and the minor allele distributions in our study population were within the ranges of other European populations as reported in the 1000 Genomes project (38).
Conclusion
In conclusion, our findings suggest an influence of genetic polymorphisms altering FSH action on the postnatal HPG axis activation in infant girls. Some associations, but not all, mimic the regulatory patterns of the HPG axis observed in peripubertal girls and adult women. Thus, genetic variations of FSH signaling appear to determine the individual set point of the HPG axis already early in life.
Acknowledgments
We thank all participating children and their families. We also thank the technicians in our molecular biology and hormone laboratory for expert assistance.
This work was supported by International Center for Research and Research Training in Endocrine Disruption of Male Reproduction and Child Health.
Disclosure Summary: The authors have nothing to disclose.
Abbreviations
- AMH
anti-Müllerian hormone
- CI
confidence interval
- CV
coefficient of variation
- HPG
hypothalamic-pituitary-gonadal
- KASP
Kompetitive Allele Specific PCR
- LOD
limit of detection
- MAF
minor allele frequency
- SNP
single nucleotide polymorphism.
