


Glucose-dependent insulinotropic polypeptide (GIP) in combination with hyperinsulinemia increases blood flow and triglyceride (TAG) clearance in subcutaneous (sc) abdominal adipose tissue in lean humans. The present experiments were performed to further investigate the role of insulin for the vasoactive effect of GIP in adipose tissue metabolism and whether the vasodilatory effect of GIP is dependent on C-peptide.
Six lean healthy subjects were studied. The sc abdominal adipose tissue metabolism was assessed by Fick's principle during GIP infusion (1.5 pmol/kg/min) in combination with 1) euglycemic–high insulinemic clamp (Eugluc-Hiinsu), raising plasma insulin concentrations to postprandial levels, 2) hyperglycemic–euinsulinemic clamp (Hygluc-Euinsu), and 3) hyperglycemic–hyperinsulinemic clamp, raising plasma insulin concentrations to supraphysiological levels. During the hyperglycemic clamps, endogenous insulin and C-peptide secretion were inhibited by infusion of the somatostatin analogue octreotide.
During GIP infusion, Eugluc-Hiinsu, and hyperglycemic-hyperinsulinemic clamps, sc abdominal adipose tissue blood flow (ATBF) was similar and increased from 2.1 ± 0.2 and 2.2 ± 0.4 ml min-1 (100 g tissue)-1 to 7.1 ± 0.6 and 7.6 ± 0.1 ml min-1 (100 g tissue)-1, respectively (P < .01). ATBF remained virtually constant (2.7 ± 0.4 ml min-1 [100 g tissue]-1) during Hygluc-Euinsu and GIP infusion. In addition, adipose tissue TAG clearance increased significantly (P = .03), whereas free fatty acid output (P = .01), glycerol output (P = .02) and free fatty acid/glycerol release ratio (P = .04) decreased during the Eugluc-Hiinsu clamp compared to Hygluc-Euinsu clamp with GIP.
In healthy lean humans, insulin is permissive for GIP to induce an increase in blood flow and TAG clearance in sc abdominal adipose tissue. This effect is independent of C-peptide.
GIP and hyperinsulinemia increases blood flow and triglyceride clearance in adipose tissue in man. The present experiments show that the insulin concentration must exceed a threshold before the GIP effect is elicited.
Glucose-dependent insulinotropic polypeptide (GIP) is produced by the duodenal enteroendocrine K cells and is released in response to upper intestinal nutrient exposure (1–3). The hormone potentiates glucose-induced insulin secretion and is partly responsible for the incretin effect (1). Besides enhancing insulin secretion, GIP has been shown to have an effect on human subcutaneous (sc) abdominal adipose tissue blood flow (ATBF) and metabolism (1, 4).
The sc adipose tissue represents about 85% of all body fat and its major metabolic role is the regulated storage and mobilization of lipid energy (5). It is thought that adipose tissue acts to “buffer” the influx of dietary fat into the circulation (6, 7). Thus, excess dietary fat is stored in the adipose tissue rather than overflowing to other organs such as the liver and skeletal muscle. Lipid deposition and mobilization from adipose tissue is tightly linked to ATBF (8, 9). Postprandially, sc abdominal ATBF increases markedly, especially in lean people (10). We have previously demonstrated that GIP may mediate the meal-induced rise in ATBF in lean humans (11). Thus, GIP infusions in the presence of elevated insulin concentrations, increased ATBF, and stimulated triglyceride deposition in adipose tissue, potentially making GIP and insulin key controllers of postprandial fat deposition. In the same study, we showed that GIP alone or hyperinsulinemia per se did not have any effect on ATBF. In obese humans with impaired glucose tolerance, GIP infusion in combination with hyperinsulinemia did not induce any changes in ATBF and triglyceride (TAG) uptake in adipose tissue (12). Recently, we showed that weight loss in obese subjects induced by caloric restriction resulting in improved insulin sensitivity partly restored the increase in ATBF during otherwise comparable experimental conditions (13).
For this study, we designed a series of experiments to investigate whether insulin plays a permissive role in the vascular effect of GIP in subcutaneous adipose tissue in healthy lean subjects. Further, as C-peptide has been shown to have vascular effects (14–16), we investigated whether the vasodilatory effect of GIP is dependent of C-peptide.
Materials and Methods
Subjects
Six healthy (mean age, 30 years ± 6 [mean ± SD]; body mass index, 23.2 ± 1.4) nonsmoking male volunteers were studied. Sample size was determined before the study using power analysis (P = .8, α = 0.05) with regard to ATBF response based on our previous publication (11). Assuming an ATBF response as found in normal weight, healthy subjects, fewer than six subjects were needed in the present study.
None of them used medication or had a positive family history of diabetes. All volunteers had normal plasma values of fasting glucose, hemoglobin, lipid profile, and renal and hepatic function. All subjects gave informed written consent after the protocol had been approved by the Copenhagen Municipality and the study was performed in accordance with the Helsinki Declaration II.
Experimental design
The study protocol had a cross-over design with a washout period of at least 2 weeks. Each subject served as his own control and was studied, in a randomized order, on three occasions during: 1) a euglycemic–high insulinemic (Eugluc-Hiinsu) clamp (target glucose level, 5 mM; target insulin level, 200 pM); 2) a hyperglycemic–euinsulinemic (Hygluc-Euinsu) clamp (target glucose level, 6.5–7 mM; target insulin level, <100 pM); and 3) a hyperglycemic–hyperinsulinemic clamp (Hygluc-Hyinsu) clamp (target glucose level, 6.5–7 mM; target insulin level, >300–400 pM), all three occasions in combination with GIP (1.5 pmol-1 kg-1 min-1) during 120 minutes. During the hyperglycemic clamps, endogenous insulin and C-peptide secretions were inhibited by infusion of the somatostatin analog octreotide.
Protocol
The subjects were instructed to abstain from drinking alcohol or doing strenuous physical activities for 2 days before the experiments to ensure equally filled glycogen stores. On the days of the experiments, subjects arrived at the department at 8:00 am having used nonstrenuous transportation and after having fasted for at least 12 hours. The investigations were performed with the subjects in supine position in a room kept at 24 C. A catheter (BD Venflon, PRO, Becton Dickinson) was inserted into an antecubital vein for the infusion of GIP, glucose, insulin, or octreotide. The subjects then had catheters inserted into a sc vein on the anterior abdominal wall and into a radial artery.
Catheterization
A vein draining the sc abdominal adipose tissue on the anterior abdominal wall was catheterized antegradely as previously described (17) during ultrasound/color Doppler imaging of the vein. A 22 g, 10 cm polyurethane catheter (Ohmeda) was inserted using the Seldinger technique. The tip of the catheter was positioned above the inguinal ligament to minimize the risk of withdrawing blood from the femoral vein. After insertion, the catheter was kept patent throughout the experiment by continuous infusion of saline at a rate of 40 ml h-1. Another catheter was inserted percutaneously into the radial artery of the nondominant arm under local analgesia (1 ml 1% lidocaine) with an Artflon (Ohmeda). The catheter was kept patent with regular flushing with saline.
After baseline measurements (time –30, –15, and 0 minutes) a continuous infusion of GIP in combination with the three different clamps was started.
GIP infusion and the clamps
GIP.
For the GIP infusions, synthetic human GIP (1–42) was purchased from Polypeptide Laboratories. The peptide was demonstrated to be >97% pure and identical to the natural human peptide by HPLC, mass, and sequence analysis. GIP was dissolved in sterilized water containing 2% human serum albumin (Human Albumin, CSL Behring) and subjected to sterile filtration. Appropriate amounts of peptide for each experimental subject were dispensed into glass ampoules and stored frozen (–20 C) until the day of the experiment. Vial content was tested for sterility and bacterial endotoxins (European Pharmacopoeia 2.6.14, Method C; turbidimetric kinetic method).
Egluc-Hiinsu, Hgluc-Einsu, and Hgluc-Hyinsu clamp.
The objective of the Egluc-Hiinsu clamp was to maintain fasting plasma glucose levels and to increase plasma insulin levels above fasting level to study the effects of insulin with GIP on ATBF without the confounding effect of C-peptide: 1) a continuous variable infusion of glucose was adjusted every 5–10 minutes according to measured plasma glucose concentrations to maintain levels at 5 mM; and 2) a continuous infusion of insulin (Actrapid Human; Novo Nordisk) at a rate of 7 mU m-2 min-1 was infused to raise plasma insulin levels to physiological postprandial levels. The objective of the Hyglu-Euinsu clamp was to increase plasma glucose levels above fasting level (6.5–7 mM) and to maintain plasma insulin at fasting level. Endogenous insulin was inhibited using infusion of the somatostatin analog octreotide to study the effects of GIP on ATBF without the confounding effects of insulin and C-peptide. The protocol included: 1) a continuous variable glucose infusion dose adjusted every 5–10 minutes according to measured plasma glucose to maintain the glucose concentration at the desired target and 2) a continuous maintenance dose of octreotide of 30 ng kg-1 min-1 was infused. Inhibition of endogenous insulin secretion was verified by measurement of plasma C-peptide; and 3) insulin replacement was started at the same time of glucose infusion to maintain fasting insulin levels (continuous insulin infusion rate of 4 mU m-2 min-1. The objective of the Hygluc-Hyinsu clamp was to increase plasma glucose levels above fasting levels (6.5–7 mM) and to increase insulin concentration to supraphysiological levels. Plasma glucose levels were increased as described previously and insulin was infused at a rate of 10 mU m-2 min-1.
Measurements
Sc abdominal adipose tissue blood flow.
Adipose tissue blood flow measurements were performed for the duration of each experiment by recording washout of (133)Xenon, which was injected in gaseous form into the adipose tissue. This technique has previously been validated in our laboratory (18). About 1 MBq gaseous (133)Xenon (The Hevesy Laboratory, Risoe National Laboratory) mixed in about 0.1 ml of atmospheric air was injected into the para-umbilical area of the subcutaneous adipose tissue. The washout rate of (133)Xenon was measured continuously by a scintillation counting device placed over the exact site of injection and taped firmly in place (Mediscint, Oakfield Instruments). The adipose tissue blood flow was calculated from the mean washout rate constant determined in 30-minute periods corresponding to the time points when blood samples were drawn. A tissue/blood partition coefficient for Xenon of 10 ml g-1 was used (19). To detect early flow changes, a monoexponential curve was fitted to the washout curve registered in the basal control period immediately before the hormone infusions were initiated. The commencement of the vascular effects was defined when the slope of the Xenon-washout curve deviated from the baseline slope by visual inspection.
Blood samples
Blood samples were drawn at time –30, –15, 0, and thereafter every 30 minute until discontinuation of the infusion. Plasma glucose concentrations were measured every 5–10 minutes for clamp adjustments.
Blood samples were drawn simultaneously from the two catheters for measurements of TAG, glycerol, free fatty acids (FFA) and glucose. In addition, blood was collected from the artery for measurements of GIP, insulin, and C-peptide.
Blood samples were collected into iced chilled tubes (Vacuetta; Greiner Labortechnic). Tubes for intact GIP contained EDTA and a specific DPP-4 inhibitor (valine-pyrrolidide; 0.1 μmol/liter, final concentration; a gift from Novo Nordisk A/S), and tubes for insulin and C-peptide contained heparin. Tubes for glucose, TAG, FFA, and glycerol contained EDTA. All samples were centrifuged within 15 minutes for 15 minutes at 5000 × g at 4 C and stored at –80 C until analysis.
Blood analysis
Intact GIP was measured using as described (20). The assay is specific for the intact N terminus of GIP, the presence of which is required for biological activity of the peptide.
Plasma glucose (Glucose/HK, Roche Diagnostics), TAG (Triglyceride GPO-PAP, Roche Diagnostics), FFA (NEFA C kit, Wako Chemicals), and glycerol (Boehringer Mannheim) were measured by enzymatic methods modified to run on a COBAS 6000 automatic analyzer (Roche).
Plasma insulin and C-peptide concentrations were measured by auto-DELPHIA automatic fluoroimmunoassay (Wallac, Inc.).
Plasma glucose was measured bedside during the clamp experiments using the Radiometer ABL 725 blood gas analyzer (Radiometer Corp.).
Calculations and statistical analysis
The adipose tissue blood flow (adipose tissue perfusion coefficient) was calculated from the mean washout rate constant determined in 30-minute periods corresponding to the time points when blood samples were drawn. ATBF was then calculated according to the equation ATBF = −k × [λ] × 100, where k is the Xenon wash-out constant and [λ] is the tissue/blood partition coefficient ([λ]) for Xenon (21).
The sc abdominal adipose tissue metabolic net fluxes were calculated by multiplication of the arterio-venous or veno-arterial concentration differences of the metabolites and the appropriate flow value (whole blood for calculation of glycerol and glucose fluxes (22) and plasma flow for calculation of fatty acid and TAG fluxes).
All results are presented as mean ± SEM. Area under the curve (AUC) was calculated using the trapezoidal rule and are presented as the incremental values. The significance of changes in ATBF, arterial hormone, and metabolite concentrations with time was evaluated using two-way ANOVA for repeated measures. Significant differences in ATBF AUC and metabolite fluxes were evaluated by paired t test. P values of <.05 were considered statistically significant.
Results
Arterial hormone and glucose concentrations
During GIP infusion, intact plasma GIP concentrations increased significantly from fasting levels and after approximately 30 minutes reached mean plateau levels of 44.3 ± 1.4 pM during Eugluc-Hiinsu clamp, 41.3 ± 0.4 pM during Hygluc-Euinsu clamp, and 40.8 ± 1.2 pM during Hygluc-Hyinsu clamp (Figure 1A, P < .001) all corresponding to physiological postprandial levels.
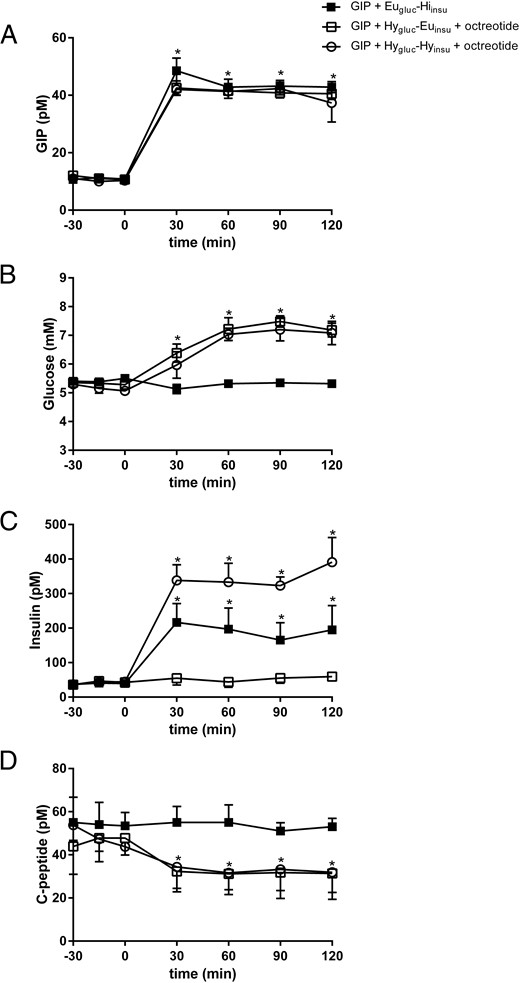
Plasma arterial GIP (A), glucose (B), insulin (C), and C-peptide (D) concentrations during GIP infusion in combination with Eugluc-Hiinsu clamp (solid square), Hygluc-Euinsu clamp with octreotide (open square), and Hygluc-Hyinsu with octreotide (open circle).
Data are mean ± SEM. *P < .05 vs. basal state.
The clamps were carried out successfully. During the Eugluc-Hiinsu clamp, plasma glucose levels were maintained at 5.1 ± 0.05 mM throughout the study (Figure 1B). Plasma insulin levels increased significantly and reached target levels of 193 ± 11 pM at 30 minutes after the start of infusion, which were maintained throughout the remainder of the study (Figure 1C; P < .0001). Plasma C-peptide levels were virtually constant throughout the clamp at 53 ± 1 pM (Figure 1D).
During Hygluc-Euinsu clamp in combination with octreotide infusion, plasma glucose levels increased during the first 60 minutes and remained at 7 ± 0.2 mM throughout the remainder of the study (Figure 1B). Plasma insulin levels remained constant and on an average at 52.5 ± 3.2 pM (Figure 1C). Plasma C-peptide levels decreased significantly during the first 30 minutes and remained at 31.7 ± 0.3 mM (Figure 1D, P = .04).
During the Hygluc-Hyinsu clamp in combination with octreotide infusion, plasma glucose levels reached the target level of 6.8 ± 0.3 mM 60 minutes after the start of the infusion, which was maintained throughout the study. Plasma insulin levels were significantly higher compared to insulin levels during the Eugluc-Hiinsu clamp and reached mean target levels of 347 ± 15 mM, P = .003, after 30 minutes (Figure 1C). Mean fasting plasma C-peptide level was 48.3 ± 2.9 pM and decreased significantly as expected to 32.8 ± 0.6 pM (Figure 1D, P = .03).
The arterial concentrations of the metabolites were measured during Eugluc-Hiinsu and Hygluc-Euinsu clamps and are given in Figure 2. We did not measure metabolites during the Hygluc-Hyinsu clamp as this had already been done in our previous study (11) where arterial TAG, FFA, and glycerol concentrations decreased significantly.
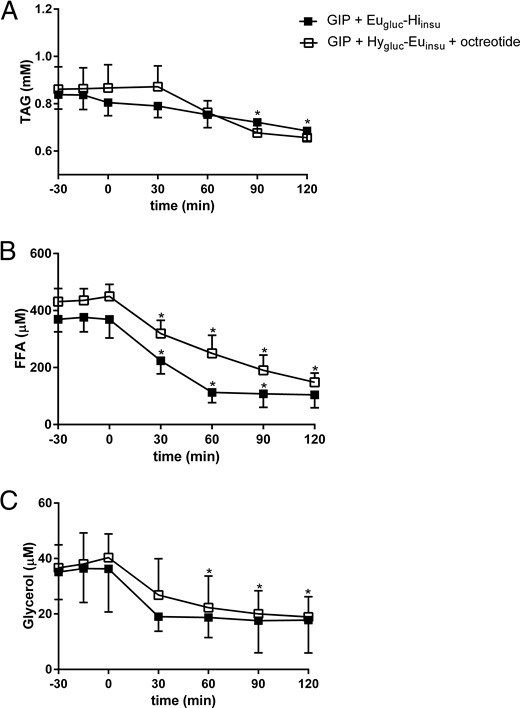
Plasma arterial TAG (A), FFA (B) and glycerol (C) concentrations during GIP infusion in combination with Eugluc-Hiinsu clamp (solid square) and Hygluc-Euinsu clamp with octreotide (open square).
Data are mean ± SEM. *P < .05 vs. basal state.
Arterial TAG concentrations were similar during the two clamps and exhibited a slight decrease toward the end of the study (Figure 2A). Arterial FFA and glycerol concentrations decreased significantly (P = .02), with no differences seen between the two clamps (Figure 2, B and C).
Changes in subcutaneous abdominal ATBF
Figure 3 shows the sc abdominal ATBF during the three clamps. Baseline ATBF did not differ between the three study days (2.1 ± 0.2, 2.4 ± 0.5, and 2.1 ± 0.5 ml min-1 [100 g tissue]-1). ATBF increased about 3-fold during GIP infusion and Eugluc-Hiinsu clamp to a mean level at 6.9 ± 0.7 ml min-1 (100 g tissue)-1 after 30 minutes (Figure 3A, P = .03). Likewise, ATBF increased 3-fold during GIP infusion and Hygluc-Hyinsu clamp to a mean level at 7.6 ml min-1 (100 g tissue)-1 after 30 minutes (Figure 3A, P = .001). No significant differences were seen during the two clamp days. ATBF remained stable during GIP infusion and Hygluc-Euinsu clamp at 2.7 ± 0.4 ml min-1 (100 g tissue)-1. ATBF AUC (ml [100 g tissue]-1 (120 minutes)-1 was also greater during GIP infusion in combination with Eugluc-Hiinsu and Hygluc-Hyinsu clamp than during the Hygluc-Euinsu clamp (P < .05, Figure 3B).
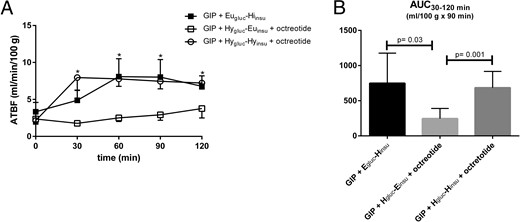
Absolute ATBF (A) during GIP infusion in combination with Eugluc-Hiinsu clamp (solid square), Hygluc-Euinsu clamp with octreotide (open square), and Hygluc-Hyinsu with octreotide (open circle).
The integrated net increase in blood flow in the period 30–120 minutes (B) after commencement of infusions. Data are mean ± SEM. *P < .05 vs. basal state.
Changes in net fluxes of TAG, FFA, glycerol, and glucose
Figure 4 shows net fluxes of TAG, FFA, glycerol, and glucose in adipose tissue. Baseline TAG, FFA, glycerol, and glucose fluxes were similar during GIP infusion and Eugluc-Hiinsu and Hygluc-Euinsu clamp, respectively (Figure 4, A, C, E, and G). TAG clearance (P = .03, Figure 4B) increased and FFA output (P = .01, Figure 4D) and glycerol output (P = .02, Figure 4F) decreased significantly during GIP infusion and Eugluc-Hiinsu clamp compared to the Hygluc-Euinsu clamp. Likewise, there was a tendency of increased glucose uptake during the Eugluc-Hiinsu clamp with GIP; however, this was not significant. In addition, a decreased FFA/glycerol output ratio was seen during GIP infusion and Eugluc-Hiinsu clamp (P = .04, Figure 4J) compared to the Hygluc-Euinsu clamp.
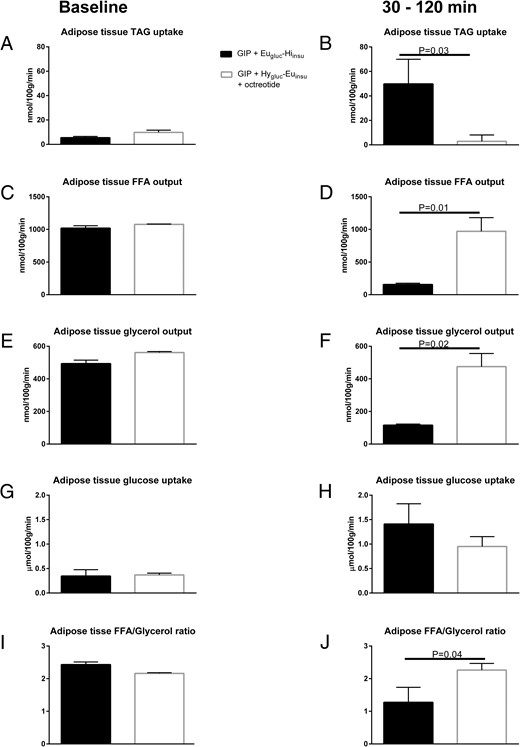
Average net fluxes of TAG, FFA, glucose, and glycerol in sc abdominal adipose tissue during the preinfusion baseline period (A, C, E, G) and in the steady-state period from 30 to 120 minutes (B, D, F, H) after commencement of infusions.
Average adipose tissue FFA/glycerol output ratio during the preinfusion baseline period (I) and in the period from 30 to 120 minutes (J) after commencement of infusions. Data are mean ± SEM.
Discussion
In this study, we designed a series of experiments to investigate whether insulin plays a permissive role in GIP-induced increase in ATBF and whether this effect is dependent of C-peptide and glucose. We used a euglycemic and high insulinemic clamp (Eygluc-Hiinsu) and successfully managed to mimic the plasma insulin concentrations after a meal while maintaining C-peptide concentrations at fasting levels. In addition, we used a Hygluc-Euinsu clamp in combination with somatostatin analog octreotide to mimic postprandial plasma glucose levels after a meal while maintaining plasma insulin at fasting levels and ensuring low plasma C-peptide levels. Further, we used a Hygluc-Hyinsu clamp, likewise in combination with octreotide, to mimic postprandial plasma glucose levels in combination with supraphysiological insulin concentrations and low plasma C-peptide levels. During the GIP infusions, plasma GIP concentrations reached physiological postprandial levels (23) unlike plasma GIP concentrations during hyperinsulinemic-hyperglycemic clamp in our previous study, which remained at fasting levels throughout the study (11).
During low insulin and C-peptide concentrations, GIP infusion did not induce vasodilatation in adipose tissue. In contrast, Eugluc-Hiinsu and Hygluc-Hyinsu with octreotide induced an increase in ATBF during the GIP infusion. The increase was similar during the two experiments, indicating that there was no additional effect of isolated hyperglycemia or supraphysiological insulin levels. Simultaneously with the increase in ATBF, an increase in adipose tissue TAG clearance took place.
The mechanisms, by which ATBF is regulated in the postprandial period, have been studied in some detail. There are many possible regulators of ATBF including neural and endocrine systems (11, 24–27). ATBF may well be regulated by more than one system at any one time. In humans, adrenergic influences are predominant, with β-mediated vasodilatation (24, 26) and α2-mediated vasoconstriction (28). These influences may explain the increased blood flow during fasting or exercise. The increase in blood flow following feeding parallels that of plasma GIP and insulin concentrations (10). The blood flow response to feeding is blocked by propranolol infusion (completely in some local adipose tissue regions and partially in others) (26), suggesting that it is dependent upon sympathetic activation induced by postprandial hyperinsulinemia. It is controversial whether insulin per se regulates adipose tissue blood flow. Previous reports have demonstrated that hyperinsulinemia under conditions of euglycemia (29, 30) or hypoglycemia (31) increased ATBF, but other studies showed no effect during euglycemia (32). Another study reported that ATBF was markedly higher with oral glucose than during the IV insulin-glucose regimen (33). The reasons for these discrepancies are not obvious, but may reflect differences in the methodology for the determination of ATBF, as the currently employed Xenon-washout technique is likely to be more sensitive than microdialysis ethanol inflow/outflow ratios. We have previously shown that neither insulin nor GIP per se has any effect on ATBF but that GIP with hyperinsulinemia increased ATBF and increased adipose tissue TAG deposition (11). The present study clearly shows that the increase in subcutaneous ATBF induced by GIP occurs only in the presence of hyperinsulinemia. We found a pronounced absolute increase in ATBF during the hyperinsulinemic clamp mimicking postprandial insulin levels. Administration of even larger amount of insulin did not elicit further increases in ATBF indicating that insulin exerts a permissive but not additive role for the vasoactivity of GIP. ATBF increased similarly during the euglycemic clamp, showing that there is no additional effect of hyperglycemia.
During the progression to obesity, adipose tissue is one of the first organs affected by insulin resistance (34). Although circulating levels of GIP are usually increased in obese and patients with type 2 diabetes mellitus, the insulinotropic activity of GIP is blunted under these conditions (35). Given the results here, we recently demonstrated that the effect of GIP on ATBF in obese subjects with impaired glucose tolerance is blunted (12) and we further showed that weight loss in obese subjects induced by caloric restriction partly restored the increase in ATBF during GIP infusion in combination with a hyperinsulinemic clamp (13). Thus, our recent findings could either be explained by a direct improvement in the GIP sensitivity or a combination of improvements in both GIP and insulin sensitivity that contributed to the improved vascular effect of GIP. These studies indicate that there is a link between GIP and insulin sensitivity in subcutaneous adipose tissue in line with findings in several other studies. It has been shown that alterations in GIP receptor expression in sc adipose tissue might be associated with signs of insulin resistance in nondiabetic women with central obesity (36). Further, recent research indicates that GIP receptor expression in sc adipose tissue is inversely associated with body mass index (37). Thus, obese subjects with the highest degree of insulin resistance exhibit the lowest levels of GIP receptors.
During the recent years, the role of C-peptide in regulating blood flow, has received increasing attention (15). C-peptide has been described to act as a vasodilator in patients with type 1 diabetes mellitus, where short-term systemic infusions of C-peptide increased forearm blood flow at physiological concentrations (14, 16). Interestingly, the vascular effects of C-peptide on forearm blood flow were found only in patients with type 1 diabetes and not in healthy subjects (38), which is in agreement with our present study. Thus, we found a similar increase in ATBF in spite of decreased C-peptide concentrations, indicating that C-peptide is not likely a candidate for the increase in ATBF.
Concomitantly with the increase in ATBF, an increase in adipose tissue TAG clearance took place, confirming our previous findings, and reflecting an increased substrate supply to lipoprotein lipase similar to that seen after a mixed meal. TAG clearance by adipose tissue is closely related to blood flow when this is increased by epinephrine infusion (8). Recently, we have presented evidence for capillary recruitment taking place in adipose tissue after an oral glucose load concomitantly with the increase in ATBF (39). This will expand the endothelial surface for nutrient and hormone exchange from blood to tissue. The capillary recruitment will also help to expose more lipoprotein lipase to its substrate and thereby to promote clearance of circulating TAG. Whether the vascular effects found in the present experiments partly or totally are due to increased microvascular volume changes in adipose tissue remains to be elucidated.
Simultaneously with the increased TAG clearance, an increase in adipose tissue glucose uptake and increase in FFA re-esterification took place during GIP and hyperinsulinemia, resulting in increased adipose tissue TAG deposition, thus confirming our previous results.
In conclusion, insulin is permissive for GIP to induce an increase in ATBF and TAG clearance in subcutaneous abdominal adipose tissue in healthy lean humans and this effect is independent of C-peptide.
Acknowledgments
Disclosure Summary: The authors have nothing to disclose.
Abbreviations
- ATBF
adipose tissue blood flow
- AUC
area under the curve
- Eugluc-Hiinsu
euglycemic–high insulinemic clamp
- FFA
free fatty acid
- GIP
glucose-dependent insulinotropic polypeptide
- Hygluc-Euinsu
hyperglycemic–euinsulinemic clamp
- Hygluc-Hyinsu
hyperglycemic-hyperinsulinemic clamp
- TAG
triglyceride.
