


The Testosterone Trials are a coordinated set of seven trials to determine the efficacy of T in symptomatic men ≥65 years old with unequivocally low T levels. Initial results of the Sexual Function Trial showed that T improved sexual activity, sexual desire, and erectile function.
To assess the responsiveness of specific sexual activities to T treatment; to relate hormone changes to changes in sexual function; and to determine predictive baseline characteristics and T threshold for sexual outcomes.
A placebo-controlled trial.
Twelve academic medical centers in the United States.
A total of 470 men ≥65 years of age with low libido, average T <275 ng/dL, and a partner willing to have sexual intercourse at least twice a month.
Men were assigned to take T gel or placebo for 1 year. Sexual function was assessed by three questionnaires every 3 months: the Psychosexual Daily Questionnaire, the Derogatis Interview for Sexual Function, and the International Index of Erectile Function.
Compared with placebo, T administration significantly improved 10 of 12 measures of sexual activity. Incremental increases in total and free T and estradiol levels were associated with improvements in sexual activity and desire, but not erectile function. No threshold T level was observed for any outcome, and none of the 27 baseline characteristics predicted responsiveness to T.
In older men with low libido and low T levels, improvements in sexual desire and activity in response to T treatment were related to the magnitude of increases in T and estradiol levels, but there was no clear evidence of a threshold effect.
Testosterone Treatment and Sexual Function in Older Men with Low Testosterone Levels. Improvements in sexual desire and activity were related to the magnitude of increases in testosterone.
Testosterone treatment improves sexual function in younger men who have T deficiency due to disorders of the testes, the pituitary, or the hypothalamus (1, 2) or to administration of a GnRH agonist (3, 4) or antagonist (5). However, the efficacy of T treatment in improving sexual function in older men with age-related decline of T levels remains unclear (6, 7). Meta-analyses have found that T treatment improves libido and to a lesser degree erectile function in predominantly middle-aged men with low total T levels (8, 9). These analyses were based upon a limited number of trials, several of which included fewer than 60 men and none of which included more than 140 men per treatment arm. T treatment has improved sexual function in some trials, but not in others (6, 10–12). Most placebo-controlled trials of T treatment in older men have lacked adequate statistical power due to small sample size, and few trials have included men with sexual symptoms. In fact, some trials selected men for inclusion based on no specific symptoms or nonsexual symptoms such as frailty (11). In other trials, men with low normal T levels were included, and sexual function was assessed in some trials using nonvalidated questionnaires (6). More recently, T treatment was reported to improve sexual desire, erectile function, and sexual activity in a randomized, placebo-controlled 12-week trial that included 715 men with a mean age of 55.3 ± 11.0 years, low sex drive or decreased energy, and total T levels on two occasions <300 ng/dL (13).
Studies of the relationship between T levels and sexual function in older men have produced conflicting results (6, 14, 15). Sexual function is known to decline with advancing age (16), as do total and free T levels (17, 18). In the European Male Aging Study, total and free T levels, but not estradiol or dihydrotestosterone, were associated with sexual function in middle-aged and older men (19).
The Testosterone Trials (TTrials) are a coordinated set of seven double-blind, placebo-controlled trials to assess the efficacy of T treatment of symptomatic older men with low T (20). One of the trials, the Sexual Function Trial, was designed to avoid the deficiencies of prior studies of sexual function described above. The primary results from this trial demonstrated that raising T levels in men ≥65 years of age with reduced sexual desire and low total T levels improved sexual activity, sexual desire, and erectile function (21).
The objectives of the current analyses were: to determine whether the effects were uniform across the 12 measures of sexual activity, assessed by the Psychosexual Daily Questionnaire (PDQ); to identify baseline participant characteristics that predicted responsiveness to T treatment; and to evaluate the extent to which the magnitude of improvements in sexual activity, sexual desire, and erectile function was related to the magnitude of increases in sex hormone levels. We also evaluated whether there was evidence to support potential threshold effects, ie, of on-treatment T levels that needed to be exceeded to observe improvements.
Subjects and Methods
Study design
The participants in the TTrials were assigned to receive transdermal T or placebo gel for 1 year. Changes in sexual function were assessed at baseline and 3, 6, 9, and 12 months.
Participant allocation
We allocated participants to either placebo or T arms using minimization, with participants assigned to the optimally balancing treatment with 80% probability (22, 23). Balancing variables included participation status for each of the three main trials, trial site, screening T concentration under or over 200 ng/dL, age under or over 75, and use of antidepressants and phosphodiesterase type 5 (PDE5) inhibitors.
Intervention
The T preparation was AndroGel 1% in a pump bottle (supplied by AbbVie). The initial dose was 5 g daily. Placebo gel identical to AndroGel but without the active ingredient also was supplied by AbbVie.
Serum T concentrations were measured at months 1, 2, 3, 6, and 9 in a central laboratory (Quest Clinical Trials), and the dose of T gel was adjusted after each measurement to attempt to keep the concentration within the normal range for young men. The target range was initially 400–800 ng/dL, but it was changed to 500–800 ng/dL after early trial data showed that the median T concentration in the men assigned to the T arm was 400–500 ng/dL, below the middle of the target range. Compliance was assessed by weighing used and unused pump bottles.
Blinding
The participants, the study staff at the trial sites, and the investigators were blinded to treatment allocation. Only the Data Coordinating Center and the pharmacist were aware of the treatment allocation. To maintain blinding, when the dose was adjusted in a participant taking T, the dose was changed simultaneously in a participant taking placebo.
Participants
Participants were recruited principally by mass mailings, followed by telephone and in-clinic screenings (24). Inclusion criteria for TTrials included age ≥65 years, two early morning fasting total T values with an initial total T <275 ng/dL, a second <300 ng/dL, and an average <275 ng/dL. To qualify for the Sexual Function Trial, men had to report low libido, score <20 on the Derogatis Interview for Sexual Function-Sexual Desire Domain (DISF-SDD) (25), and have a heterosexual partner willing to have sexual intercourse at least twice a month (20). Men who qualified for the Sexual Function Trial could participate in more than one trial. The primary outcome measure for the Sexual Function Trial also was collected in all men who qualified for the TTrials.
The protocol and consent forms were approved by the institutional review boards of the University of Pennsylvania and all trial sites. All participants provided written, informed consent. A data and safety monitoring board monitored unblinded safety data every 3 months and reviewed overall trial progress every 6 months.
Hormone measurements
At the end of the trial, the serum concentrations of T, free T, estradiol, and SHBG collected at baseline and 3, 6, 9, and 12 months were measured on sera frozen at −80°C in the Brigham Research Assay Core Laboratory, Boston, Massachusetts. All samples from each participant were measured in the same assay run. Total T (18) and estradiol levels were measured by liquid chromatography and tandem mass spectrometry, and free T was assayed by equilibrium dialysis (26). The lower limit for detection of T is 1 ng/dL, and the interassay coefficient of variation was <7%. The lower limit for quantitation of estradiol is 1 pg/mL, and the interassay coefficients of variation were 10.1, 8.5, and 6.3%, respectively, in quality control daily pools with estradiol concentrations of 8, 57.1, and 157.0 pg/mL, respectively. SHBG was assayed by a two-site immunochemiluminescence assay (Beckman-Coulter, Inc) whose lower limit of quantitation was 0.3 nmol/L.
Outcomes
The primary outcome was a change in sexual activities, measured over a 7-day period using question 4 of the PDQ (PDQ-Q4) (27), which includes 12 specific questions about sexual interests and activities. The PDQ was administered by interactive voice response to preserve privacy (28). Secondary outcomes included measures of sexual desire and erectile and orgasmic function. Sexual desire was assessed at baseline and 3, 6, 9, and 12 months with the DISF-SDD. Erectile function was evaluated by the International Index of Erectile Function (IIEF)-Erectile Function Domain (EFD), and orgasmic function was evaluated by the IIEF-Orgasmic Function Domain (IIEF-OFD) (29). A score of <20 on the DISF-SDD is indicative of reduced sexual desire (ie, low libido), and a score of <22 on the IIEF-EFD is indicative of erectile dysfunction. The patient global impression of change in sexual desire also was assessed using a standardized question.
Statistical analysis
Although longitudinal analyses utilizing data from all postbaseline visits were planned, the sample size was conservatively based on comparisons between baseline and 12 months and accounted for potentially 5% of subjects not providing any postbaseline data. The enrollment target of 275 for the Sexual Function Trial was calculated to achieve 90% power to detect a 0.75 U change in the PDQ-Q4 with a two-sided type 1 error rate of 0.05 (20, 30). This enrollment target was reached before completing enrollment in the other trials; additional men were permitted to enroll if they were also enrolling in other trials that remained open.
All participants were included in the efficacy analyses in their assigned arm according to the intention-to-treat principle. Treatment arm comparisons were performed using random effects models that included the visit month as a categorical variable and a single main effect for treatment. For continuous outcomes, the treatment effect from the linear model is the difference in average response by treatment arm across all four visits. For binary outcomes, the treatment effect from the logistic model is the log odds ratio of a positive vs negative outcome for T vs placebo participants, averaged over all visits.
The effect of baseline characteristics on the responsiveness of sexual outcomes to T treatment was assessed by tests of interaction of the treatment arm with 27 characteristics (see legend in Table 1) thought to potentially influence the effect of T on sexual function outcomes. We adjusted for multiple comparisons by controlling the false discovery rate (31).
Characteristics of the Participants at Baseline
| Treatment Group | ||
|---|---|---|
| Placebo | T | |
| n | 236 | 234 |
| Demographics | ||
| Age, yb | 71.8 ± 5.4 | 71.4 ± 5.2 |
| Race | ||
| Caucasian | 207 (87.7) | 200 (85.5) |
| African American | 12 (5.1) | 15 (6.4) |
| Other | 17 (7.2) | 19 (8.1) |
| Ethnicity | ||
| Hispanic | 2 (0.8) | 10 (4.3) |
| Non-Hispanic | 234 (99.2) | 224 (95.7) |
| College graduate | 120 (50.8) | 129 (55.1) |
| Married or living with partnera | 219 (92.8) | 201 (85.9) |
| Concomitant conditions | ||
| BMI, kg/m2a | 31.1 ± 3.5 | 30.9 ± 3.5 |
| BMI >30 kg/m2 | 149 (63.1) | 145 (62.0) |
| Alcohol use, drinks/wka | 3.5 ± 5.0 | 3.4 ± 4.7 |
| Smoking | ||
| Current smokera | 22 (9.3) | 14 (6.0) |
| Ever smoker | 154 (65.3) | 141 (60.3) |
| Diabetesa | 84 (35.6) | 79 (33.8) |
| Hypertensiona | 170 (72.0) | 166 (70.9) |
| History of myocardial infarctiona | 34 (14.4) | 24 (10.3) |
| History of strokea | 9 (3.8) | 5 (2.1) |
| Sleep apneaa | 48 (20.3) | 44 (18.8) |
| International prostate symptom scorea | 9.3 ± 5.4 | 9.0 ± 5.3 |
| Risk of all prostate cancer, % | 17.5 ± 5.9 | 17.3 ± 6.0 |
| Risk of high-grade prostate cancer, % | 2.9 ± 1.7 | 2.9 ± 1.7 |
| Peripheral neuropathya | 12 (5.1) | 13 (5.6) |
| Hyperlipidemiaa | 177 (75.0) | 185 (79.1) |
| Coronary artery diseasea | 67 (28.4) | 54 (23.1) |
| Medication use | ||
| α Blocking agents | 28 (11.9) | 32 (13.7) |
| 5-α reductase inhibitors | 6 (2.5) | 7 (3.0) |
| Phosphodiesterase inhibitorsa | 24 (10.2) | 18 (7.7) |
| Antihypertensive medicationsa | 168 (62.2) | 157 (67.1) |
| Sex hormones | ||
| T, ng/dLa | 234.3 ± 63.0 | 233.7 ± 65.3 |
| Free T, pg/mL | 64.5 ± 21.6 | 63.4 ± 22.0 |
| Dihydrotestosterone, ng/dL | 20.5 ± 13.4 | 21.2 ± 10.8 |
| Estradiol, pg/mL | 20.2 ± 6.2 | 20.1 ± 6.5 |
| SHBG, nmol/L | 29.0 ± 13.2 | 30.9 ± 15.0 |
| Performance | ||
| Mini-mental state examination | 28.5 ± 1.6 | 28.5 ± 1.7 |
| Gait speed, m/s | 1.1 ± 0.2 | 1.1 ± 0.2 |
| PDQ-Q4 | 1.4 ± 1.3 | 1.4 ± 1.3 |
| IIEF-EFD | 7.8 ± 8.3 | 8.1 ± 8.1 |
| DISF-SDD | 11.6 ± 6.6 | 11.9 ± 6.7 |
| FACIT-fatigue | 37.8 ± 8.9 | 37.8 ± 8.9 |
| PANAS (+)a | 16.3 ± 3.6 | 16.4 ± 3.7 |
| PANAS (−)a | 7.0 ± 2.5 | 7.0 ± 2.5 |
| PHQ-9 (0–21) | 4.8 ± 3.7 | 5.0 ± 4.0 |
Abbreviations: PHQ-9, Patient Health Questionnaire-9; FACIT, Fatigue Functional Assessment of Chronic Illness Therapy. Data are expressed as number (percentage) or mean ± standard deviation unless specified otherwise. We used the Prostate Cancer Risk Calculator to estimate the risk of prostate cancer and of high-grade prostate cancer (41). Arbitrarily, only men with a risk <35% of prostate cancer and <7% of high-grade prostate cancer were included in the trial.
Assessed for impact on response to T treatment. Additional characteristics assessed but not included in Table 1 are: waist circumference, participation in the Vitality and Physical Function Trials, mean arterial pressure, hemoglobin A1c, serum creatinine, use of lipid-lowering medications, and cardiovascular risk score.
Age ≤75 years was assessed for impact on T response.
We also sought to evaluate the relation of the magnitude of changes in hormone levels above baseline with the changes in measures of sexual activity, desire, and erectile function in men assigned to the T group. All analyses were performed with random effects models for longitudinal data to accommodate multiple measures per participant and included balancing variables and the baseline response for each outcome as fixed effects. Random intercepts were included for participants. In these models, effects denote the average change in the outcome associated with a specified change in the hormone. Increments of 100 ng/mL, 20 pg/mL, and 5 pg/mL were considered for total T, free T, and estradiol, respectively, in separate models.
We calculated cardiovascular risk scores using the 2013 American College of Cardiology/American Heart Association risk calculator, which utilizes the risk factors of age, sex, race, total cholesterol, high-density lipoprotein cholesterol, systolic and diastolic blood pressure, treatment for hypertension, diabetes, and current smoker (32).
Finally, we investigated the possibility of hormonal thresholds for affecting clinical outcomes. We correlated hormone levels with scores on the PDQ-Q4, DISF-SDD, and IIEF-EFD using locally weighted linear regression in men assigned to receive T (33). This nonparametric regression technique allows the data to determine the shape of the association between hormones and sexual function outcomes and assess whether there exists a level of hormones such that beyond that level, sexual outcomes do not further increase on average.
We ran the analyses using SAS/STAT, version 9.4 (SAS Institute, Inc).
Results
Characteristics of the participants
We enrolled 470 men in the Sexual Function Trial. Mean ages in the placebo and T groups were 71.8 ± 5.4 and 71.4 ± 5.2 years, respectively. The placebo and treatment groups were generally well balanced on baseline characteristics (Table 1); there were more Hispanics in the T group and more men married and living with a partner in the placebo group (P = .02 for both comparisons); two such imbalances among 40 baseline characteristics are expected by chance. Over 60% of the men were obese. Approximately one-third had diabetes, and >70% had hypertension. Fewer than 11% of the men were using a PDE5 inhibitor. Depression scores, measured by Patient Health Questionnaire-9, were low (mean ± SD, 4.8 ± 3.7 and 5.0 ± 4.0 for the placebo and T groups, respectively).
Hormone levels
T treatment increased serum total and free T and estradiol levels into the mid-normal range for young, healthy men (ages 19–40 years) (Figure 1). Serum total and free T and estradiol levels did not change significantly in the placebo group. SHBG levels were not changed significantly in either group.
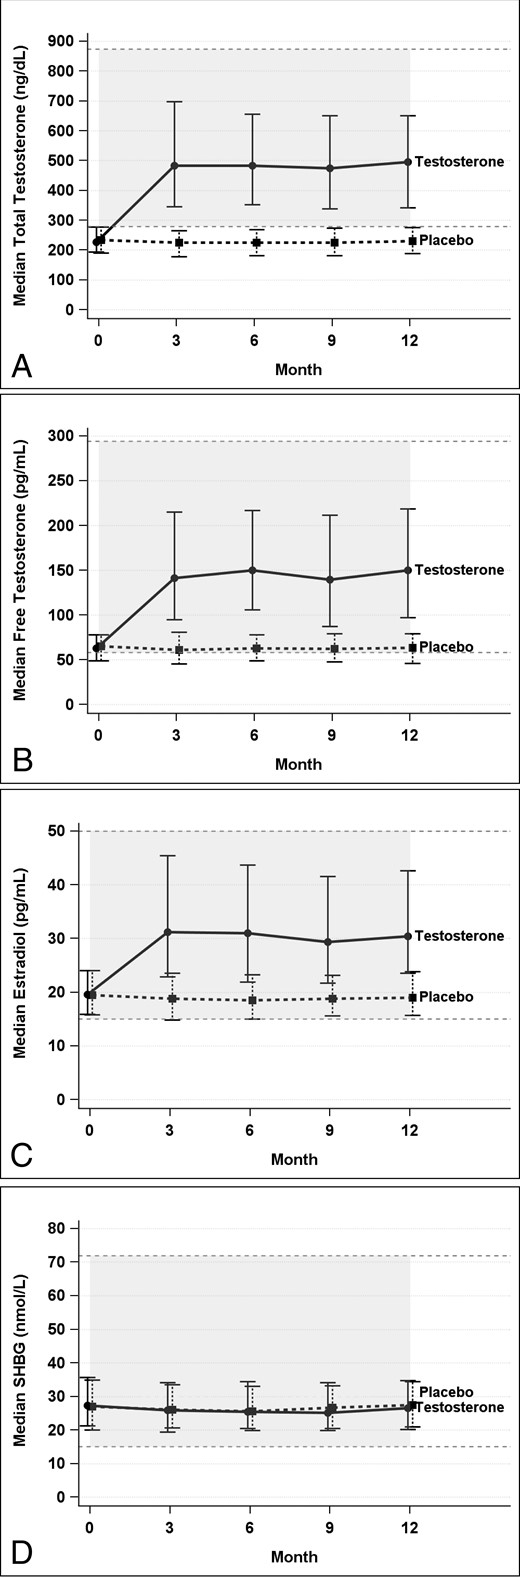
Total (A) and free (B) T, estradiol (C), and SHBG (D) levels at baseline and during treatment.
Effect of the intervention on measures of sexual activity
Figure 2A illustrates the effect of T treatment on each of the 12 measures of sexual activity in PDQ-Q4. Significant treatment effects were observed for all but two of the 12 activities (P < .001–.026), with “flirting by others” and “day spontaneous erections” being the only activities with a nonsignificant treatment effect. The 12 activities occur with varying frequency, with some occurring only 5% of days and others occurring as frequently as 40% of days (Figure 2B).
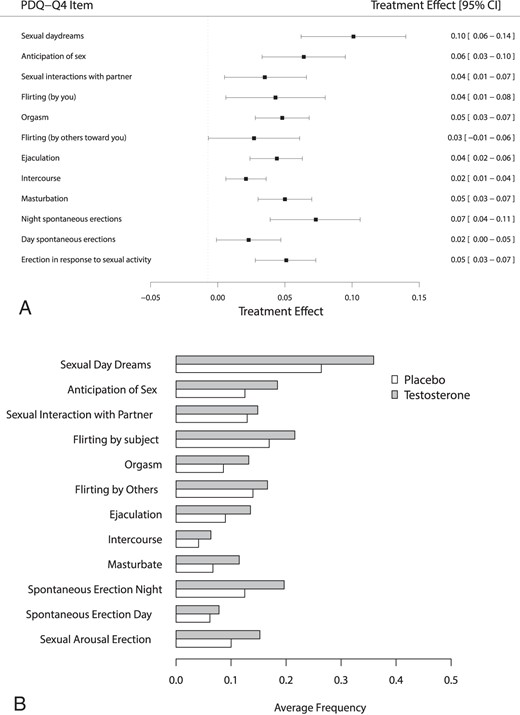
A, Forest plots showing the effect of treatment on each item of the PDQ-Q4. B, Average daily frequency of each item of the PDQ-Q4 by treatment group.
Participant characteristics affecting response to study intervention
We looked at possible treatment-covariate interactions to determine whether certain baseline participant characteristics influenced the effects of T treatment on primary and secondary endpoints in men in the Sexual Function Trial. Of the 27 baseline characteristics tested, only alcohol use appeared to influence the effect of T on sexual activity and sexual desire; more drinks per week were associated with a greater effect of T on sexual desire and activity scores. History of a stroke and higher scores on the International Prostate Symptom Score appeared to reduce the effect of T on sexual desire. Higher scores on the Positive and Negative Affect Scales (PANAS) and a history of coronary artery disease were associated with a lesser effect of T on erectile function. These interactions were all nominally significant at the 0.05 level, but none were significant after adjusting for multiple comparisons (31). Cardiovascular risk scores showed no association with responsiveness to T treatment (data not shown).
Relation of the changes in hormone levels with changes in sexual activity, desire, and erectile function
The magnitude of changes in total and free T and estradiol levels was significantly associated with the magnitude of improvements in sexual activity and sexual desire, but not erectile function (Table 2). Although these increments are small, the changes in the PDQ-Q4 and the DISF-SDD were highly significant. Increments in estradiol levels, but not in total or free T, were associated with greater improvement in orgasmic function. The IIEF-OFD score appears more strongly related to changes in estradiol levels than to changes in other hormones. We also compared changes in the DISF-SDD, PDQ-Q4, and IIEF-EFD for men with and without diabetes. In men assigned to T, there were no significant differences between persons with diabetes and nondiabetics for PDQ-Q4, DISF-SDD, or IIEF-EFD. In the placebo arm, a change in IIEF-EFD was on average 1.4 points higher in nondiabetic men than diabetic men (P = .04), but this difference is not expected to be clinically relevant. There were no significant differences in responses to the PDQ-Q4 or DISF-SDD in men treated with placebo. Our threshold analyses did not reveal any thresholds of sex steroid values with any of the sexual function outcomes (data not shown).
Association of Incremental Changes in Sex Hormones With Changes in Sexual Function
| Hormone | Unit Change | Estimate | 95% CI | P Value |
|---|---|---|---|---|
| PDQ-Q4 (range, 0–12) | ||||
| Total T | 100 ng/mL | 0.03 | 0.01, 0.06 | .01 |
| Free T | 20 pg/mL | 0.15 | 0.03, 0.27 | .015 |
| Estradiol | 5 pg/mL | 0.04 | 0.01, 0.07 | .003 |
| DISF-SDD (range, 0–33) | ||||
| Total T | 100 ng/mL | 0.18 | 0.07, 0.28 | <.001 |
| Free T | 20 pg/mL | 0.77 | 0.26, 1.27 | .003 |
| Estradiol | 5 pg/mL | 0.28 | 0.17, 0.39 | <.001 |
| IIEF-EFD (range, 0–30) | ||||
| Total T | 100 ng/mL | 0 | −0.11, 0.10 | .98 |
| Free T | 20 pg/mL | 0.12 | −0.41, 0.55 | .66 |
| Estradiol | 5 pg/mL | 0.06 | −0.05, 0.18 | .27 |
| IIEF-OFD (range, 0–10) | ||||
| Total T | 100 ng/mL | 0.04 | −0.01, 0.08 | .16 |
| Free T | 20 pg/mL | 0.22 | −0.02, 0.47 | .07 |
| Estradiol | 5 pg/mL | 0.09 | 0.04, 0.14 | <.001 |
Abbreviation: CI, confidence interval.
Discussion
To date, the Sexual Function Trial of the TTrials is the largest placebo-controlled trial of the efficacy of T on sexual function in older men with low libido and unequivocally low T levels. T administration was associated with consistent improvements in 10 of the 12 measures of sexual interests and activities, as assessed by PDQ-Q4. These include frequency of intercourse, masturbation, and nocturnal erections. Only “flirting by others” and “day spontaneous erections” were not changed by T treatment. Sexual desire and activity increased with increases in circulating total T, free T, and estradiol levels. We were not able to demonstrate T threshold levels for the sexual function outcomes.
These data are consistent with those from a recently reported trial of men with low sexual desire (85% of men) or decreased energy and low T levels, which reported significantly greater improvements in self-reported sex drive, erectile function, and sexual activity with T administration than with placebo; unlike the TTrials, this trial included much younger men who had a mean age of 55.3 years (13). Similar instruments were used in both trials to assess erectile function and sexual activity, and outcomes were similar. In both trials, T treatment improved sexual desire, erectile function, and sexual activity at 3 months, and in our trial it was sustained for the 12 months of treatment (21). The Testosterone Effects on Atherosclerosis in Aging Men Trial did not find a significant difference in the change in erectile function, sexual desire, or partner intimacy in men with a mean age of 66.9 ± 5.0 years and low normal T levels, who were not selected on the basis of sexual symptoms (12). Taken together, these data suggest that T therapy improves sexual desire, erectile function, and overall sexual activity in younger and older men with low libido and low T levels.
The consistency of the effects of T on multiple domains of sexual function—sexual desire, erectile function, and overall sexual activity—assessed using a number of self-reported instruments, is noteworthy. Additionally, the consistent improvements observed with T treatment on 10 of 12 measures of sexual activity is important and is supportive of the beneficial effects of T on sexual function in older men with low T levels.
The clinical significance of these findings is supported by the treatment effects and effect sizes on sexual outcomes and the change in daily sexual activities. We previously reported that sexual activity, the primary outcome of the Sexual Function Trial as measured by summation of 12 components of PDQ-Q4, showed a treatment effect of 0.58 (95% CI 0.38, 0.78; P < .001) and an effect size of 0.45 (95% CI 0.30, 0.60) (21). T treatment had a treatment effect of 2.93 (95% CI 2.13, 3.74; P < .001) and an effect size of 0.44 (95% CI 0.32, 0.56) on sexual desire and a treatment effect of 2.64 (95% CI 1.68, 3.61; P < .001) and an effect size of 0.32 (95% CI 0.20,0.44) on erectile function (21). Effect sizes of 0.5 are generally considered to indicate a moderate effect, whereas an effect of 0.2 is considered small. Although significant, the effect on erectile function is more modest than the 5.7 point increase in EFD scores observed when men 60 and older were treated with sildenafil (34). The global impression of change in sexual desire also was significantly improved (P < .001). Figure 2B documents that men in the T group had increases in 10 of 12 measurements of daily sexual activities.
We determined whether any of several factors that previously have been associated with sexual dysfunction, such as age, body mass index (BMI), diabetes, and use of alcohol and PDE5 inhibitors, affected responsiveness to T replacement. We found, however, that no individual interaction was significant when we adjusted for multiple comparisons. Because erectile function is dependent upon the integrity of vascular inflow, we also evaluated a cardiovascular risk score but found that this score also was not associated with responsiveness to T treatment. We also found that changes in the PDQ-Q4 and DISF-SDD from baseline of participants with diabetes were similar to those of men who did not have diabetes in both treatment arms. In the placebo arm, nondiabetic men had a greater change in IIEF-EFD scores than diabetic men, but this was not observed among men in the T arm. Importantly, we note that these men had low T levels as well as symptoms of sexual dysfunction.
The improvements in sexual desire and sexual activity in men assigned to T were related to the magnitude of changes in total and free T and estradiol levels, although the relationships were modest in magnitude. Median (interquartile range) of total T, free T, and estradiol at baseline were 227 (84), 62.3 (28.6), and 19.6 (8), respectively, and increased to 483 (318), 144.9 (120.5), and 30.5 (20.7) among men in the T arm during the 1-year treatment period. These changes in hormone levels were not directly related to dose, but rather serum levels of hormone; varying dose levels were required to achieve the desired target range of serum T concentration.
Previous T treatment trials in older men have evaluated T dose response relationships in men whose T levels were spontaneously low (6) or whose T levels were reduced with a GnRH agonist (35). Gray et al (35) noted that libido increased as the dose increased for men who were sexually active before the trial. These observations are consistent with our findings. Although we observed significant improvements in sexual activity, desire, and erectile function, only the changes in sexual desire and sexual activity were related to increments in T levels.
Some authors have reported that the serum T concentration needs to reach a threshold level near the lower limit of normal for adequate sexual function. This impression is supported by clinical experience (36, 37) and some population-based correlations (19). Investigators also have reported threshold effects when they evaluated libido and erectile function in men who were treated with a GnRH agonist to suppress the hypothalamic-pituitary-testicular axis, and also with graded doses of T (4, 35). Investigators reported a T threshold in the 200- to 300-ng/dL range when they correlated erections and penile rigidity in a sleep laboratory with T levels (38).
We reported previously that in the TTrials population at baseline, we found no threshold level of T for sexual desire, erectile function, or sexual activity (26). In the treatment phase of the TTrials, we evaluated men who received T to provide a greater range of circulating T concentrations, yet we still found no threshold. If a distinct threshold for total or free T exists, it may be lower than that in most of our participants. This effect may also be more difficult to detect in older men with multiple comorbidities, such as the TTrials population.
PDE5 inhibitors can improve erectile function in some, but not all, men with low T levels (39). Evidence that T treatment can improve responsiveness to a PDE5 inhibitor is conflicting (39, 40). Less than 11% of the men in our trial were using a PDE5 inhibitor at the beginning of the trial, and the number did not change significantly during the trial. The number of men using a PDE5 inhibitor was not sufficient to allow us to assess the interaction of PDE5 inhibitors and T levels.
Concomitant depression can be a confounding factor in trials evaluating sexual function. In our trial, depression scores were low. Use of antidepressants was employed as a balancing factor in the minimization routine. As such, treatment arms were expected to be balanced for depression. As a balancing factor, the use of antidepressants was included in all models, which would account for any possible residual confounding effects of depression. We previously reported that T treatment improved mood for participants in the Vitality Trial (21).
The TTrials have many strengths and some limitations. The TTrials required two low, early morning, fasting total T levels in men ≥65 years of age who did not have an organic cause for hypogonadism. The Sexual Function Trial also required low libido. We also used state-of-the-art hormone assays. The trial was powered at 90%, placebo-controlled, and double-blinded. We monitored total T levels and made dose adjustments to achieve and maintain serum T levels in the target range, while maintaining blinding. Finally, we used validated instruments to assess outcomes. Our primary outcome, sexual activity, utilized the PDQ-Q4, which had been shown to be responsive to T treatment in previous T trials (27, 30).
The men in the Sexual Function Trial were required to be in a stable relationship with a partner; however, we did not assess or control for partner sexual function or other partner factors, which may have influenced the results. T treatment increases estradiol levels as well as T levels, but the study design did not allow us to determine whether estradiol has an independent effect on sexual function.
In summary, T treatment of older men with low T levels consistently improved most types of sexual activity, sexual desire, and erectile function in older men with low libido and low T levels. The improvements in sexual desire, sexual interests, and sexual activities were related to changes in T, free T, and estradiol levels. We found no clinical characteristics that predicted responsiveness to T treatment and no T threshold for improving sexual function.
Acknowledgments
We acknowledge the superb work of the research coordinators who recruited and retained research participants and who performed the many aspects of this trial. Additionally, we appreciate the staff at the University of Pennsylvania who oversaw collection of the data.
The Testosterone Trials were supported by a grant from the National Institute on Aging (NIA), National Institutes of Health (NIH) (U01 AG030644), supplemented by funds from the National Heart, Lung, and Blood Institute, National Institute of Neurological Diseases and Stroke, and National Institute of Child Health and Human Development. AbbVie (formerly Solvay and Abbott Laboratories) generously provided funding, AndroGel and placebo gel. C.W. reports funding from CTSI (UL1TR000124). The Boston site was supported partly by the Boston Claude D. Pepper Older Americans Independence Center. A.M.M. was supported by the Department of Veterans Affairs Puget Sound Health Care System. T.M.G. is the recipient of an Academic Leadership Award (K24-AG021507) from the NIA. The Yale Field Center was partially supported by the Claude D. Pepper Older Americans Independence Center (P30-AG021342) and Yale CTSA (UL1 TR000142). C.E.L. was supported by the National Institute of Diabetes and Digestive and Kidney Diseases, NIH.
The investigators developed the protocol with assistance from the National Institutes of Health. AbbVie did not participate in the design, conduct of the trials, analysis, or reporting of the data. All authors participated in the design and conduct of the trials. Trial statisticians performed all data analyses. The first author wrote the first draft of the manuscript, and all authors contributed to subsequent drafts.
Clinical Trials.gov number: NCT00799617.
Disclosure Summary: G.R.C. has served as a consultant to AbbVie, Apricus, Besins, Clarus Therapeutics, Endo Pharma, Ferring, Lilly, Pfizer, and Repros Therapeutics, and he has served as an expert witness for Repros Therapeutics and Solvay. He has received research support from Ardana and Unimed. S.S.E. reports a conference grant from AbbVie during the conduct of the study. K.E.E. reports personal fees from Merck Sharpe & Dohme, outside the submitted work. A.M.M. reports grants from the National Institute on Aging, NIH, during the conduct of the study, grants and personal fees from AbbVie, personal fees from GlaxoSmithKline, personal fees from Endo, and personal fees from Lilly, outside the submitted work. C.E.L. was supported by the National Institute of Diabetes and Digestive and Kidney Diseases, NIH (DK079626) to the University of Alabama at Birmingham Diabetes Research and Training Center. M.E.M. reports grants from NIH during the conduct of the study, personal fees from AbbVie, grants and personal fees from Eli Lilly, grants from ENDO Health Solutions, and personal fees from Pfizer, outside the submitted work. C.W. reports grants from Besins Health International, another from AbbVie during the conduct of the study, and grants from Clarus Therapeutics outside the submitted work. S.A. reports grants from the University of Florida during the conduct of the study. S.Bh. has grant support from the NIA, National Institute of Nursing Research, and Foundation for the National Institutes of Health, AbbVie, Regeneron, Transition Therapeutics, and Lilly, Inc., and he has equity interest in Function Promoting Therapies, LLC. S.Ba. reports consulting fees from Sanofi, AbbVie, Novartis, NIA, National Institute of Nursing Research, and Foundation for the National Institutes of Health. R.S.S. reports grants and consulting fees from AbbVie, Clarus, Ardana, Besins Health, and Endo Pharma. P.J.S. reports grants from NIH and AbbVie for the conduct of this study and has consulted for Watson Laboratories. The remaining authors report no conflicts of interest.
Abbreviations
- BMI
body mass index
- DISF-SDD
Derogatis Interview for Sexual Function-Sexual Desire Domain
- EFD
Erectile Function Domain
- IIEF
International Index of Erectile Function
- OFD
Orgasmic Function Domain
- PANAS
Positive and Negative Affect Scales
- PDE5
phosphodiesterase type 5
- PDQ
Psychosexual Daily Questionnaire
- PDQ-Q4
question 4 of the PDQ.
