


During aging, total testosterone (TT) declines and SHBG increases, resulting in a greater decrease in calculated free T (cFT). Currently, guidelines suggest using TT to diagnose androgen deficiency and to reserve cFT only for men with borderline TT.
Our objective was to investigate if either low cFT or low TT is more strongly associated with androgen-related clinical endpoints.
A total of 3334 community-dwelling men, aged 40—79 years, were included in this study. Differences in clinical variables between the referent group of men with both normal TT (≥10.5 nmol/liter) and normal cFT (≥220 pmol/liter) with those who had normal TT/low cFT, low TT/normal cFT, and low TT/low cFT were assessed by regression models adjusted for age, center, body mass index, and comorbidities.
A total of 2641 men had normal TT (18.4 ± 5.5 [mean ± SD] nmol/liter)/normal cFT (326 ± 74 pmol/liter), 277 men had normal TT (14.2 ± 3.7)/low cFT (194 ± 23), 96 men had low TT (9.6 ± 0.7)/normal cFT (247 ± 20), and 320 men had low TT (7.8 ± 2.5)/low cFT (160 ± 55). Men with normal TT/low cFT were older and in poorer health. They had higher SHBG and LH and reported more sexual and physical symptoms, whereas hemoglobin and bone ultrasound parameters were lower compared to the referent group. Men with low TT/normal cFT were younger and more obese. They had lower SHBG, but LH was normal, whereas features of androgen deficiency were lacking.
Low cFT, even in the presence of normal TT, is associated with androgen deficiency-related symptoms. Normal cFT, despite low TT, is not associated with cognate symptoms; therefore, cFT levels should be assessed in men with suspected hypogonadal symptoms.
We studied if low free testosterone (T) or low total T is more strongly associated with androgen-related clinical endpoints. We showed that low free T is associated with hypogonadal signs and symptoms even if total T is normal.
Testosterone (T) in the circulation is bound to SHBG with high affinity and to albumin with low affinity; only a small fraction (2–5%) circulates as nonprotein bound or free T (FT) (1, 2). According to the “free hormone hypothesis,” only this free fraction enters the cell, activates the androgen receptor, and is thus responsible for the biological activity of androgens (1).
Moreover, in aging men, serum total T (TT) concentrations gradually decrease, despite circulating SHBG increasing considerably with age. The combination of a decline in TT with increasing SHBG thus results in a greater rate of decline of FT compared to TT (3).
Currently, the physiological significance as well as the applicability of FT in clinical practice remain unclear (2). The 2010 Endocrine Society guideline suggests using a repeated measurement of morning TT to confirm the diagnosis of hypogonadism in symptomatic men. In men with borderline TT levels and expected alterations in SHBG levels (such as in older men, obesity, or thyroid disorders), measuring FT concentrations by equilibrium dialysis in a reliable reference laboratory is recommended (4). The joint consensus statement from the International Society of Andrology, the International Society for the Study of Aging Male, the European Association of Urology, the European Academy of Andrology, and the American Society of Andrology (2008) suggests either calculating or measuring FT by equilibrium dialysis in men with TT levels between 8 and 12 nmol/liter, particularly in obese men (5). However, both guidelines acknowledge that there is no consensus regarding the role of FT in the diagnosis of hypogonadism and that a well-established reference limit is lacking. To date, it remains unclear to what extent FT and TT levels are differentially associated with hypogonadal symptoms in men.
Currently, directly measuring FT remains technically challenging and expensive (2, 4). The Endocrine Society position statement on measuring T emphasizes that for FT “even the best available measurement procedures have technical and fundamental limitations” (2). Equilibrium dialysis, the gold standard, is an expensive and technically challenging method, being only available in research and a few commercial laboratories, and its place in routine clinical practice is therefore very limited. Instead of equilibrium dialysis, calculated FT (cFT) is commonly used, with the most commonly used calculation (the Vermeulen formula) being based on the law of mass action (4–7). If accurate measurements of TT (preferably liquid chromatography–tandem mass spectrometry [MS/MS]) for low TT concentrations (2) and SHBG are used, cFT correlates well with measured FT (6, 8). Therefore, cFT can be a valid and practical alternative for measured FT (5). However, the utility of cFT or measured FT concentrations in assessing androgen status in aging men has not been investigated systematically.
The primary aim of our study was to examine if either low cFT or low TT is more strongly associated with androgen-related clinical endpoints in a population sample of middle-aged and elderly men. Second, we also investigated if low cFT and/or low TT is associated with the presence or development of the metabolic syndrome (MetS), cardiovascular disease, or all-cause mortality.
Materials and Methods
Study design
The design of the European Male Ageing Study (EMAS) has been described previously (9). Briefly, 3369 men, aged 40–79 years, were recruited for participation in EMAS in eight European centers: Manchester, UK; Leuven, Belgium; Malmö, Sweden; Tartu, Estonia; Lodz, Poland; Szeged, Hungary; Florence, Italy; and Santiago de Compostela, Spain. After a median follow-up time of 4.3 years (range, 2.95–5.7 years), 2736 men participated in phase 2. From the original cohort, 193 men had died and 440 were lost to follow-up. Deaths during follow-up were verified from death registers, medical or hospital records, death certificates, or via a family member/contact person. Ethical approval was acquired in accordance with local institutional requirements. All men gave written informed consent.
Laboratory measurements
At both phases, a single fasting morning venous blood sample was obtained from each subject. Hematological and biochemical parameters were assessed at the local health care facility. TT was measured by liquid chromatography-MS/MS as described previously (10). The lower limit of quantification was 0.25 nmol/liter. The coefficients of variation were less than 10% within assay runs and between assay runs. Total estradiol was measured by gas chromatography-MS/MS as described previously (limit of quantification, 0.07 nmol/liter, intra-assay and interassay coefficients of variation were <5%) (11). LH, SHBG, thyroid-stimulating hormone, free thyroxin (free T4) and IGF-1 were measured by the E170 platform electrochemiluminescence immunoassay (Roche Diagnostics). Calculated free T and calculated free estradiol were derived from TT and estradiol, respectively, and SHBG and albumin levels by the Vermeulen formula (6, 12). Insulin resistance was calculated using the homeostasis model assessment (13).
Assessments
At both phases, a postal questionnaire was used to obtain information on demographic factors, smoking habits and alcohol consumption, general health, comorbidities, and the use of prescription and nonprescription medication. Anthropometric measurements and Reuben's physical performance test (time to walk 50 feet) (14) were performed according to standardized methods (9). Mid-upper arm circumference was used as an indicator of lean body mass. An estimation of body fat percentage was calculated by the Siri equation, based on a subject's average density (which was calculated from skinfold thickness at triceps, biceps, subscapular, and iliac crest sites) (15, 16). There was a strong correlation (Spearman's rho = 0.68, P < .0001) between the calculated body fat percentage and body fat percentage measured by dual energy X-ray absorptiometry (available in subjects from Manchester and Leuven, n = 699).
Sexual, physical, and psychological symptoms were assessed by using the EMAS Sexual Function Questionnaire (17), the Medical Outcome Study 36-item short form health survey (18), and the Beck Depression Inventory (19), respectively. MetS was defined using the updated Adult Treatment Panel III criteria (20). When MetS or self-reported cardiovascular disease was absent at baseline, but present at follow-up, the subject was classified as “developing MetS” or “developing cardiovascular disease,” respectively.
Quantitative ultrasound of the left calcaneus was used to measure bone density because bone ultrasound measurements are a good indicator of future fracture risk (9, 21). It was performed with the Sahara Clinical Sonometer (Hologic, Inc.) by a standardized protocol used in all centers (22). Outputs included speed of sound (SOS; the velocity of ultrasound transmission through bone [m/s]) and broadband ultrasound attenuation (BUA; the rate of loss of ultrasound intensity with frequency [dB/MHz]). From SOS and BUA, estimated heel bone mineral density—0.002592 × (BUA + SOS) − 3.687 (g/cm2) and quantitative ultrasound index—0.41 (SOS) + 0.41 (BUA) − 571 (expressed as units)—were derived.
Statistical analysis
From baseline TT and cFT levels, a four-category variable was constructed, based on a TT level below or above 10.5 nmol/liter and a cFT level below or above 220 pmol/liter (2, 5, 23–25). The four categories were: 1) men with normal TT/normal cFT (referent); 2) normal TT/ low cFT, 3) low TT/normal cFT, and 4) low TT/low cFT. The threshold of 220 pmol/liter for cFT is based on previous analysis from the EMAS cohort, demonstrating that the presence of several sexual symptoms was clustered with a cFT level below 220 pmol/liter, whereas such clustering of symptoms was absent with a cFT level equal to or above 220 pmol/liter (23). Furthermore, 220 pmol/liter is consistent with the more arbitrary cutoff generally accepted to be the lower limit of normal for FT (2, 5, 24). We used receiver operating characteristic curves to assess the optimal cutoff for TT. A receiver operating characteristic analysis using TT as the continuous variable to predict cFT above or below 220 pmol/liter, resulted in an area under the curve of 0.87, indicating that TT was overall an acceptable predictor of cFT. We then calculated the sensitivity and specificity of several TT cutoffs to predict cFT concentrations above or below 220 pmol/liter. A TT cutoff of 10.5 nmol/liter had a specificity greater than 95% and yielded the highest percentage of men that were correctly classified (88.81%) based on a cFT cutoff of 220 pmol/liter and TT cutoff of 10.5 nmol/liter (Supplemental Table 1) (26).
Smoking status was stratified as current vs never and ex-smokers (referent). Alcohol intake was categorized as less than 4 days per week (referent) vs 5 or more days per week. General health was categorized as poor/fair vs good/very good/excellent (referent).
Differences between the TT/cFT groups (predictor) and continuous variables (outcome) were assessed by linear regression, for categorical outcome variables logistic regression was used. Questionnaire responses were assessed as multicategory ordinal variables. For frequency of sexual thoughts and morning erection frequency, the response sets were categorized as 1: none or once in the past month, 2: 2–3 times/month and 1 time/week, 3: 2–6 times/week, 4: at least 1/day, for sufficient erection for sexual intercourse the response categories were 1: never, 2: sometimes, 3: usually, 4: always. For physical symptoms, the response sets were 1: limited, 2: limited a little, 3: not limited; for psychological symptoms, the response sets were 1: worse, 2: poor, 3: OK. Ordinal logistic regression was used to assess questionnaire responses (outcome), with the TT/cFT groups as predictors. Adjustments were made for age, center, and the presence of comorbidities. Except when assessing body composition parameters, models were also adjusted for body mass index (BMI). All data were analyzed using Stata version 13.1 (StataCorp).
Results
Of the 3369 EMAS subjects recruited at baseline, 35 men were excluded because of missing TT or cFT; this analysis therefore included data from 3334 men. At baseline, 2641 (79.2%) men had TT levels of at least 10.5 nmol/liter and cFT levels of at least 220 pmol/liter. 277 (8.3%) men had normal TT levels, but low cFT levels. 96 (2.9%) men had low TT levels, but normal cFT. Finally, 320 (9.6%) men had both low TT and low cFT levels. Characteristics of the four groups are presented in Table 1. Compared to men with normal TT/normal cFT (referent group), both men with normal TT/low cFT and low TT/low cFT were older and in poorer health. On the other hand, men with low TT/normal cFT were younger and their self-reported general health was similar to men with normal TT/normal cFT.
Subject Characteristics According to T Status
| Normal TT | Normal TT | P Value | Low TT | P Value | Low TT | P Value | |
|---|---|---|---|---|---|---|---|
| Normal cFT | Low cFT | Normal cFT | Low cFT | ||||
| N, % 2641 (79.2%) | 277 (8.3%) | 96 (2.9%) | 320 (9.6%) | ||||
| General | |||||||
| Age, y | 58.9 (10.7) | 68.4 (9.3) | <.001 | 54.7 (9.2) | <.001 | 63.4 (10.8) | <.001 |
| Current smoking, % | 21.7 | 19.3 | .358 | 16.8 | .263 | 18.6 | .211 |
| Alcohol (≥5 days/week), % | 23.0 | 22.2 | .760 | 24.0 | .834 | 20.8 | .373 |
| Fair or poor general health, % | 30.3 | 50.6 | <.001 | 28.4 | .696 | 44.6 | <.001 |
| ≥1 comorbidity, % | 60.3 | 79.9 | <.001 | 63.5 | .520 | 80.4 | <.001 |
| Hormonal measurements | |||||||
| Total T, nmol/liter | 18.4 (5.5) | 14.2 (3.7) | <.001 | 9.6 (0.7) | <.001 | 7.8 (2.5) | <.001 |
| Calculated free T, pmol/liter | 325.7 (74.2) | 194.3 (22.7) | <.001 | 246.8 (19.5) | <.001 | 159.8 (55.3) | <.001 |
| Total estradiol, pmol/liter | 76.7 (23.6) | 70.1 (25.7) | <.001 | 58.9 (17.6) | <.001 | 54.8 (19.6) | <.001 |
| Free estradiol, pmol/liter | 1.3 (0.4) | 1.0 (0.4) | <.001 | 1.2 (0.4) | .040 | 1.0 (0.4) | <.001 |
| SHBG, nmol/liter | 43.2 (17.2) | 58.1 (21.9) | <.001 | 18.9 (4.2) | <.001 | 31.6 (15.0) | <.001 |
| LH, U/liter | 5.9 (3.0) | 8.8 (6.8) | <.001 | 4.8 (2.2) | .006 | 6.9 (6.8) | <.001 |
| TSH, U/liter | 1.7 (1.2) | 1.6 (1.2) | .680 | 1.7 (1.8) | .523 | 1.8 (1.7) | .050 |
| Free T4, ng/dL | 1.26 (0.22) | 1.27 (0.23) | .403 | 1.24 (0.24) | .550 | 1.23 (0.24) | .030 |
| IGF-1, ng/mL | 134.5 (42.3) | 116.5 (43.3) | <.001 | 152.9 (47.2) | <.001 | 128.3 (57.0) | .015 |
| Sexual function | |||||||
| Overall sexual function score | 21.8 (6.8) | 17.6 (7.2) | <.001 | 23.1 (5.4) | .087 | 18.9 (7.5) | <.001 |
| % men infrequent sexual thoughts | 25.1 | 42.3 | <.001 | 16.1 | .052 | 39.7 | <.001 |
| % men erectile dysfunction | 27.0 | 51.0 | <.001 | 18.1 | .059 | 45.2 | <.001 |
| % men infrequent morning erections | 35.5 | 64.1 | <.001 | 35.9 | .934 | 51.7 | <.001 |
| % men with 3 sexual symptoms | 9.3 | 25.9 | <.001 | 5.5 | .220 | 23.5 | <.001 |
| Physical function | |||||||
| Time to walk 50 feet, sec | 13.4 (3.2) | 25.0 (5.0) | <.001 | 13.2 (2.6) | .581 | 14.4 (3.3) | <.001 |
| SF36 physical function score | 50.7 (7.7) | 46.2 (9.6) | <.001 | 50.9 (7.9) | .845 | 47.6 (8.9) | <.001 |
| % men reduced vigorous activity | 21.9 | 41.7 | <.001 | 19.2 | .529 | 38.6 | <.001 |
| % men impairment in walking 1 km | 2.5 | 7.0 | <.001 | 3.2 | .678 | 7.0 | <.001 |
| % men impairment in bending | 5.2 | 13.8 | <.001 | 2.1 | .199 | 12.0 | <.001 |
| Psychological function | |||||||
| Beck depression inventory score | 6.7 (6.4) | 8.1 (7.0) | .001 | 6.0 (5.7) | .262 | 7.8 (6.7) | .005 |
| % men with sadness | 4.0 | 5.4 | .238 | 3.2 | .697 | 6.0 | .083 |
| % men with loss of energy | 5.3 | 9.5 | .005 | 0 | 7.9 | .059 | |
| % men with fatigue | 4.9 | 8.7 | .009 | 4.2 | .747 | 9.2 | .002 |
| Biochemical measurements | |||||||
| Hemoglobin, g/liter | 150.1 (10.7) | 146.4 (10.9) | <.001 | 148.7 (9.4) | .243 | 146.2 (13.0) | <.001 |
| hs-CRP, mg/liter | 0.39 (0.66) | 0.61 (1.11) | <.001 | 0.63 (0.94) | .016 | 0.77 (1.52) | <.001 |
| Glucose, mmol/liter | 5.5 (1.2) | 6.0 (2.0) | <.001 | 6.0 (1.6) | <.001 | 6.2 (2.0) | <.001 |
| HOMA-IR | 2.9 (3.4) | 4.3 (6.1) | <.001 | 4.4 (3.3) | <.001 | 5.5 (6.7) | <.001 |
| Body composition parameters | |||||||
| Waist circumference, cm | 97.1 (10.4) | 99.9 (11.7) | <.001 | 105.4 (9.5) | <.001 | 106.5 (12.1) | <.001 |
| Weight, kg | 82.3 (12.9) | 82.2 (14.7) | .924 | 92.3 (14.0) | <.001 | 90.9 (16.2) | <.001 |
| BMI, kg/m2 | 27.2 (3.7) | 27.7 (3.8) | .039 | 29.9 (3.9) | <.001 | 30.3 (4.4) | <.001 |
| Estimated % body fat | 27.4 (5.1) | 28.0 (5.5) | .049 | 30.7 (4.2) | <.001 | 30.3 (5.3) | <.001 |
| Mid-upper arm circumference (cm) | 31.6 (3.1) | 31.3 (3.5) | .108 | 33.8 (3.8) | <.001 | 33.6 (3.8) | <.001 |
| Having MetS, % | 29.3 | 44.6 | <.001 | 63.2 | <.001 | 62.5 | <.001 |
| Bone ultrasound measurements | |||||||
| Speed of sound, m/sec | 1552 (32) | 1542 (32) | <.001 | 1549 (27) | .395 | 1543 (30) | <.001 |
| Broadband ultrasound attenuation, dB/MHz | 80.7 (17.9) | 74.9 (19.9) | <.001 | 81.1 (16.0) | .855 | 77.0 (18.0) | .001 |
| Quantitative ultrasound index | 98.4 (20.0) | 91.8 (20.6) | <.001 | 97.3 (16.7) | .605 | 93.3 (19.1) | <.001 |
| Estimated heel bone mineral density, g/cm2 | 0.55 (0.13) | 0.50 (0.13) | <.001 | 0.54 (0.11) | .623 | 0.51 (0.12) | <.001 |
Continuous variables are expressed as mean (standard deviation), categorical variables as percentages. P value for unadjusted linear (continuous variables) and logistic (categorical variables) regression, with normal TT/normal cFT as the referent group.
TSH, thyroid stimulating hormone; free T4, free thyroxin; HOMA-IR: homeostasis model assessment of insulin resistance.
Hormone measurements
As expected, men in the normal TT/normal cFT group had the highest TT and cFT levels (Table 1). Men with normal TT/low cFT had TT levels of 14.2 ± 3.7 nmol/liter, with cFT levels of 194.3 ± 22.7 pmol/liter. Men with low TT/normal cFT had a mean TT level of 9.6 ± 0.7 nmol/liter and normal cFT levels of 246.8 ± 19.5 pmol/liter. Men in the low TT/low cFT group had the lowest TT and cFT levels (7.8 ± 2.5 nmol/liter and 159.8 ± 55.3 pmol/liter, respectively) (Table 1).
Total and free estradiol concentrations were highest in men with normal TT/normal cFT and lowest in men with low TT/low cFT. After adjustments, men with low TT/normal cFT had lower total estradiol levels than men with normal TT/low cFT, whereas levels of free estradiol were lower in men with normal TT/low cFT than in men with low TT/normal cFT (Tables 1 and 2).
Associations Between T Status and Sex Steroids, SHBG, and LH
| Normal TT | Low TT | Low TT | |
|---|---|---|---|
| Low cFT | Normal cFT | Low cFT | |
| β-coefficient (95% CI) | β-coefficient (95% CI) | β-coefficient (95% CI) | |
| Total T | |||
| Unadjusted | −4.21 (−4.84, −3.59)*** | −8.85 (−9.88, −7.81)*** | −10.67 (−11.26, −10.08)*** |
| Age, center, BMI, comorbidities | −4.18 (−4.81, −3.56)*** | −7.54 (−8.54, −6.53)*** | −9.46 (−10.05, −8.86)*** |
| Calculated free T | |||
| Unadjusted | −131.5 (−140.0, −123.0)*** | −78.9 (−92.9, −64.9)*** | −165.9 (−173.9, −158.0)*** |
| Age, center, BMI, comorbidities | −106.8 (−115.1, −98.6)*** | −78.5 (−91.8, −65.2)*** | −144.8 (−152.7, −136.9)*** |
| Total estradiol | |||
| Unadjusted | −6.59 (−9.49, −3.69)*** | −17.8 (−22.6, −13.0)*** | −21.9 (−24.6, −19.1)*** |
| Age, center, BMI, comorbidities | −9.63 (−12.5, −6.74)*** | −19.6 (-24.3, −15.0)*** | −25.8 (−28.6, −23.0)*** |
| Free estradiol | |||
| Unadjusted | −0.28 (−0.33, −0.22)*** | −0.09 (−0.18, −0.004)* | −0.31 (−0.36, −0.26)*** |
| Age, center, BMI, comorbidities | −0.28 (−0.33, −0.23)*** | −0.19 (−0.27, −0.10)*** | −0.39 (−0.44, −0.34)*** |
| SHBG | |||
| Unadjusted | 14.9 (22.7, 17.0)*** | −24.2 (−-27.8, −20.7)*** | −11.6 (−13.6, −9.6)*** |
| Age, center, BMI, comorbidities | 9.7 (7.7, 11.7)*** | −18.6 (−21.8, −15.4)*** | −10.7 (−12.6, −8.8)*** |
| LH | |||
| Unadjusted | 2.85 (2.36, 3.34)*** | −1.12 (−1.92, −0.32)** | 1.05 (0.58, 1.51)*** |
| Age, center, BMI, comorbidities | 1.92 (1.42, 2.41)*** | −0.52 (−1.31, 0.28) | 0.97 (0.49, 1.45)*** |
| TSH | |||
| Unadjusted | −0.03 (−0.19, 0.12) | 0.08 (−0.17, 0.34) | 0.14 (−0.0002, 0.29) |
| Age, center, BMI, comorbidities | 0.01 (−0.15, 0.18) | 0.07 (−0.19, 0.33) | 0.16 (0.01, 0.32)* |
| Free T4 | |||
| Unadjusted | 0.01 (−0.02, 0.04) | −0.01 (−0.06, 0.03) | −0.03 (−0.06, −0.003)* |
| Age, center, BMI, comorbidities | 0.02 (−0.01, 0.04) | −0.01 (−0.06, 0.04) | −0.02 (−0.05, 0.01) |
| IGF1 | |||
| Unadjusted | −18.0 (−23.4, −12.7)*** | 18.4 (9.6, 27.1)*** | −6.2 (−11.2, −1.2)* |
| Age, center, BMI, comorbidities | −6.7 (−12.3, −1.7)* | 13.3 (4.8, 21.8)** | −0.09 (−5.1, 5.0) |
Linear regression with adjustments for age, center, BMI, and comorbidities. Data are reported as β-coefficients (95% CI) with normal TT/normal cFT as the referent group. To meet linear regression assumptions, a total of 20 outliers with SHBG >150 nmol/liter, LH > 50 U/liter, and total estradiol >180 pmol/liter were excluded from the analysis.
P < .05;
P < .01;
P < .001.
CI, confidence interval; TSH, thyroid stimulating hormone; free T4, free thyroxin.
Compared to referent, SHBG levels were higher in men with normal TT/low cFT and lower in men with low TT/normal cFT and low TT/low cFT, even after adjusting for age, BMI, and comorbidities (Table 2). LH was higher in men with normal TT/low cFT and low TT/low cFT. In the unadjusted model, LH levels were lower in men with low TT/normal cFT, but after adjusting for age, BMI, and comorbidities, LH levels in this group did not differ from the referent group (Table 2).
In men with normal TT/low cFT and low TT/normal cFT, thyroid-stimulating hormone and free T4 concentrations did not differ from the referent group. Men with low TT/low cFT had a slightly lower free T4, but after adjustments, this was no longer significant. Concentrations of IGF-1 were lower in men with normal TT/low cFT and higher in men with low TT/normal cFT. Men with low TT/low cFT also had slightly lower IGF-1 levels, but this association became nonsignificant after adjusting for confounders (Table 2).
Sexual, physical, and psychological symptoms
Men with normal TT/low cFT had the lowest overall sexual function score and the highest proportion of men with infrequent sexual thoughts, erectile dysfunction, and infrequent morning erections (Table 1). Ordinal logistic regression with adjustments for age, BMI, and comorbidities confirmed that men with normal TT/low cFT and men with low TT/low cFT were more likely to report limitations in erectile function. Men with low TT/low cFT also have a lower frequency of sexual thoughts (Table 3). In contrast, overall, sexual symptoms were not different in men with low TT/normal cFT compared to the referent group (Table 3).
Association Between T Status and Sexual, Physical, and Psychological Symptom Scores
| Normal TT | Low TT | Low TT | |
|---|---|---|---|
| Low cFT | Normal cFT | Low cFT | |
| OR (95% CI) | OR (95% CI) | OR (95% CI) | |
| Sexual symptoms | |||
| Sexual thoughts frequency | |||
| Unadjusted | 0.42 (0.34, 0.54)*** | 1.34 (0.93, 1.93) | 0.57 (0.45, 0.71)*** |
| Age, center, BMI, comorbidities | 0.79 (0.61, 1.01) | 1.10 (0.75, 1.62) | 0.73 (0.58, 0.93)* |
| Sufficient erection | |||
| Unadjusted | 0.34 (0.27, 0.43)*** | 1.14 (0.79, 1.65) | 0.44 (0.35, 0.55)*** |
| Age, center, BMI, comorbidities | 0.73 (0.57, 0.94)*** | 0.87 (0.59, 1.28) | 0.69 (0.54, 0.87)** |
| Morning erection frequency | |||
| Unadjusted | 0.32 (0.25, 0.42)*** | 0.88 (0.60, 1.28) | 0.54 (0.43, 0.68)*** |
| Age, center, BMI, comorbidities | 0.56 (0.42, 0.74)*** | 0.67 (0.45, 1.00)* | 0.71 (0.56, 0.91)** |
| Physical symptoms | |||
| Vigorous activity | |||
| Unadjusted | 0.38 (0.30, 0.48)*** | 1.01 (0.69, 1.47) | 0.45 (0.36, 0.57)*** |
| Age, center, BMI, comorbidities | 0.71 (0.55, 0.92)** | 0.88 (0.59, 1.33) | 0.68 (0.53, 0.86)** |
| Ability to walk 1 km | |||
| Unadjusted | 0.39 (0.29, 0.54)*** | 1.68 (0.73, 3.89) | 0.42 (0.31, 0.56)*** |
| Age, center, BMI, comorbidities | 0.69 (0.48, 0.98)* | 1.62 (0.63, 4.17) | 0.74 (0.53, 1.05) |
| Ability to bend | |||
| Unadjusted | 0.43 (0.34, 0.55)*** | 1.23 (0.78, 1.94) | 0.41 (0.33, 0.51)*** |
| Age, center, BMI, comorbidities | 0.65 (0.50, 0.85)** | 1.33 (0.82, 2.18) | 0.68 (0.53, 0.87)** |
| Psychological symptoms | |||
| Sadness | |||
| Unadjusted | 0.77 (0.59, 1.00) | 1.06 (0.66, 1.69) | 0.82 (0.64, 1.06) |
| Age, center, BMI, comorbidities | 0.80 (0.59, 1.09) | 0.90 (0.52, 1.53) | 0.84 (0.62, 1.14) |
| Loss of energy | |||
| Unadjusted | 0.64 (0.50, 0.82)*** | 1.34 (0.90, 1.99) | 0.66 (0.52, 0.83)*** |
| Age, center, BMI, comorbidities | 1.01 (0.78, 1.32) | 1.33 (0.87, 2.02) | 0.94 (0.73,1.20) |
| Fatigue | |||
| Unadjusted | 0.62 (0.49, 0.79)*** | 1.22 (0.81, 1.84) | 0.58 (0.47, 0.73)*** |
| Age, center, BMI, comorbidities | 0.95 (0.73, 1.23) | 1.37 (0.89, 2.11) | 0.88 (0.69, 1.13) |
Ordinal logistic regression, with adjustments for age, center, BMI, and comorbidities. Data are reported as ORs (95% CI), with normal TT/normal cFT as the referent group. Questionnaire response categories: frequency of sexual thoughts and morning erection frequency: 1: none or once in the past month, 2: 2–3 times/month and 1 time/week, 3: 2–6 times/week, 4: ≥1/day; sufficient erection for sexual intercourse: 1: never, 2: sometimes, 3: usually, 4: always; physical symptoms: 1: limited, 2: limited a little, 3: not limited; psychological symptoms: 1: worse, 2: poor, 3: OK.
P < .05;
P < .01;
P < .001.
CI, confidence interval; OR, odds ratio.
Men with normal TT/low cFT had the lowest gait speed and the lowest physical function score (Table 1). Men with normal TT/low cFT and low TT/low cFT were more likely to report limitations in doing vigorous activities and in the ability to bend. The responses from men with low TT/normal cFT were not different compared to the normal TT/normal cFT group (Table 3).
In the fully adjusted models, psychological symptoms were not different between the different groups (Table 3).
Biochemical measurements, body composition, and bone measurements
In the unadjusted model, only men with normal TT/low cFT and men with low TT/low cFT had lower hemoglobin levels, but after adjusting for age, center, BMI, and comorbidities, all three comparator groups had significantly lower hemoglobin levels than the referent group of men with normal TT/normal cFT. After adjustments, high-sensitivity C-reactive protein (hs-CRP) levels were higher in men with low TT/normal cFT and low TT/low cFT. Although also men with normal TT/low cFT had higher hs-CRP levels in the unadjusted model, this association disappeared after adjusting. Glucose levels were increased and men were more insulin resistant in all three groups (Tables 1 and 4).
Associations Between T Status and Biochemical Parameters, Body Composition, and Bone Ultrasound Measurements
| Normal TT | Low TT | Low TT | |
|---|---|---|---|
| Low cFT | Normal cFT | Low cFT | |
| β-coefficient (95% CI) | β-coefficient (95% CI) | β-coefficient (95% CI) | |
| Biochemical parameters | |||
| Hemoglobin | |||
| Unadjusted | −3.73 (−5.10, −2.36)*** | −1.34 (−3.60, 0.91) | −3.87 (−5.14, −2.60)*** |
| Age, center, BMI, comorbidities | −2.17 (−3.53, −0.81)** | −2.67 (−4.84, −0.50)* | −3.47 (−4.74, −2.19)*** |
| Log hs-CRP | |||
| Unadjusted | 0.34 (0.20, 0.47)*** | 0.52 (0.28, 0.76)*** | 0.54 (0.42, 0.67)*** |
| Age, center, BMI, comorbidities | 0.11 (−0.02, 0.25) | 0.42 (0.19, 0.65)*** | 0.23 (0.10, 0.36)*** |
| Log glucose | |||
| Unadjusted | 0.07 (0.05, 0.09)*** | 0.08 (0.04, 0.12)*** | 0.10 (0.08, 0.12)*** |
| Age, center, BMI, comorbidities | 0.04 (0.01, 0.06)** | 0.05 (0.01, 0.08)* | 0.04 (0.02, 0.07)*** |
| Log HOMA-IR | |||
| Unadjusted | 0.28 (0.19, 0.37)*** | 0.51 (0.36, 0.65)*** | 0.60 (0.51, 0.68)*** |
| Age, center, BMI, comorbidities | 0.18 (0.10, 0.26)*** | 0.23 (0.10, 0.35)*** | 0.23 (0.15, 0.30)*** |
| Body composition | |||
| Waist circumference | |||
| Unadjusted | 2.74 (1.42, 4.06)*** | 8.22 (6.04, 10.40)*** | 9.36 (8.11, 10.61)*** |
| Age, center, comorbidities | 1.34 (−0.01, 2.69) | 8.14 (5.99, 10.28)*** | 7.92 (6.67, 9.17)*** |
| Weight | |||
| Unadjusted | −0.08 (−1.75, 1.58) | 9.98 (7.22, 12.74)*** | 8.63 (7.06, 10.20)*** |
| Age, center, comorbidities | 1.85 (0.18, 3.52)* | 8.36 (5.68, 11.03)*** | 8.65 (7.10, 10.21)*** |
| BMI | |||
| Unadjusted | 0.50 (0.03, 0.98)* | 2.73 (1.95, 3.51)*** | 3.14 (2.69, 3.59)*** |
| Age, center, comorbidities | 0.36 (−0.13, 0.84) | 2.74 (1.96, 3.51)*** | 2.83 (2.38, 3.29)*** |
| Estimated % body fat | |||
| Unadjusted | 0.65 (0.004, 1.29)* | 3.36 (2.30, 4.41)*** | 2.96 (2.36, 3.57)*** |
| Age, center, comorbidities | 0.58 (−0.06, 1.21) | 3.29 (2.28, 4.30)*** | 2.88 (2.30, 3.47)*** |
| Mid-upper arm circumference | |||
| Unadjusted | −0.33 (−0.73, 0.07) | 2.23 (1.57, 2.90)*** | 1.96 (1.58, 2.34)*** |
| Age, center, BMI, comorbidities | −0.27 (-0.49, −0.05)* | −0.23 (-0.58, 0.13) | −0.27 (-0.48, −0.06)* |
| Bone ultrasound | |||
| Speed of sound | |||
| Unadjusted | −10.11 (−14.14, −6.09)*** | −2.89 (−9.54, 3.77) | −8.29 (−12.07, −4.51)*** |
| Age, center, BMI, comorbidities | −5.81 (−9.85, −1.76)** | −5.69 (−12.16, 0.78) | −7.08 (−10.92, −3.24)*** |
| Broadband ultrasound attenuation | |||
| Unadjusted | −5.78 (−8.05, −3.51)*** | 0.35 (−3.40, 4.10) | −3.76 (−3.89, −1.63)** |
| Age, center, BMI, comorbidities | −4.17 (−6.42, −1.92)*** | −1.14 (−4.74, 2.46) | −3.76 (−5.90, −1.63)** |
| Quantitative ultrasound index | |||
| Unadjusted | −6.58 (−9.09, −4.07)*** | −1.09 (−5.24, 3.05) | −5.01 (−7.36, −2.65)*** |
| Age, center, BMI, comorbidities | −4.22 (−6.74, −1.71)** | −2.83 (−6.85, 1.19) | −4.55 (−6.94, −2.17)*** |
| Estimated heel bone mineral density | |||
| Unadjusted | −0.04 (−0.06, −0.03)*** | −0.01 (−0.03, 0.02) | −0.03 (−0.05, −0.02)*** |
| Age, center, BMI, comorbidities | −0.03 (−0.04, −0.01)** | −0.02 (−0.04, 0.01) | −0.03 (−0.04, −0.01)*** |
Linear regression analysis with adjustments for age, center, BMI, and comorbidities. Waist circumference, weight, BMI, and estimated percentage body fat were not adjusted for BMI. Data are reported as β-coefficients (95% CI) with normal TT/normal cFT as the referent group. To meet linear regression assumptions, hs-CRP, glucose, and HOMA-IR levels were natural log-transformed and a total of 36 outliers with body weight >160 kg, BMI >44 kg/m2, speed of sound >1700 (m/sec), broadband ultrasound attenuation >160 (dB/MHz), and estimated heel bone mineral density >1.25 (g/mcm2) were excluded.
P < .05;
P < .01;
P < .001.
CI, confidence interval; HOMA-IR: homeostasis model assessment of insulin resistance.
Linear regression analysis with adjustments for age, center, and comorbidities showed that men with normal TT/low cFT had a slightly higher body weight, but no differences in waist circumference, BMI, or estimated % body fat. On the other hand, men with low TT/normal cFT and low TT/low cFT had a much higher waist circumference, body weight, BMI, and estimated percentage of body fat. After adjusting for BMI, mid-upper arm circumference was lower in men with normal TT/low cFT and low TT/low cFT, but not different in men with low TT/normal cFT (Tables 1 and 4).
Bone ultrasound parameters were lower in men with normal TT/low cFT and low TT/low cFT, also after adjusting for age, center, BMI, and comorbidities. In men with low TT/normal cFT, bone ultrasound parameters did not differ from those of men with normal TT/normal cFT (Tables 1 and 4).
MetS, cardiovascular disease, and all-cause mortality
Although men with normal TT/low cFT were in worse general health, they did not have a higher risk of developing MetS or cardiovascular disease and their all-cause mortality risk was not increased after adjustments. Men with low TT/normal cFT and low TT/low cFT both showed a higher prevalence of MetS. Only the latter group had a higher mortality risk at follow-up (Table 5).
Association Among T Status and Metabolic Syndrome, Cardiovascular Disease, and All-Cause Mortality
| Normal TT | Low TT | Low TT | |
|---|---|---|---|
| Low cFT | Normal cFT | Low cFT | |
| OR (95% CI) | OR (95% CI) | OR (95% CI) | |
| Baseline | |||
| Having MetS | |||
| Unadjusted | 1.94 (1.48, 2.55)*** | 4.13 (2.70, 6.33)*** | 4.02 (3.13, 5.17)*** |
| Age, center, BMI, comorbidities | 1.32 (0.94, 1.86) | 2.55 (1.54, 4.22)*** | 1.60 (1.17, 2.18)** |
| Having cardiovascular disease | |||
| Unadjusted | 2.15 (1.67, 2.75)*** | 1.57 (1.04, 2.36)* | 2.44 (1.93, 3.08)*** |
| Age, center, BMI, comorbidities | 0.83 (0.60, 1.15) | 1.69 (0.94, 3.03) | 1.00 (0.73, 1.37) |
| Follow-up | |||
| Developing MetS | |||
| Unadjusted | 1.59 (0.94, 2.70) | 2.53 (1.11, 5.76)* | 2.39 (1.43, 4.00)** |
| Age, center, BMI, comorbidities | 1.34 (0.74, 2.42) | 1.45 (0.59, 3.53) | 1.65 (0.93, 2.93) |
| Developing cardiovascular disease | |||
| Unadjusted | 1.72 (1.09, 2.72)* | 1.56 (0.83, 2.95) | 1.80 (1.18, 2.74)** |
| Age, center, BMI, comorbidities | 1.06 (0.64, 1.73) | 1.41 (0.72, 2.76) | 1.17 (0.74, 1.85) |
| All-cause mortality | |||
| Unadjusted | 2.62 (1.93, 3.56)*** | 1.15 (0.75, 1.75) | 2.70 (2.02, 3.60)*** |
| Age, center, BMI, comorbidities | 1.24 (0.89, 1.73) | 1.21 (0.77, 1.91) | 1.63 (1.18, 2.24)** |
Logistic regression analysis with adjustments for age, center, BMI, presence of comorbidities. Data are reported as ORs (95% CI), with normal TT/normal cFT as the referent group. Cox regression for mortality with adjustments for age, center, BMI, and presence of comorbidities. Data are reported as hazard ratios (95% CI), with normal TT/normal cFT as the referent group.
P < .05;
P < .01;
P < .001.
CI, confidence interval; OR, odds ratio.
Discussion
An association between either low TT or low FT and symptoms of androgen deficiency has been described in several large epidemiologic studies in aging men (23, 27–29). However, to date, the association between TT or FT with a specific clinical variable has been reported for each T parameter separately. In contrast to previous studies, we have used a combined approach, which enables the investigation of both TT and FT levels concurrently in the same subject to evaluate their relative importance in the assessment of androgen status. Our results reveal important and consistent differences between men with normal TT/low cFT, low TT/normal cFT levels, and low TT/low cFT (summarized in Figure 1), illustrating the importance of FT measurements in assessing androgen status.
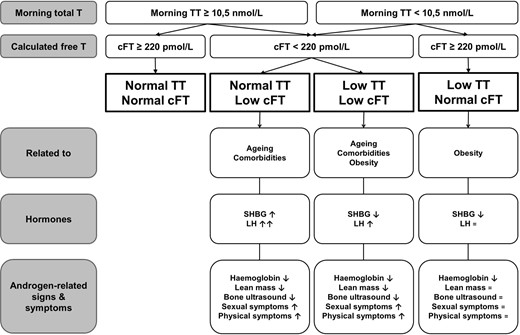
Summary of the differences between men with normal TT/low cFT, low TT/low cFT and low TT/normal cFT.
Men with normal TT/low cFT are older, showing multiple sexual and physical symptoms and signs compatible with androgen deficiency, with lower hemoglobin levels, lower lean mass, and lower bone density compared to the referent group with normal TT/normal cFT. Serum SHBG and LH levels are also higher. In men with low TT/normal cFT, on the other hand, clinical characteristics of androgen deficiency are lacking: sexual and physical symptoms, lean mass, and bone density are not different from men with normal TT/normal cFT. These men have the lowest SHBG levels, but LH levels do not differ from those of the referent eugonadal men. Men with low TT/low cFT have the most prominent sexual and physical symptoms and signs of androgen deficiency. They have lower hemoglobin and bone ultrasound parameters. SHBG is lower but LH is slightly higher than men with normal TT/normal cFT.
We confirm the association between low TT and obesity and MetS (30–33). Men with low TT/normal cFT are obese, with the lowest SHBG, but LH remains unchanged. As expected, these men also have higher hs-CRP levels and are more insulin resistant than the referent group. Both a proinflammatory state (as indicated by hs-CRP), as well as insulin resistance, have a negative effect on SHBG concentrations (34, 35), which in turn result in a concomitant decrease in TT in obese men. However, as long as FT remains within the reference range, evidence of androgen deficiency appears to be lacking.
We also confirm the association between low FT and aging. Previous studies have shown a clear association between low FT and older age, with a concurrent elevation in LH (3, 30, 36). In comparison, TT levels were only modestly lower with higher age because of the higher SHBG (3, 36).
There are remarkable differences in SHBG concentrations between the four groups. Apart from age and obesity, multiple other factors can have an impact on serum SHBG concentrations. Smoking status and alcohol intake are not different between the different groups; neither are there any clear differences in thyroid function. Interestingly, IGF-1 is lower in men with normal TT/low cFT and higher in men with low TT/normal cFT. Differences in SHBG concentrations across the groups could therefore, at least in part, be related to the well-established inverse relationship between IGF-1 concentrations and hepatic SHBG production (34, 37).
Our results also indicate that LH levels are higher in men with low cFT (both normal TT/low cFT and low TT/low cFT), but LH remained unchanged in men with low TT/normal cFT. Moreover, men with low cFT/normal TT and low cFT/low TT also have the lowest free estradiol levels. Our findings therefore suggest that free and not total sex steroid levels regulate LH secretion via negative feedback to the hypothalamus and the pituitary gland.
Notably, men with low TT/low cFT are both older as well as more obese, and signs and symptoms of androgen deficiency are more pronounced in this group. They also have the lowest mean TT level (7.8 nmol/L), which is in line with the threshold indicating severe hypogonadism in men (5, 23, 38). This is also the only group of men that has an increased mortality risk, independent of age, BMI, and comorbidities. Both low TT and low cFT have been associated with all-cause mortality (39–41). Also, previous analysis of the EMAS data revealed that severe hypogonadism (TT <8 nmol/L) was associated with all-cause mortality, whereas mild hypogonadism (TT, 8–11 nmol/L) was only related to mortality in men with coexisting sexual symptoms (42).
Our findings have important clinical implications. First, in older men with low-normal TT and high SHBG levels, resulting in low cFT levels, the presence of increased sexual and physical symptoms could be regarded as evidence of androgen deficiency. Thus, cFT levels are important in the confirmation of hypogonadism in elderly symptomatic men. Second, if a man is obese and has low TT, low SHBG, but normal cFT levels, it is plausible that symptoms may be nonspecific and unrelated to androgen deficiency despite the apparently low TT suggesting otherwise.
Based on the cutoffs of 10.5 nmol/liter for TT and 220 pmol/liter for cFT, the positive predictive value of TT to predict low cFT is 76.9%, whereas the negative predictive value of TT to predict low cFT is 90.5%. In other words, if we would only use TT to diagnose low T, the chance of a false negative finding is 9.5%, whereas the chance of a false positive finding is 23.1%. Therefore, assessing cFT in addition to TT, can offer improved precision when evaluating patients (especially older and/or obese) with possible “hypogonadal” symptoms in clinical practice (43). Our results thus provide evidential support to the often-expressed advice in clinical guidelines (4, 5) (until now without supporting data) that cFT may be more informative when assessing possible hypogonadism in men with borderline TT levels (eg, 8–12 nmol/L) or in the presence of altered SHBG concentrations (eg, aging and obesity most commonly) affecting TT results.
The main strengths of our study include the large sample of community-dwelling men, the standardized methods used to collect a broad range of personal and clinical data and the mass spectrometry-based methods to measure sex steroids. However, there are also some limitations to our study. Different methods for calculating FT have been published—our results are based on the Vermeulen method because this is the most commonly used formula to calculate FT in clinical practice. Because of the observational, cross-sectional design of the study, we do not address the question if men with low cFT can benefit from T substitution and we cannot discriminate between cause and effect. Although only a single measurement of TT was available, this is a stable analyte and single measurements of TT on a morning blood sample can provide representative and reliable data in large epidemiological studies such as EMAS (44). Finally, EMAS participants are a relatively healthy sample of European men. Extrapolating our findings to other populations should be done with some caution.
Conclusion
In the presence of normal TT levels, low cFT levels are associated with androgen-related signs and symptoms in middle-aged and elderly men. We suggest including FT measurements as part of the first-line assessment of hypogonadal symptoms in middle-aged/elderly and obese men.
For editorial see page 2640
Acknowledgments
We thank Joseph Finn for his invaluable contribution to the European Male Ageing Study and the men who participated and the research and nursing staff in the eight centers. We acknowledge the members of the European Male Ageing Study Group: Gianni Forti, Luisa Petrone, Giovanni Corona (Florence); Dirk Vanderschueren, Herman Borghs, Leen Antonio (Leuven); Krzysztof Kula, Jolanta Slowikowska-Hilczer, Renata Walczak-Jedrzejowska (Łódź); Ilpo Huhtaniemi (London); Aleksander Giwercman (Malmö); Frederick Wu, Alan Silman, Terence O'Neill, Joseph Finn, Philip Steer, Stephen Pye, Martin Rutter (Manchester); Felipe Casanueva, Ana B. Crujeiras (Santiago); Gyorgy Bartfai, Imre Földesi, Imre Fejes (Szeged); and Margus Punab, Paul Korrovitz (Tartu).
The European Male Ageing Study is funded by the Commission of the European Communities Fifth Framework Programme “Quality of Life and Management of Living Resources” Grant QLK6-CT-2001–00258 and by the Arthritis Research UK. This work was supported by grant #G085413N from the Research Foundation Flanders and by a research grant from the Academische Stichting Leuven.
Part of this research was presented at the European Congress of Endocrinology 2015, Dublin, Ireland, as abstract No. OC2.4.
Disclosure Summary: L.A., T.W.O.N., S.R.P., G.R., G.F., G.B., F.F.C., K.K., M.P., A.G., F.C., and B.D. have nothing to disclose. F.C.W.W. is a consultant for Besins Healthcare and Repros Inc. and has received research funding from Besins Healthcare and Bayer Schering. M.R.L. is a Fellow of the Research Foundation Flanders and consultant for Novartis and has received lecture fees from Flanders' Agricultural Marketing Board. I.T.H. is a consultant for Novartis, Takeda, and Ferring, and has received research funding from Ferring. B.G.K. is a consultant for Thermo Scientific.
Abbreviations
- BMI
body mass index
- BUA
broadband ultrasound attenuation
- CFT
calculated free T
- EMAS
European Male Ageing Study
- FT
free T
- hs-CRP
highly specific C-reactive protein
- MetS
metabolic syndrome
- MS/MS
tandem mass spectometry
- SOS
speed of sound
- TT
total T.
