


Abstract
The clinical significance of glucose complexity is not fully understood.
We investigated the relationship between glucose complexity, glucose variability (GV), and insulin resistance.
This was an observational study of 37 nondiabetic volunteers age 12–65 years and 49 adults with longstanding type 1 diabetes (T1D) who wore a blinded continuous glucose monitoring (CGM) device under real-life conditions. Sample entropy (SpEn) and detrended fluctuation analysis (DFA) were used to determine complexity either from the unaltered CGM or after removing fast glucose oscillations by using digital filters.
SpEn was inversely correlated with insulin resistance (ie, homeostasis model assessment of insulin resistance), the body mass index (BMI) z score (BMI-Z), GV, and DFA in nondiabetic subjects (NDs), and with BMI-Z, GV, and DFA in patients with T1D. T1D was characterized by a decomplexification of CGM profiles. In multivariate analysis, SpEn of NDs but not GV correlated inversely with markers of insulin resistance and SpEn correlated inversely with BMI-Z across both groups (r = −0.46; P < .0001). Low-pass filtering of the CGM data showed that inverse correlations of SpEn with insulin resistance and BMI-Z were dependent on the fast glucose oscillations.
Low complexity of CGM profiles is associated with insulin resistance in both NDs and patients with T1D. In NDs, low complexity could be an earlier marker of glucose regulation failure than GV. The relationship between glucose complexity and insulin sensitivity is determined by the richness of fast oscillations in the glucose profiles.
Many biological systems require a complex, interconnected network of feedback loops operating at different time scales to maintain homeostasis (1, 2). Their resulting output is then characterized by irregular or chaotic-like fluctuations that reveal complexity by the presence of long-range power law correlations (3, 4). In contrast, decomplexification may correspond with an early sign of disease as the consequence of a failure of regulatory feedbacks (1, 2). Accordingly, glucose dynamics display oscillations compatible with complex patterns, whereas decomplexification of glucose profiles has been associated with progression to diabetes (5–8).
Approximate entropy (ApEn), a family of measures of pattern irregularity (9, 10), and detrended fluctuation analysis (DFA), developed to quantify long-range correlations and scale invariance (3, 4, 11) have been widely used for the study of complexity of physiological time series. Regarding glucose profiles, reduced complexity measured by either ApEn or DFA has been independently associated with increased mortality (12–14) in critically ill patients whereas increased entropy showed higher mortality after cardiac surgery (15). However, the clinical significance of glucose complexity in healthy people is not fully understood and it has not been studied in patients with type 1 diabetes (T1D).
Thus, the purpose of this work was to correlate measurements of complexity (ApEn and DFA) derived from continuous glucose monitoring (CGM) with markers of insulin resistance (HOMA-IR, QUICKI, and BMI), clinical data, and glucose variability (GV) obtained for comparison from both nondiabetic subjects (NDs) and patients with T1D, as a model of deficient glucose regulation.
Materials and Methods
Blinded CGM recordings (iPro 2 with Enlite sensor, Medtronic MiniMed) from healthy, nondiabetic adults and teenagers (fasting glycemia < 126 mg/dL) were recorded prospectively. All subjects were trained to perform self monitoring of blood glucose and four tests per day (three preprandial and one at bedtime) were requested to calibrate the CGM system. None of the volunteers had a known history of diabetes, active disorders, or medication intake that could interfere with glucose metabolism or the CGM readings. However, high or low BMI were not exclusion criteria, allowing large differences in the subjects' insulin sensitivity status. Blinded CGM recordings (iPro 2 with Enlite sensor) were also reviewed retrospectively from 49 adults with longstanding T1D and on a multiple daily insulin injection regimen. Time in hypoglycemia was defined as the total duration of periods of glucose levels under 70 mg/dL [3.9 mmol/L] (unless otherwise indicated) lasting 10 or more consecutive minutes and was expressed as hours per day. A hypoglycemic episode was defined as any period of glucose levels below 70 mg/dL [3.9 mmol/l] (unless otherwise indicated) lasting at least 10 consecutive minutes. These episodes were reported per patient per day. The hospital's ethics committees approved the study. Written informed consent was obtained from each volunteer.
Glucose complexity
ApEn (m, r) is a unitless measure of the logarithmic likelihood that two sequences of m contiguous observations that are similar (within a tolerance r) remain similar (within the same tolerance r) on subsequent incremental comparisons (9). Thus, a lower value of ApEn reflects a higher degree of regularity (smoothness) whereas a higher value is associated with more irregular patterns and unpredictable outputs (roughness). Sample entropy (SpEn) is a variety of ApEn with improved accuracy and consistency, using a calculation algorithm slightly modified from the original method (10). SpEn has been calculated for pairs of glucose points (m = 2) with a tolerance of 20% of the SD (r = 0.2 × SD), which are the usual parameters used for hormone and glucose profile analysis (4, 9, 15). By using a tolerance relative to the SD, SpEn is then made independent of the mean and the SD of the studied sample. DFA scaling exponent is a unitless asymptotic value that estimates the degree of long-range correlations within a time series, analyzing how the profile and its linear regression diverge as the time window considered increases (13). DFA scaling exponents greater than 0.5 but less than or equal to 1.0 indicate increasing persistent long-range power-law correlations whereas values greater than 1.0 indicate that correlations still exist but progressively cease to be of a power-law form. See Peng et al (3) and Lundelin et al (13) for a detailed technical process of DFA computation and Seely et al (4) for a short review of the application of ApEn and DFA in the study of complex physiological outputs.
SpEn and DFA scaling exponents were determined on 72 hours of the CGM recordings (the full monitoring period was up to 6 d), starting at least 4 hours after setup to minimize potential noise due to either first calibrations or end-of-life sensors. Both algorithms were programmed in Microsoft Visual Basic for Excel (Version 2013, Microsoft Corporation) using the original methods of assessment (3, 10). Our SpEn values were identical to the results obtained by the MatLab script published on Physionet (www.physionet.org/physiotools/sampen/matlab/1.1/). DFA computations were done for box lengths starting at a minimum of 10 and ending with the length of the entire glucose series.
Classical GV indices
The mean, SD, coefficient of variation (CV), mean amplitude of glycemic excursion, and mean of daily difference were determined from the same 72 hours of CGM recordings using the original methods of assessment (16, 17).
Clinical and metabolic parameters
Body weight, height, fasting glucose, and glycated hemoglobin (HbA1C) were determined in all subjects. Diabetes duration and the total daily insulin dose at the time of the CGM recording were retrieved from patients with T1D. HbA1C was assessed by a Diabetes Control and Complications Trial standardized cation-exchange chromatographic assay (nondiabetic reference, 4–6%) and measured from venous blood samples. Fasting C-peptide and insulin concentrations were determined from NDs using an immunoassay on Modular Analytics E170 analyzer (Roche Diagnostics). Homeostasis model assessment (HOMA) of insulin resistance (HOMA-IR) and of β-cell function (HOMA-%B) were computed using the HOMA2 calculator version 2.2.3 (http://www.dtu.ox.ac.uk/homacalculator/) with fasting glucose and C-peptide as inputs (18). The quantitative insulin sensitivity check index (QUICKI) was computed using the formula 1 ÷ [log(fasting insulin) + log(fasting glucose)] (19).
CGM filtering
Several low-pass filters were applied to the CGM recordings, starting from a “light filtering” (all frequencies > 300 μHz or glucose wavelengths < 56 min were removed) to reach a “heavy filtering” (all frequencies > 75 μHz or glucose wavelengths < 220 min were removed). The digital low-frequency pass filter kernels were programmed in Microsoft Visual Basic for Excel and applied to the CGM data by convolution.
Statistical analysis
Normal distribution was assessed using the Kolmogorov-Smirnov test. Results were expressed as mean ± SD for parametric data and median (interquartile range) for nonparametric data. To allow weight comparisons across children and adults, we converted the BMI into its z score with the World Health Organization's AnthroPlus software (www.who.int/growthref/tools/en/). For adults age 19 years or older, the reference age of 19 years was used. Comparisons between groups were performed using two-tailed Welch's unequal variances t or Mann-Whitney U tests as appropriate. QUICKI, SpEn, and DFA scaling exponents were log transformed prior to correlation analysis. Correlations were expressed as the Pearson's coefficient, r. Correlations with hypoglycemic events and time in hypoglycemia were expressed as the Spearman's rho (ρ) coefficient. A stepwise model approach was used for multivariate analysis and only variables correlated in univariate at P < .20 were entered in the model. P-values <0.05 were considered statistically significant. Statistical calculations were performed with MedCalc Software (Version 15.8, https://www.medcalc.org).
Results
The clinical characteristics of the NDs (25 adults, age 19–65 y; and 10 teenagers, age 12–17 y) and patients with T1D (age 26–72 y) are summarized in Table 1. Unknown prediabetes (based on glucose ≥ 100 mg/dL but < 126 mg/dL or HbA1C ≥ 5.7% but < 6.5%) was diagnosed in three adult volunteers. Subsequently, the Normal Glucose Tolerance group refers to the NDs cohort from which the prediabetes cases have been excluded. As seen in Table 1, NDs showed a higher SpEn than patients with T1D (0.35 ± 0.08 vs 0.19 ± 0.05; P < .0001). SpEn was inversely correlated with each of the GV indices in both groups (Supplemental Tables 2 and 3) but in multivariate analysis, only CV of glucose remained significant when NDs and patients with T1D were combined, as shown in Figure 1A (r = −0.85; P < .0001). The DFA scaling exponent, close to 1.0 for the NDs increased in patients with T1D (1.09 ± 0.09 to 1.32 ± 0.09; P < .0001) and displayed an inverse correlation with SpEn (r = −0.83; P < .0001) as shown in Figure 1B.
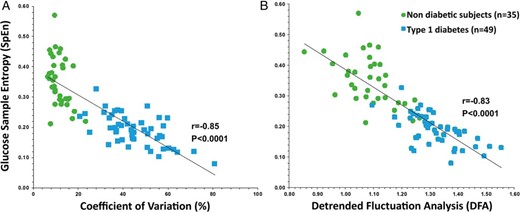
Inverse correlations between (A) SpEn and the CV, and (B) SpEn and DFA of glucose profiles in NDs (•, n = 35) and patients with T1D (■, n = 49).
Clinical Characteristics, Glucose Complexity, and GV of Nondiabetic Controls and Patients With Longstanding T1D
| Clinical Characteristics | Nondiabetics | T1D | P-Value |
|---|---|---|---|
| N | 35 | 49 | — |
| Sex, F/M, n | 21/14 | 30/19 | NS |
| Age | |||
| Adults, y | 37.0 ± 11.4 | 43.6 ± 12.7 | .032 |
| Teenagers, y | 14.5 ± 1.8 | — | — |
| BMI: adults only, kg/m2 | 23.7 ± 6.2 | 26.3 ± 5.2 | .061 |
| BMI-Z | 0.41 ± 1.25 | 1.12 ± 1.15 | .009 |
| Total daily insulin dose, U | — | 53.2 [33.6–79.4] | — |
| T1D duration, y | — | 19.9 ± 11.5 | — |
| Fasting glucose, mg/dL | 85.5 ± 7.5 | — | — |
| HbA1C, % | 5.3 ± 0.3 | 7.9 ± 1.6 | <.0001 |
| HOMA-IR | 1.33 ± 0.52 | — | — |
| QUICKI | 0.36 ± 0.04 | — | — |
| Mean CGM glucose, mg/dL | 93.1 ± 8.6 | 167.7 ± 40.0 | <.0001 |
| Hypoglycemia events, No./wka | 0.33 [0–1.00] | 1.14 [0.46–1.69] | .0005 |
| Time in hypoglycemia, h/db | 0.11 [0–0.69] | 1.36 [0.38–3.85] | <.0001 |
| Glucose complexity | |||
| SpEn | 0.35 ± 0.08 | 0.19 ± 0.05 | <.0001 |
| SpEn after heavy filteringc | 0.14 ± 0.04 | 0.13 ± 0.03 | NS |
| DFA | 1.09 ± 0.09 | 1.32 ± 0.09 | <.0001 |
| GV | |||
| SD, mg/dL | 11.1 ± 4.4 | 74.5 ± 20.9 | <.0001 |
| CV, % | 11.7 ± 3.9 | 45.4 ± 12.4 | <.0001 |
| MAGE, mg/dL | 27.6 ± 12.0 | 175.7 ± 48.8 | <.0001 |
| MODD, mg/dL | 11.6 ± 4.0 | 74.9 ± 25.6 | <.0001 |
Abbreviations: MAGE, mean amplitude of glycemic excursion; MODD, mean of daily difference; NS, not significant.
Defined as any period of glucose levels < 70 mg/dL [3.9 mmol/L] lasting ≥ 10 consecutive min.
Defined as the total duration of periods of glucose levels < 70 mg/dL [3.9 mmol/L] lasting ≥ 10 consecutive min.
See Methods for details.
Glucose entropy is inversely correlated with markers of insulin resistance
In NDs, SpEn was inversely correlated with HOMA-IR (r = −0.54; P = .0008), HOMA-%B (r = −0.42, P = .013) and BMI-Z (r = −0.39; P = .019) and positively correlated with QUICKI (r = 0.53; P = .0011), a marker of insulin sensitivity, as shown in Figure 2, A–D. On the contrary, neither HOMA-IR, QUICKI, nor BMI-Z were significantly correlated with any of the GV indices (Supplemental Table 2). In multivariate analysis, only BMI-Z (partial r = 0.55; P = .0007) and SpEn (partial r = −0.41; P < .016) remained correlated, respectively positively and inversely with HOMA-IR (multiple r = 0.72; P < .001). On another hand, only age (partial r = 0.59; P = .0003), SpEn (partial r = 0.55; P = .001), and mean of glucose (partial r = −0.48; P = .005) correlated positively or inversely with QUICKI (multiple r = 0.73; P < .001).
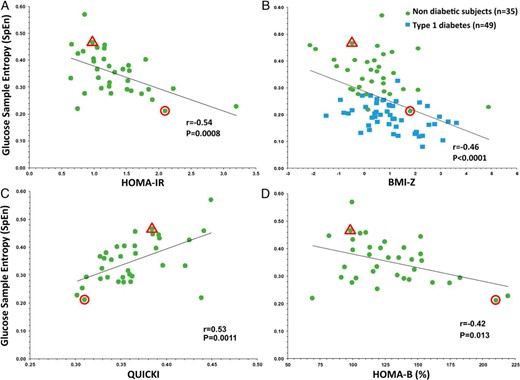
A, Inverse correlation between glucose SpEn and HOMA-IR in NDs (•, n = 35). B, Inverse correlation between SpEn and BMI-Z in NDs (•, n = 35) and in Patients with T1D (■, n = 49). C, Correlation of SpEn with QUICKI and (D) inverse correlation with HOMA-%B in NDs (•, n = 35). Highlighted points correspond to the NDs of Figure 3, A (Δ) and B (Ο).
In the T1D group, only SpEn (partial r = −0.35; P = .019) and the total daily insulin dose (partial r = 0.37; P = .012) correlated, respectively inversely and positively with BMI-Z in multivariate analysis (multiple r = 0.57; P = .0003). In this adult population, these results were unchanged by using the BMI instead of BMI-Z: only SpEn (partial r = −0.34; P = .026) and the total daily insulin dose correlated independently with the BMI in multivariate analysis (multiple r = 0.56; P = .0004).
Finally, SpEn was the only parameter independently associated with BMI-Z across both groups and the inverse correlation was the best when NDs and patients with T1D were taken together, as shown in Figure 2B (r = −0.46; P < .0001).
Glucose entropy and patterns of glucose variation
CGM profiles of similar GV may display very different SpEn values. As an example, Figure 3 shows typical CGM recordings of two Normal Glucose Tolerance subjects with similar GV, but characterized by high (SpEn, 0.47; Figure 3A) and low (SpEn, 0.21; Figure 3B) glucose entropy. These subjects also had respectively normal and high BMI and insulin resistance indices (Figure 2, A and B). A visual inspection shows that the high entropy profile (Figure 3A) is richer in rapid glucose oscillations of high amplitude.
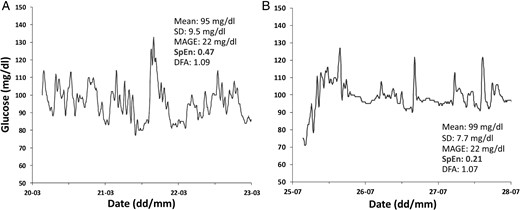
Typical CGM recordings of 72-h duration used to compute glucose complexity and variability from (A) a man age 26 years, BMI z score, −0.45 (BMI, 21.0 kg/m3); and HOMA-IR, 0.98; and (B) a boy age 15 years, BMI z score, 1.82 (BMI, 25.6 kg/m3); and HOMA-IR, 2.10.
Despite different BMI and HOMA-IR, mean of glucose values and usual indices of GV are similar. Only SpEn displays a clear-cut difference.
To determine relationships between SpEn, rapid glucose oscillations and insulin resistance, we applied different low-pass filters to each CGM recording. Supplemental Figure 4A shows a typical CGM profile before and after application of both extreme (light and heavy) filters. SpEn was significantly affected by filtering and gradually decreased in both groups (Supplemental Figure 4C). Concomitantly, inverse correlations of SpEn with HOMA-IR in the NDs (n = 35) and with BMI-Z in both groups (n = 84) became no more significant for the heaviest filtering (Supplemental Figure 4D and Supplemental Table 4).
Glucose entropy is inversely correlated with hypoglycemic episodes
In patients with T1D, SpEn was inversely correlated with time in hypoglycemia under either 70 mg/dL [3.9 mmol/L] (Spearman's ρ = −0.42; P = .003) or 50 mg/dL [2.8 mmol/;] (ρ = −0.38; P = .007) and hypoglycemic episodes below 50 mg/dL [2.8 mmol/L] (ρ = −0.38; P = .008). This was, however, not confirmed in multivariate analysis where CV remained the best correlated parameter with time in hypoglycemia and hypoglycemic events under either 70 mg/dL [3.9 mmol/L] or 50 mg/dL [2.8 mmol/L] in patients with T1D. The DFA scaling exponent was not correlated with hypoglycemic episodes.
Discussion
The complexity lying in normal glucose profiles (that is to say their meaningful structural richness) and the decomplexification associated with the progression to diabetes have been known for years (5–8) but has been not fully understood until now.
CGM recordings from healthy volunteers displayed a higher ApEn roughness (10). The DFA exponent close to 1.0 demonstrates the presence of long-range autocorrelations (fractal properties) that characterize complex outputs and is in accordance with previous studies (5, 7, 8).
Despite high variability, DT1 CGM profiles showed lower ApEn and a greater DFA exponent, two characteristics of decomplexification (1, 2, 6). This decomplexification was strongly and inversely correlated with GV, the less complex profiles displaying the greatest variability, and vice versa. At their own scale, healthy glycemia is thus far more “unstable” and unpredictable than the widely variable glucose profiles seen in patients with T1D.
This inverse correlation between entropy and GV of glucose profiles in T1D predicts that sensor-augmented insulin pumps with (predictive) low glucose suspend systems might be more efficient for Patients with T1D with the most variable glucose profiles because their lower entropy means smoother curves and thus easier predictability in the short term (20, 21).
In the intensive care setting, it has been hypothesized that loss of glucose complexity might be correlated with insulin resistance (22) and more recently, the DFA exponent derived from CGM has been associated with the number of metabolic syndrome–defining criteria in patients with essential hypertension (23). Here we showed in a group of nondiabetic volunteers characterized by low GV in comparison with another series of healthy subjects (24–26) that CGM-derived SpEn—but not the classical GV indices—was independently inversely correlated with HOMA-IR and the BMI. This finding supports the hypothesis that decreased glucose complexity is more sensitive, and could probably be an earlier sign of glucose regulation failure than the suggested increase of GV (27, 28).
By means of low-pass filtering, we then showed that fast glucose oscillations are associated with higher SpEn values and that the reduction of either the number or the amplitude of these fast glucose oscillations is also responsible for the correlation of low SpEn values with higher BMI and insulin resistance in our NDs. This is in accordance with older observations that normal people display fast ultradian glucose oscillations independent of meals and having a period of 80–180 minutes (29–31) and that these oscillations are reduced early in the evolution toward type 2 diabetes (29, 30). More recently, the presence of these fast glucose oscillations has been documented in CGM recordings of healthy subjects and of patients with T1D by the use of Fourier analysis (32, 33). Here we demonstrated that the simple SpEn algorithm is an easy way to quantify the richness of these fast glucose oscillations associated with healthy glucose regulation.
In long-standing T1D, rapid glucose changes are often associated with approximate dosing of insulin, bad evaluation of carbohydrate loads, or more generally, patient errors in the management of diabetes (34). In this context, the finding that the relationship of SpEn with BMI was preserved in our series of patients with T1D was quite unexpected. This suggests that at least one part of these SpEn-sensitive ultradian glucose oscillations depends on regulation mechanisms of glucose effectiveness that are independent of insulin (35, 36).
Our study has several weaknesses. By using HOMA and QUICKI to investigate glucose regulation, we were able to link glucose entropy to insulin sensitivity (18, 19) but HOMA-%B did not allow us to explore directly β-cell secretory function in response to hyperglycemia. Although increased GV has been associated with an early failure of the β-cell secretory function in either type 1 or type 2 diabetes (37–38), we were not able to determine the specific effect of the β-cell secretory function on SpEn in our ND volunteers. In particular, it has been shown that physiologic rapid insulin oscillations display also a complex, fractal-like behavior (39) and these oscillations are related to insulin sensitivity and insulin action (29–31). However, we did not analyze the pattern of insulin secretion and its relationship to glucose decomplexification in this study.
Nevertheless, the finding that the inverse correlation of SpEn with BMI was preserved in long-standing T1D confirms the significant contribution of insulin sensitivity.
Despite several attempts, we were unable to obtain detailed technical characteristics of the antinoise filter algorithms of the CGM system (iPro2) used in our study. However, Medtronic published patents for filters with thresholds from 416 to 833 μHz (corresponding with periods shorter than 40–80 min) (40). This is in accordance with our results showing a plateau for the inverse SpEn correlations with insulin resistance for filtering wavelengths below 80 minutes. It is thus probable that the CGM built-in low-pass filters blocked glucose periods faster than 80 minutes and this raises the possibility that meaningful faster oscillations were not included in our analysis.
Conclusions
We showed that glucose complexity measured by CGM-derived SpEn is inversely correlated with insulin resistance both in high entropy glucose profiles of healthy subjects and in low entropy glucose profiles of patients with T1D. In NDs, SpEn is more sensitive and could probably be an earlier sign of glucose regulation failure than GV. In healthy volunteers and patients with T1D, the relationship between SpEn and insulin sensitivity is dependent on the richness of SpEn-sensitive fast glucose oscillations in the CGM profiles.
Acknowledgments
We thank Professor Joel De Coninck, University of Mons, for his valuable discussion and Medtronic Belgium for providing the iPro 2 Enlite sensors. Some NDs were recruited with financial support from the Wetenschappelijk Fonds Willy Gepts of the UZ Brussel. B. Keymeulen is senior clinical investigator at the Fund for Scientific Research–Flanders. We thank Global Science Editing, United Kingdom for English language corrections.
Disclosure Summary: L.C. has received speaker fees from Medtronic, but Medtronic was not involved in this study. M.L., A.V.D., B.K., and B.C. have nothing to disclose.
Abbreviations
- ApEn
approximate entropy
- BMI
body mass index
- BMI-Z
body mass index z score
- CGM
continuous glucose monitoring
- CV
coefficient of variation
- DFA
detrended fluctuation analysis
- T1D
type 1 diabetes
- GV
glucose variability
- HbA1C
glycated hemoglobin
- HOMA-IR
homeostasis model assessment–insulin resistance
- HOMA-%B
HOMA-IR of β-cell function
- ND
nondiabetic subject
- QUICKI
quantitative insulin sensitivity check index
- SpEn
sample entropy
- T1D
type 1 diabetes.
