


Abstract
Measuring serum cortisol to evaluate stress, adrenal disease, and monitor hydrocortisone replacement requires venepuncture. Conversely, salivary measurements are noninvasive.
This study aimed to investigate measurement of salivary cortisol and cortisone as alternatives to serum cortisol.
This was a prospective cross-over study in a clinical research facility.
Over three periods (Period 1, 24-h physiological cortisol rhythm; Periods 2 and 3, after 20 mg oral and iv hydrocortisone) 14 male volunteers had serum and saliva cortisol and cortisone, serum albumin, cortisol-binding globulin, and free cortisol measured. Data were analyzed for rhythm parameters and correlations. Linear mixed-effects modelling was performed to determine the relationship between serum cortisol and salivary cortisone.
Serum cortisol and cortisone showed similar circadian rhythms with large peak:trough ratios (cortisol median ratio, 11). Albumin and cortisol-binding globulin showed minor peak:trough ratios <1.2. When serum cortisol was <74 (SD, 29) nmol/L, salivary cortisol was not detectable but salivary cortisone was always detected. Salivary cortisol post-oral hydrocortisone produced spurious results due to contamination. Under physiological conditions, salivary cortisone correlated strongly with serum cortisol (ρ, 0.91; 95% confidence interval, 0.89–0.93; P < .001). Similarly, following iv or oral hydrocortisone, salivary cortisone correlated strongly with serum cortisol (ρ, 0.91; 95% confidence interval, 0.89–0.92; P < .001). A mixed-effects model showed that in this population 94% of the variation in salivary cortisone could be predicted from serum cortisol.
Salivary cortisol is frequently undetectable and contaminated by oral hydrocortisone. In contrast, salivary cortisone reflects serum cortisol and provides a noninvasive alternative to measuring serum cortisol levels.
Cortisol measurement is important in the assessment of adrenal function and also used for assessing the adequacy of hydrocortisone replacement and as a marker of stress in studies of human behavior. Cortisol levels have a distinct circadian rhythm being low in the evening and at sleep onset, increasing from around 0300–0500 hours, peaking shortly after waking and then declining during the day with small peaks at meal times (1, 2). Therefore, the timing of cortisol samples is very important when assessing cortisol exposure; for example, a midnight cortisol is used to diagnose Cushing's syndrome (3), an early morning cortisol measurement to examine for adrenal insufficiency, and some clinicians use multiple cortisol samples when assessing hydrocortisone-replacement therapy (4). The measurement of serum cortisol is inconvenient and expensive, involving venepuncture and either a visit to the clinic or hospital admission. In contrast, the measurement of salivary cortisol is relatively noninvasive and convenient for the patient because it can be done at home and mailed to the laboratory (5). The measurement of salivary cortisol, however, has limitations as it is undetectable at low levels of serum cortisol (6); and oral hydrocortisone contaminates the mouth, resulting in spuriously high salivary cortisol levels (7).
It is important to consider the transport of cortisol in the circulation when measuring serum cortisol; 80% is bound to cortisol-binding globulin (CBG), 10% to albumin, and approximately 10% is free cortisol (unbound fraction), the latter providing biological activity (8). As cortisol concentration exceeds approximately 550 nmol/L CBG saturates so that the biologically active free cortisol increases. At these levels the clearance of total cortisol increases (9), and the disappearance rate is negatively correlated with CBG (10). CBG has a diurnal rhythm in rats (11), and the metabolic clearance rate of cortisol in humans is significantly higher at 0500–1100 hours compared with that at 2000–0200 hours (12). Salivary cortisol has been shown to reflect serum free cortisol (FF) (7).
The enzyme 11β-hydroxysteroid dehydrogenase type 2 (11β-HSD2) is expressed in the salivary glands and rapidly inactivates cortisol by conversion to cortisone (13). In serum, levels of cortisone are approximately 4-fold less than those of cortisol whereas in saliva levels of cortisone are approximately 6-fold higher than those of cortisol and presumed to be generated during the production of saliva from free serum cortisol (6). Thus, salivary cortisone predominantly reflects FF.
Cortisone is present at higher concentration than cortisol in saliva and has previously been shown to have a linear relationship with serum cortisol and therefore has the potential to provide a good marker of serum cortisol (14). We propose that the measurement of salivary cortisone can be used to estimate serum cortisol and FF. To test this we examined the relationship between serum cortisol, cortisone, free cortisol, and salivary cortisol and cortisone under physiological conditions and after the administration of hydrocortisone orally and intravenously.
Patients and Methods
A single-center, prospective, crossover study was carried out at Simbec Research Limited Clinical Centre. Fourteen healthy male volunteers with a median age of 28 (IQR, 25–36) years; weight, 83 (IQR, 75–90) kg; and body mass index (BMI), 25.3 (IQR, 23.1–26.3) kg/m2 participated in the study. Inclusion criteria included ages 18–60 years of age, a BMI of 21–28 kg/m2, and no clinically significant liver, renal, or cardiac disease. Exclusion criteria were the presence of gastrointestinal disorders that could influence drug absorption; renal, hepatic, central nervous system, respiratory, cardiovascular, or metabolic dysfunction; drug or alcoholic abuse; presence of infections; regular medications 14 days prior to study start; use of glucocorticoids; smokers; and rotating-work shifts. None of the subjects had diabetes or other significant comorbidities. The study was approved by the South East Wales Research Ethics Committee and all participants gave written informed consent. The study was divided into three study periods.
Study Period 1: Physiological circadian cortisol rhythm
Volunteers were admitted to the Clinical Centre and serum and saliva sampling was commenced at 1500 hours on Day 1 under stable conditions. Standard mixed meals were given on Day 1 at 1300 and 1900 hours and on Day 2 at 0800 and 1300 hours. Sleep disruption was minimized and subjects slept with lights out from 2300 until 0600 hours. Serum samples for circulating cortisol and cortisone, CBG, and albumin were collected every hour until Day 2 at 1500 hours whereas salivary samples for cortisol and cortisone were collected every hour between 1500 and 2200 hours and between 0700 and 1500 hours. Subjects were asked not to eat, drink, or wash their teeth 30 minutes prior to each sample collection. FF was measured at 2200, 0700, and 0900 hours.
Study Periods 2 and 3: Oral and iv hydrocortisone administration
During Study Period 2 each volunteer was administered 20 mg oral hydrocortisone and during Period 3, 20 mg iv at 0700 hours. Serum samples for cortisol, cortisone, CBG, and albumin and salivary samples for cortisol and cortisone were taken at −10, 15, 30, 45, 60, 75, 90, 120, 150 minutes, then 3, 4, 5, 6, 8, 10, and 12 hours. Free cortisol levels were measured at −10 minutes and at 2 hours post-drug administration. Volunteers received dexamethasone, 1 mg orally at approximately 2200 hours on Day 1 and at approximately 0600 hours and approximately 1200 hours on Day 2 during each study period to suppress the hypothalamo-pituitary-adrenal axis. All volunteers were given a standard mixed meal on Day 1 at 1900 hours and on Day 2 at 0800 and 1300 hours.
Assays
Liquid chromatography–tandem mass spectroscopy (LC-MS/MS) analysis for serum, free, and salivary cortisol/cortisone was performed using a Waters Xevo TQ-MS mass spectrometer and a Waters Acquity LC system with an electrospray source operated in positive-ionization mode (15). The lower limit of quantitation for serum cortisol was 12.5 nmol/L. The interassay imprecision was 8, 7, and 6% at concentrations of 80, 480, and 842 nmol/L, respectively. The cumulative intra-assay and interassay coefficients of variation (CVs) for the LC-MS/MS method for free cortisol were less than 8 and less than 9.5%, respectively. Salivary cortisol and cortisone were measured with a modified LC-MS/MS assay with lower limits of detection, 0.80 nmol/L (salivary cortisol) and 0.50 nmol/L (salivary cortisone). Intra-assay CVs were less than 9.3 and less than 7.9%; and interassay CVs were less than 9.7 and less than 10.3% at 1.8–52.2 nmol/L of salivary cortisol and 3.6–96 nmol/L of salivary cortisone, respectively (16). Free cortisol was measured using the same method as saliva but serum samples were filtered with a molecular weight centrifugal filter (cutoff, 30 000 Da) prior to analysis to remove binding proteins. Interassay CVs were less than 8% at 40–85 nmol/L of free cortisol.
Statistical analysis
All statistical analyses were performed using MatLab and Microsoft Excel 2010. Means or medians and 95% confidence intervals (CI), interquartile ranges, or ranges were calculated for continuous variables. The free-cortisol index (FCI) was calculated as serum total cortisol/CBG (nmol/mg). The peak-to-trough ratio was estimated by the maximal concentration/minimal concentration of the substrate over 24 hours. The FF was expressed as a percentage of total serum cortisol (SF): (FF/SF × 100%). The difference in FF/SF × 100% between separate time points was assessed using nonparametric Wilcoxon test for related samples. Linear mixed-effects models were used for both cosinor and regression analysis to account for intra- and intersubject variability. Model selection was by likelihood-ratio test between models and statistically significant but more complex models with only marginal improvement in Akaike Information Criterion or Bayesian Information Criterion were rejected in favor of simplicity. The selected mixed-effects models were all found to be superior to their fixed effects equivalents (P ≤ .001) although only marginally so for the cosinor models of albumin and CBG.
Results
Study Period 1
During physiological conditions (Study Period 1), serum cortisol, cortisone, and the calculated FCI; SF/CBG (nmol/mg)] all showed a similar circadian rhythm as defined by a cosinor model, with similar times for acrophase and nadir and similar peak-to-trough ratios (Table 1; Figure 1). The peak-to-trough ratios were large in amplitude for both serum cortisol and cortisone; median (range), 11.05 (6.57–66.77) and 6.16 (3.37–15.24), respectively. Serum CBG and albumin showed a statistically significant but very low-amplitude circadian rhythm, the acrophase at approximately 1600–1700 hours was out of phase with serum cortisol, and the peak-to-trough ratios for CBG and albumin were small at less than 1.2. Serum cortisol, FCI, and free cortisol showed similar changes over the day being high first thing in the morning and low at night. FF when expressed as a percentage of total serum cortisol (FF/SF × 100%) was lower in the evening when compared with morning (Supplemental Table 1).
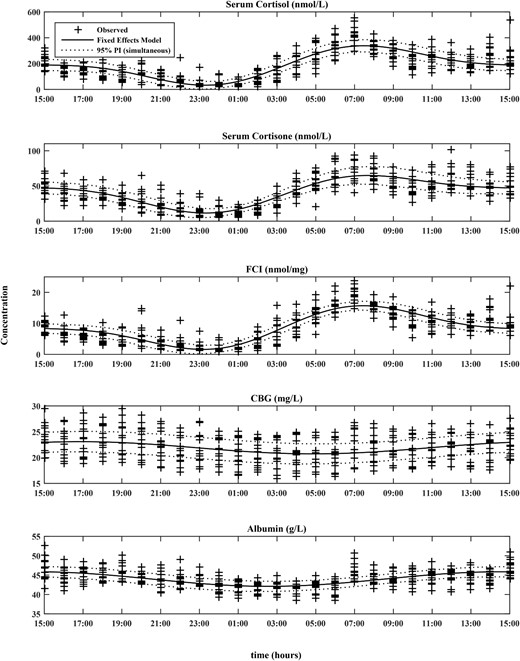
Cosinor models for SF, cortisone, FCI, CBG, and albumin along with their corresponding 95% prediction intervals overlaid on observed data (+) (N = 14).
The number of harmonics for the models was 2 for SF, cortisone, and FCI; and 1 for albumin and CBG.
Time and Concentration Taken From Best-Fit Individual Cosinor Models (Likelihood Ratio Test, P ≤ .001) in 14 Healthy Male Volunteers
| Variable | Clock Time Median (Range) | Concentration Median (Range) | Peak: Trough Ratio Median (Range) | ||
|---|---|---|---|---|---|
| Acrophase | Nadir | Peak | Trough | ||
| Cortisol, nmol/La | 07:24 (06:48–08:08) | 23:23 (22:43–00:03) | 323.9 (289.0–443.9) | 30.7 (5.0–67.6) | 11.05 (6.57–66.77) |
| Cortisone, nmol/La | 07:31 (06:48–08:51) | 23:05 (22:36–00:24) | 64.8 (44.4–86.1) | 10.2 (3.7–22.7) | 6.16 (3.37–15.24) |
| FCI, nmol/mga | 07:24 (06:41–08:08) | 23:08 (22:29–23:55) | 15.5 (14.9–18.4) | 1.16 (0.38–3.36) | 12.86 (5.46–40.67) |
| CBG, mg/Lb | 16:52 (16:12–17:32) | 04:49 (04:16–05:28) | 23.2 (19.4–27.2) | 20.8 (17.1–24.7) | 1.12 (1.10–1.14) |
| Albumin, g/Lb | 14:27 (13:40–14:52) | 02:38 (01:44–03:18) | 46.1 (42.7–48.5) | 42.3 (38.9–44.7) | 1.09 (1.09–1.10) |
Two-harmonic model is best fit (P ≤ .001).
One-harmonic model is best fit (P ≤ .001).
There was considerable individual variability in the serum cortisol:cortisone ratio; however, there was a circadian rhythm (P < 01): the median (range) mesor, 4.3 (3.0–5.8); peak:trough ratio, 1.4 (1.3–1.5); peak, 5.0 (3.7–6.6); trough, 3.6 (2.4–5.0); acrophase, 08:08 h (07:17–08:51 h); and nadir, 20:04 h (19:13–20:47 h) (Supplemental Figure 1A). Individual cross-correlation analysis of serum cortisol with serum cortisone for relative shifts from −24 to 24 hours showed a clear maximum at zero (P < .001) for all subjects (Supplemental Figure 1B). This suggests that although the changes in cortisone concentrations might lag cortisol, any such lag is undetectable at the 1-hour resolution of the data.
Ninety-five-percent CI for correlations (ρ) of salivary cortisone and salivary cortisol with serum cortisol rhythm varied between 0.89 and 0.93 and from 0.86 to 0.92; P < .001, respectively. When serum cortisol was less than 74 (SD, 29) nmol/L, salivary cortisol was not detectable (19% of total values). After excluding these undetectable values, salivary cortisol and cortisone both showed very strong correlations with serum cortisol, cortisone, FCI, and free cortisol (Table 2). The strongest correlation was between salivary cortisone and serum cortisol. The median (range) ratio between salivary cortisone and salivary cortisol was 6.4 (2.4–14.6).
Correlation Matrix Period 1 With Significant Correlation Coefficient ρ (P ≤ .001) (n = 14)
| P (95% CI) | Serum F | Serum E | FCI | Free Fa | Salivary Fb | Salivary E |
|---|---|---|---|---|---|---|
| Serum F | 1 | 0.83 (0.79–0.86) | 0.97 (0.96–0.98) | 0.91 (0.83–0.96) | 0.90 (0.87–0.92) | 0.91 (0.89–0.93) |
| Serum E | 1 | 0.81 (0.78–0.85) | 0.72 (0.50–0.86) | 0.52 (0.40–0.61) | 0.77 (0.71–0.81) | |
| FCI | 1 | 0.90 (0.80–0.95) | 0.90 (0.87–0.92) | 0.96 (0.95–0.97) | ||
| Free Fa | 1 | 0.89 (0.76–0.95) | 0.85 (0.72–0.93) | |||
| Salivary Fb | 1 | 0.87 (0.83–0.90) | ||||
| Salivary E | 1 |
Abbreviations: F, cortisol; E, cortisone.
Undetectable values excluded (6% values).
Undetectable values excluded (19% values).
Study Periods 2 and 3, following oral and iv administration of hydrocortisone
After oral hydrocortisone administration salivary cortisol levels showed no correlation with serum cortisol (Table 3). This was related to some salivary cortisol values showing spuriously high levels presumed to be contamination from the oral hydrocortisone, which was not seen after iv. By contrast, salivary cortisone maintained a strong correlation with serum cortisol, and FCI and the correlation coefficient for salivary cortisone with serum cortisol was the same as that seen under physiological conditions (ρ = 0.91; P < .001) (Table 4).
Correlation Matrix Period 2 After Oral HC With ρ (P ≤ .001) (n = 14)
| ρ (95% CI) | Serum F | Serum E | FCI | Salivary Fa | Salivary E |
|---|---|---|---|---|---|
| Serum F | 1.0 | 0.51 (0.40–0.60) | 0.97 (0.96–0.97) | 0.30 (0.16–0.43) | 0.84 (0.79–0.87) |
| Serum E | 1.0 | 0.53 (0.43–0.62) | NS | 0.61 (0.52–0.68) | |
| FCI | 1.0 | 0.30 (0.16–0.43) | 0.88 (0.84–0.90) | ||
| Salivary Fa | 1.0 | NS | |||
| Salivary E | 1.0 |
Abbreviation: HC, hydrocortisone; NS, “not significant” P > .001.
Undetectable values excluded (19%).
Correlation Matrix Period 3 After iv HC With ρ (P ≤ .001) (n = 14)
| ρ (95% CI) | Serum F | Serum E | FCI | Salivary Fa | Salivary E |
|---|---|---|---|---|---|
| Serum F | 1.0 | 0.68 (0.6–0.75) | 0.97 (0.97–0.98) | 0.89 (0.85–0.91) | 0.94 (0.92–0.95) |
| Serum E | 1.0 | 0.68 (0.60–0.74) | 0.33 (0.20–0.46) | 0.66 (0.58–0.73) | |
| FCI | 1.0 | 0.87 (0.84–0.91) | 0.96 (0.95–0.97) | ||
| Salivary Fa | 1.0 | 0.87 (0.83–0.90) | |||
| Salivary E | 1.0 |
Abbreviations: F, cortisol; E, cortisone; HC, hydrocortisone.
Undetectable values excluded (19%).
Pooling data from Study Periods 1, 2, and 3
There was a strong linear relationship between salivary cortisone and serum cortisol (Figure 2A). Logarithmic transformation reduced heteroscedasticity in the variance and was used in a linear mixed effects model grouped by subject (Figure 2B). The best-fit model required only random intercepts for each subject (likelihood ratio test, P ≤ .001) and explained 94% of the variability in the data. The explanation for the intersubject variability was further explored by examining age, BMI, body surface area (BSA), height, and weight; however, none of these variables could contribute significantly to the model. The final, best-fit model is given by log10 serum F = 1.24 + 0.89 × log10 salivary E + bj, where bj represents the modification of the intercept for subject j, j = 1,2, …, 14 and values ranged from −0.13 to 0.14.
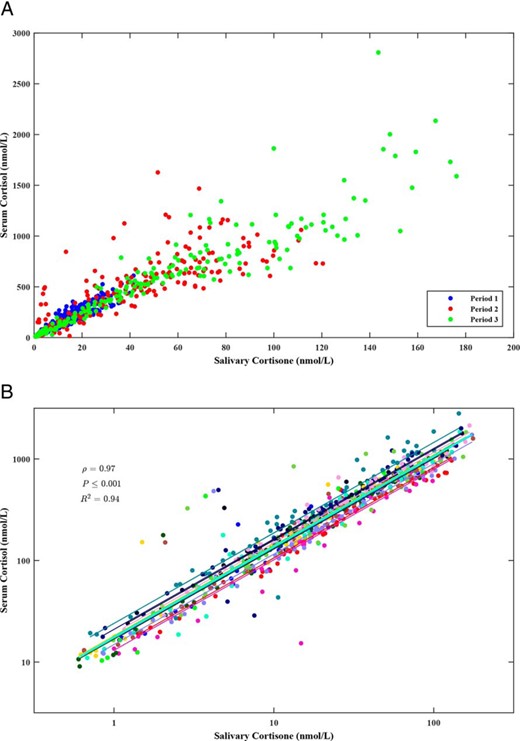
A, Scatter graph showing relation of SF to salivary cortisone by study period. B, Mixed-effects model showing per-subject variation. The lines are the individual-subject regression lines and all have the same slope with minor variation in intercept. The fixed effects line is shown in cyan.
Normative salivary cortisol and cortisone levels
To calculate the 24-hour rhythm of salivary cortisol and salivary cortisone we used the fixed-effects components of the fitted regression models to “back transform” the 2-cosinor model for serum cortisol. The full, mixed-effects regressions were also used to provide estimates of the missing night-time salivary cortisone levels (2300 to 0600 h) (Figure 3).
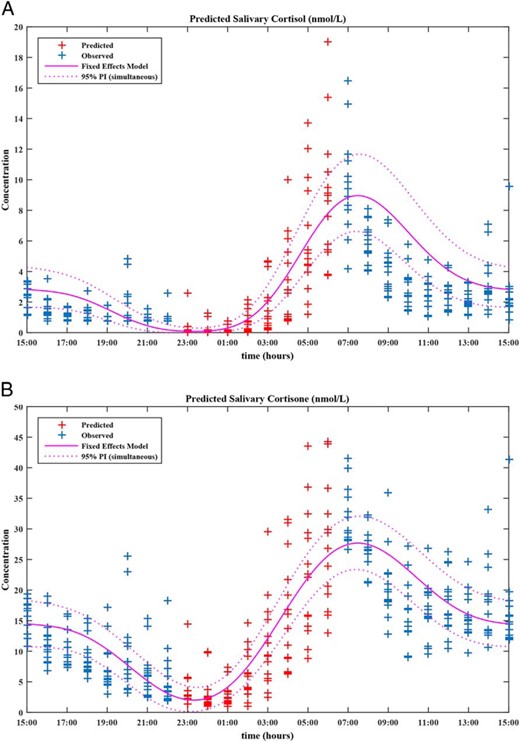
Concentration-time profiles for salivary cortisol (A) and salivary cortisone (B) including 2-cosinor fixed-effects models and their corresponding 95% prediction intervals.
These were obtained via “back transformation” using the fixed-effects components of their respective regression models. Salivary cortisone values between 2300 and 0600 h were predicted by inverting the mixed-effects model and applying it to the night-time serum cortisol observations. By cosinor analysis the median (range) was estimated as (A) salivary cortisol acrophase, 07:24 (06:48–08:08); nadir, 23:23 (22:43–00:03); peak, 8.3 (6.6–15.5) nmol/L; trough, 0.1 (0.0–0.4) nmol/L; and peak:trough ratio, 122.8 (43.3–4505.0); and (B) salivary cortisone acrophase, 07:24 (06:48–08:08); nadir, 23:23 (22:43–00:03); peak, 27.1 (18.0–45.1) nmol/L; trough, 1.8 (0.3–5.0) nmol/L; and peak:trough ratio, 14.8 (8.3–111.6).
Discussion
Salivary cortisol and salivary cortisone show a very strong correlation with serum cortisol, and salivary cortisone provides a better marker of serum cortisol given that it is detectable at low levels of serum cortisol and not contaminated by oral hydrocortisone. We found that CBG and albumin showed a circadian rhythm that was out of phase with the circadian rhythm of cortisol. However, the peak-to-trough ratio for both CBG and albumin was less than 1.2 and therefore the circadian changes in serum cortisol and FF within an individual over 24 hours is predominantly due to either secretion of cortisol or absorption of hydrocortisone with changes in CBG and albumin having a minimal effect. Salivary cortisone has previously been shown to have a linear relationship with serum cortisol (6, 14). We have now extended this observation by modeling the relationship in fine detail over 24 hours, confirming it exists under both physiological cortisol secretion and after the administration of hydrocortisone, and by defining the key parameters of salivary cortisone levels over 24 hours.
Cortisol is inactivated through oxidation to cortisone by 11β-HSD2 in organs such as kidney, salivary glands, and the colon and cortisone is either excreted in urine or reshuttled back into the circulation, to be reduced back to cortisol by 11β-HSD1 in the tissues (17, 18). By activating cortisone to cortisol, the type-1 enzyme amplifies the effect of cortisol in tissues, including liver and adipose tissue (19). Our results showed that serum cortisone correlated strongly with serum cortisol. Cross-correlation analysis showed correlation between serum cortisol and simultaneously measured cortisone suggesting that both under physiological conditions and after administration of hydrocortisone there is rapid conversion of serum cortisol to serum cortisone, at least within the sampling period of the study. This conversion of cortisol to cortisone predominantly reflects the function of 11β-HSD2 in the kidneys as it protects the mineralocorticoid receptor from excess active cortisol by converting it to inactive cortisone (20). From our results, serum cortisol levels exceed those of cortisone with a ratio of 4.3 cortisol:cortisone. In contrast, in saliva cortisone levels exceed those of cortisol with a ratio of 6.4 cortisone:cortisol. There was considerable individual variability in the serum cortisol:cortisone ratio; however, there was a low-amplitude circadian rhythm with a mesor of 4.3. Previous publications have demonstrated that salivary cortisone closely reflects FF (6, 14). We have now shown that both salivary cortisol and cortisone have a much stronger correlation with serum cortisol than with serum cortisone, consistent with salivary cortisone being derived from FF through conversion by 11β-HSD2 in the salivary gland. We have established that repetitive sampling of salivary cortisone is a suitable alternative to measuring serum cortisol both under physiological conditions and after the administration of hydrocortisone.
We further examined the relationship between salivary cortisone and serum cortisol using a mixed-effects model. Log transforming the data provided a minor improvement in the model and reduced the heteroscedasticity in the residuals. In this population approximately 94% of the variability in salivary cortisone could be explained by the change in serum cortisol. We examined demographic characteristics (age, weight, height, BMI, BSA) to see if they explained the minor intersubject variability but they were found not to do so. We would therefore propose a fixed-effects model could be used to back calculate serum cortisol from salivary cortisone but this needs to be tested in prospective studies in different populations. By inverting the mixed-effects model to estimate night-time salivary cortisone levels, we developed a full 24-hour salivary cortisone rhythm model (Figure 3), and this could be used in clinical practice.
The use of salivary methods to measure cortisol is becoming increasingly common both in research and in the clinical management of patients as an alternative, or an adjunct, to the more frequently used serum or urinary cortisol measurements. The introduction of LC-MS/MS has further increased the sensitivity and specificity of the assays and allows the simultaneous measurement of both salivary cortisol and cortisone (6). Immunoassays are complicated by cross reactivity with other steroids including cortisone, which affects specificity and test accuracy (21). The use of LC-MS/MS as in this study is important for the individual measurement of steroids, including cortisol and cortisone. The methods used are becoming simpler, faster, and have a quick turnaround, achieving speeds similar to immunoassays. They are therefore used extensively in hospital laboratories (22), are an ideal tool for researchers, and the measurement of salivary cortisol has been recommended in major guidelines (3). However, despite the improved sensitivity of LC-MS/MS we were still unable to measure salivary cortisol when the serum cortisol was low.
Disturbances in cortisol rhythm are associated with ill health. A flattened diurnal cortisol slope is associated with cardiovascular mortality (23), type 2 diabetes (24), and obesity (25). Therefore, measuring the cortisol rhythm by stress free, noninvasive salivary cortisone sampling could potentially be an additional means of assessing patient health risk on an everyday basis; although this still needs to be established in future studies. Furthermore, no consensus exists on how to titrate hydrocortisone doses in patients on glucocorticoid replacement (26). The use of two salivary cortisol samples, measured 1 hour and 30 minutes after cortisone acetate, as an indication of 24-hour cortisol exposure has been suggested but this does not give an indication of fluctuating changes (27). The use of multiple salivary cortisone samples allows an objective assessment of cortisol exposure after hydrocortisone and has been used during hydrocortisone infusion (28). Moreover, measuring salivary cortisone after hydrocortisone does not have the same risk for drug contamination as observed when measuring salivary cortisol in this setting (29). As a wide variability in hydrocortisone pharmacokinetics and glucocorticoid sensitivity exists between individuals multiple salivary cortisone sampling can be used in assessing hydrocortisone replacement. Interestingly, early-morning salivary cortisone has been proposed to be a superior test to salivary cortisol in detecting severe adrenal insufficiency in patients on glucocorticoids (30).
Our study is limited by the relatively small number of subjects and its cross-sectional nature but the analysis was carried out in detail under carefully controlled environmental conditions with strict supervised sampling of multiple samples and we have undertaken a detailed analysis. Furthermore, the study is only carried out in men. It has been shown that in women on estrogens besides an increase in the bound cortisol pool, free-cortisol pharmacokinetics may be affected, resulting in excess cortisol exposure, especially in patients on hydrocortisone in whom the hypothalamo-pituitary-adrenal axis might not adjust (7). Salivary cortisone reflects free cortisol concentrations irrespective of elevations in CBG (14) but detailed modeling of the mathematical relationship with total circulating cortisol levels in this setting has not been performed. Salivary cortisone has been shown to be a more useful tool to assess the cortisol circadian rhythm under both physiological conditions and after oral hydrocortisone replacement. We have shown how normative salivary cortisone levels can be calculated and displayed. Future studies should assess salivary cortisone measurement prospectively in clinical and research settings to evaluate salivary cortisone use as a diagnostic tool.
For related article see page 1350
Acknowledgments
This study was registered in EudraCT (https://eudract.ema.europa.eu/index.html) as trial number 2013-000260-28.
This work was supported by the European Commission Framework 7 Grant, TAIN No. 281654.
Disclosure Summary: R.J.R. and M.J.W. are directors of Diurnal, Ltd; R.J.R. and M.J.W. hold stock; and D.E. is a consultant to Diurnal Ltd; M.D., R.F.H., W.A., and B.G.K. have nothing to disclose.
M.D. and R.F.H. contributed equally to the study.
Abbreviations
- 11β-HSD
11β-hydroxysteroid dehydrogenase
- BMI
body mass index
- CBG
cortisol binding globulin
- CI
confidence interval
- CV
coefficient of variation
- FCI
free-cortisol index
- FF
serum free cortisol
- LC-MS/MS
liquid chromatography–tandem mass spectroscopy
- SF
total serum cortisol.
