


Abstract
Fetuin-A is an important hepatokine associated with many cardiometabolic abnormities. The association between fetuin-A and albuminuria has not been investigated in a prospective cohort.
The objective of the study was to prospectively investigate whether serum fetuin-A levels were associated with albuminuria in middle-aged and elderly Chinese.
A community-based study was conducted at baseline in 2009, including 3102 individuals aged 40 years or older and followed up for 4 years.
Baseline and follow-up urine samples were collected to measure urinary albumin and creatinine concentrations. Albuminuria was defined as urinary albumin to creatinine ratio (UACR) of 30 mg/g or greater.
A total of 194 participants (8.5%) developed albuminuria during the follow-up. Men who developed albuminuria had significantly higher baseline levels of fetuin-A compared with those who did not (338.2 vs 292.9 mg/L, P = .02). Among men, after adjustment for traditional risk factors, each 1-SD increase of fetuin-A level (131.6 mg/L) was associated with a 32% higher risk for developing albuminuria (odds ratio 1.32, 95% confidence interval 1.07–1.62). In addition, among men, compared with participants in the lowest tertile (<253.1 mg/L) of serum fetuin-A levels, those in the highest tertile (>338.2 mg/L) had a 2-fold risk for developing albuminuria (odds ratio 2.07, 95% confidence interval 1.04–4.12) after multivariate adjustment. No association between fetuin-A levels and incident albuminuria was observed in women.
High serum fetuin-A levels were independently associated with an increased risk of developing albuminuria in middle-aged and elderly men, whereas no significant associations were found in women.
Serum fetuin-A (also called α-2 heremansschmid glycoprotein) is a multifunctional glycoprotein predominantly secreted by the liver and mainly involved in promoting insulin resistance (1). Accumulating experimental and epidemiological studies reported that it was associated with a spectrum of cardiometabolic disorders, such as metabolic syndrome (2), nonalcoholic fatty liver disease (3), type 2 diabetes (4–6), and cardiovascular diseases (CVD) (7, 8). It has been currently recognized as one of the most significant hepatokines regulating human metabolism (9).
Albuminuria, usually indicated by increased urinary albumin to creatinine ratio (UACR), is not only an early marker of kidney damage but also regarded as an early predictor and risk factor for CVD (10, 11). Early detection and intervention of individuals at high risk is of great importance to prevent renal impairment and subsequent CVD. Previous studies have reported a positive association between serum fetuin-A levels and albuminuria in patients with metabolic syndrome or type 2 diabetes (12, 13). Our previous study found that high serum fetuin-A was independently associated with albuminuria in normal glucose tolerance population (14). However, to date, the longitudinal association between serum fetuin-A and risk of albuminuria has not been well evaluated.
In the present study, we aimed to prospectively investigate whether high serum fetuin-A levels at baseline independently associated with the increased risk of developing albuminuria in a middle-aged and elderly Chinese population.
Materials and Methods
Study population
We enrolled study participants from the Songnan community, Baoshan district, Shanghai, China, in two phases as reported previously (15). In phase 1 (June and July 2008), all registered permanent residents aged 40 years or older were invited to receive a screening examination, and 10 185 participated. Participants were classified into one of three groups according to fasting plasma glucose (FPG) levels and medical history of diabetes: normal glucose regulation (NGR; FPG < 5.6 mmol/L and no history of diabetes), impaired glucose regulation (IGR; 5.6 ≤ FPG < 7.0 mmol/L and no history of diabetes), and diabetes (FPG ≥ 7.0 mmol/L or history of diabetes). In phase 2 (from June to August 2009), we selected participants at random from each group according to a ratio of 1.0 (diabetes) to 1.2 (IGR) to 1.44 (NGR), resulting in a total of 4012 participants (1302 with diabetes, 996 IGR, and 1714 NGR) who completed a comprehensive survey that included a detailed questionnaire, anthropometric measurement, a standard 75-g oral glucose tolerance test (OGTT), and blood and urine collection.
For the present analysis, those with UACR of 30 mg/g or greater (having albuminuria) at baseline (n = 431), estimated glomerular filtration rate (eGFR) of 60 mL/min per 1.73 m2 or less (n = 117), or missing data for fetuin-A measurements at baseline (n = 362) were excluded, leaving 3102 eligible participants. In 2013, all the eligible participants were invited to have a follow-up examination. Twenty-seven participants died during the follow-up, and 2277 individuals participated in the examination and gave their urine samples (Figure 1).
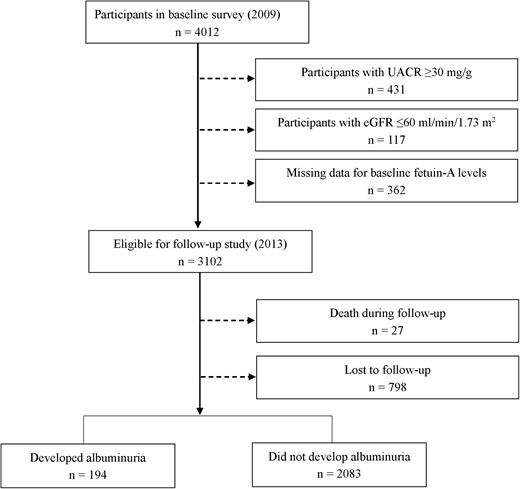
Flow chart of study population.
The study protocol was approved by the Institutional Review Board of Rui-Jin Hospital, Shanghai Jiao Tong University School of Medicine. All participants provided written informed consent.
Data collection
Detailed information regarding age, sex, smoking status, alcohol consumption, medical history and medication use was obtained through a standard questionnaire administered by trained physicians. Body weight and height were measured with participants wearing lightweight clothes and no shoes. Body mass index (BMI) was calculated as weight in kilometers divided by height in meters squared. Waist circumference (WC) was measured at the level of umbilicus. Blood pressure was measured on nondominant arm three times consecutively with 1-minute intervals after at least a 10-minute rest using an automated electronic device (OMRON Model HEM-752; Omron Co). The average of three measurements was used in the analysis. Hypertension was defined as systolic blood pressure (SBP) of 140 mm Hg or greater or diastolic blood pressure of 90 mm Hg or greater or the use of antihypertensive medications and a physician-diagnosed hypertension.
Fasting venous blood samples were collected at both baseline and follow-up visits. All participants underwent a 75-g OGTT in the morning after a minimum 10-hour overnight fast. Fasting and 2-hour OGTT plasma glucose concentrations were measured by using the glucose oxidase method on an autoanalyzer (ADVIA-1650 chemistry system; Bayer). Serum concentrations of triglycerides (TG), total cholesterol (TC), high-density lipoprotein cholesterol, low-density lipoprotein cholesterol, high-sensitivity C-reactive protein (hsCRP), alanine aminotransferase (ALT), aspartate aminotransferase (AST), and γ-glutamyltransferase (GGT) were measured by an autoanalyzer (ADVIA-1650 chemistry system; Bayer). Serum insulin was measured by electrochemiluminescence assay (Roche Diagnostics). The homeostasis model assessment of insulin resistance (HOMA-IR) index was calculated as fasting insulin (international units per milliliter) × fasting glucose (millimoles per liter)/22.5 (16). The abbreviated Modification of Diet in Renal Disease formula recalibrated for Chinese (17) was used to determine the eGFR, expressed in milliliter per minute per 1.73 m2: eGFR = 186 × (serum creatinine × 0.011)−1.154 × (age)−0.203 × (0.742 if female) × 1.233.
Measurement of serum fetuin-A
Serum fetuin-A concentrations were measured in baseline blood sample using a human fetuin-A ELISA kit (R&D Systems). The inter- and intraassay coefficients of variation were 5.2% and 7.8%, respectively (14, 18).
Assessment of albuminuria
Urinary albumin and creatinine concentrations were determined using the first void sterile urine sample in the early morning by rate nephelometry (Beckman Coulter) and alkaline nitroxanthic acid method, respectively (14). UACR was calculated by dividing the urinary albumin concentrations by the urinary creatinine concentrations and expressed in milligrams per gram. Albuminuria was defined as UACR of 30 mg/g or greater, with microalbuminuria defined as UACR of 30–299 mg/g, and macroalbuminuria defined as UACR of 300 mg/g or greater. Participants without albuminuria at baseline examination but had albuminuria at follow-up visit was categorized as incident albuminuria.
Statistical analysis
Given the low incidence of macroalbuminuria (16 cases), we combined macroalbuminuria and microalbuminuria cases as the albuminuria group. Baseline characteristics were compared between the nonalbuminuria and albuminuria groups at follow-up using Student's t test for continuous variables and the χ2 test for category variables, in men and women respectively. The serum fetuin-A level was not in normal distribution, so fetuin-A was log10 transformed when used as a continuous variable before statistical analysis. Participants were then categorized into three groups according to tertiles of serum fetuin-A concentrations: less than 253.1 mg/L, 253.1–338.2 mg/L, and greater than 338.2 mg/L. Liner trend across fetuin-A tertiles was tested using the linear regression analysis for continuous variables and the Cochran-Armitage test for categorical variables.
We used a multivariate stepwise logistic regression model to identify risk factors that independently associated with the development of albuminuria. A stepwise regression model was constructed with the following potential predictor variables: age, current smoking status, BMI, WC, SBP, TG, TC, diabetes status, HOMA-IR, hsCRP, fetuin-A, and antihypertensive medication usage. Inclusion of the preceding potential predictors in the final model required a value of P < .05.
The unadjusted and multivariate adjusted logistic regression models were used to evaluate the association of fetuin-A levels with incident albuminuria. We investigated the risk of incident albuminuria in the second and third fetuin-A tertiles, with the first fetuin-A tertile as the reference as well as the risk of incident albuminuria by each 1-SD increment of fetuin-A level, in men and women separately. Variables included in the multivariate logistic regression model were selected based on stepwise regression analysis and established traditional cardiovascular risk factors as a priori (9, 19–22). Three models were used. Model 1 was unadjusted. Model 2 was adjusted for age, current smoking status, SBP, BMI, and WC. Model 3 was further adjusted for TC, log10 TG, diabetes status, log10 HOMA-IR, log10 hsCRP levels, antihypertensive medications usage, log10 ALT, log10 AST, and log10 GGT. Results were presented as odds ratios (OR) and the corresponding 95% confidence intervals (CI).
Significance tests were two tailed, with a value of P < .05 considered as statistically significant for all analyses. Statistical analysis was performed using SAS version 9.3 (SAS Institute Inc).
Results
Baseline characteristics of study population
The mean age of the 2277 participants was 59.6 ± 9.3 years; 61% (n = 1389) were females. During the 4-year follow-up, 194 participants developed albuminuria (including 178 microalbuminuria and 16 macroalbuminuria cases).
The baseline characteristics of participants by the albuminuria status at 4-year follow-up are shown in Table 1. Participants who developed albuminuria were older; had higher levels of blood pressure, FPG, 2-hour postload glucose, HOMA-IR, and hsCRP; and included a larger proportion of individuals with hypertension and diabetes and use of antidiabetic or antihypertensive agents (all P ≤ .03). Notably, men who developed albuminuria during the follow-up had significantly higher fetuin-A levels than those who did not (P = .02). However, the fetuin-A levels did not vary by incident albuminuria status in women.
Baseline Characteristics of Participants According to Status of Incident Albuminuria at 4-Year Follow-Up
| Men (n = 888) | Women (n = 1389) | |||||
|---|---|---|---|---|---|---|
| Nonalbuminuria | Albuminuria | P Value | Nonalbuminuria | Albuminuria | P Value | |
| n, % | 825 (92.9) | 63 (7.1) | 1258 (90.6) | 131 (9.4) | ||
| Age, y | 60.7 ± 9.2 | 63.5 ± 9.4 | .02 | 58.5 ± 9.1 | 62.3 ± 9.9 | <.0001 |
| BMI, kg/m2 | 24.8 ± 3.1 | 25.3 ± 3.6 | .17 | 24.7 ± 3.4 | 25.8 ± 3.9 | .0006 |
| WC, cm | 88.9 ± 8.1 | 90.7 ± 7.9 | .08 | 85.0 ± 9.6 | 88.8 ± 9.5 | <.0001 |
| SBP, mm Hg | 137 ± 19 | 148 ± 21 | <.0001 | 134 ± 20 | 146 ± 24 | <.0001 |
| Diastolic blood pressure, mm Hg | 80 ± 10 | 83 ± 9 | .03 | 77 ± 10 | 80 ± 10 | .001 |
| Current smoker, n, % | 390 (47.3) | 29 (46.0) | .85 | 25 (2.0) | 3 (2.3) | .82 |
| Current drinker, n, % | 309 (37.5) | 26 (41.3) | .55 | 72 (5.7) | 8 (6.1) | .86 |
| FPG, mmol/L | 5.11 (4.70–5.80) | 6.00 (5.20–8.40) | <.0001 | 5.10 (4.70–5.70) | 5.60 (5.00–7.00) | <.0001 |
| 2-Hour PPG, mmol/L | 7.70 (6.10–11.60) | 12.40 (8.30–18.90) | <.0001 | 7.20 (5.90–9.80) | 9.00 (6.80–16.50) | <.0001 |
| HOMA-IR | 1.53 (0.93–2.42) | 2.13 (1.29–2.96) | .005 | 1.70 (1.10–2.61) | 2.45 (1.47–4.50) | <.0001 |
| TG, mmol/L | 1.41 (0.95–2.09) | 1.39 (0.98–2.49) | .93 | 1.44 (0.98–2.06) | 1.64 (1.10–2.43) | .002 |
| TC, mmol/L | 4.91 ± 0.89 | 4.91 ± 0.85 | .95 | 5.33 ± 0.96 | 5.33 ± 1.13 | .99 |
| HDL-c, mmol/L | 1.25 ± 0.26 | 1.31 ± 0.28 | .05 | 1.43 ± 0.30 | 1.35 ± 0.30 | .002 |
| LDL-c, mmol/L | 2.35 ± 0.63 | 2.24 ± 0.72 | .18 | 2.42 ± 0.71 | 2.44 ± 0.74 | .71 |
| hsCRP, mg/L | 0.20 (0.06–0.64) | 0.39 (0.10–1.53) | .002 | 0.16 (0.05–0.63) | 0.32 (0.14–1.18) | <.0001 |
| eGFR, mL/min per 1.73 m2 | 112.4 (98.3–126.9) | 112.3 (94.8–138.5) | .86 | 112.1 (98.0–128.7) | 108.9 (96.9–130.0) | .89 |
| Diabetes, n, % | 240 (29.1) | 37 (58.7) | <.0001 | 271 (21.6) | 62 (47.3) | <.0001 |
| Hypertension, n, % | 451 (55.0) | 51 (82.3) | <.0001 | 621 (49.4) | 91 (70.0) | <.0001 |
| Antidiabetic therapy, n, % | 118 (14.3) | 23 (36.5) | <.0001 | 141 (11.2) | 41 (31.3) | <.0001 |
| Antihypertensive therapy, n, % | 179 (21.7) | 19 (30.2) | .12 | 255 (20.3) | 44 (33.6) | .0004 |
| Fetuin-A, mg/L | 292.9 (234.1–371.2) | 338.2 (254.6–404.9) | .02 | 285.9 (235.6–358.7) | 289.0 (227.4–389.9) | .94 |
Abbreviations: 2-Hour PPG, 2-hour postload plasma glucose; HDL-c, high-density lipoprotein cholesterol; LDL-c, low-density lipoprotein cholesterol. Data are means ± SD, medians (interquartile ranges) for skewed variables or proportions for categorical variables. Differences were assessed using Student's t test (for continuous variables) or χb (for categorical variables) tests.
The distribution of participants' characteristics by fetuin-A tertiles was presented in Supplemental Table 1. In general, both men and women participants with higher fetuin-A levels had worse metabolic profiles, including higher levels of FPG, 2-hour postload glucose, HOMA-IR, TG, and a higher proportion of diabetes (all P ≤ .04).
The risk factors of incident albuminuria
Stepwise logistic regression analysis showed that SBP, diabetes status, hsCRP, and fetuin-A were independent risk factors of developing albuminuria in men; SBP, diabetes status, and HOMA-IR were independent risk factors in women (Supplemental Table 2).
Each 1-SD increase of baseline log10 UACR was significantly associated with 120% higher risk of developing albuminuria after a full adjustment of baseline age, current smoking status, SBP, BMI, WC, TC, log10 TG, diabetes status, log10 HOMA-IR, log10 hsCRP, antihypertensive medication usage, log10 ALT, log10 AST, and log10 GGT levels (OR 2.20, 95% CI 1.59–3.04).
Serum fetuin-A levels and risk of albuminuria
Table 2 shows the association of fetuin-A with incident albuminuria in logistic regression analyses. Among men, compared with participants in the lowest tertile of serum fetuin-A, those in the third tertile had a 2-fold risk of developing albuminuria (OR 2.07, 95% CI 1.04–4.12) after adjustment for age, current smoking status, SBP, BMI, WC, TC, log10 TG, diabetes status, log10 HOMA-IR, log10 hsCRP, antihypertensive medication usage, log10 ALT, log10 AST, and log10 GGT levels (model 3). Each 1-SD increase of fetuin-A level was associated with a 32% higher risk for developing albuminuria (OR 1.32, 95% CI 1.07–1.62) among men after multivariate adjustment in model 3. However, the association between fetuin-A levels and incident albuminuria was not observed in women.
Association Between Serum Fetuin-A Levels (Milligrams per Liter) and Risk of Albuminuria
| Incident Cases/Participants | Model 1 | Model 2 | Model 3 | |
|---|---|---|---|---|
| Men (n = 888) | ||||
| Tertile 1 | 14/287 | 1.00 | 1.00 | 1.00 |
| Tertile 2 | 17/287 | 1.23 (0.59–2.54) | 1.13 (0.53–2.38) | 1.10 (0.51–2.36) |
| Tertile 3 | 32/314 | 2.21 (1.16–4.24) | 2.29 (1.18–4.42) | 2.07 (1.04–4.12) |
| P for trend 1 | .01 | .009 | .03 | |
| 1-SD increase (131.6) | 1.33 (1.09–1.63) | 1.34 (1.09–1.65) | 1.32 (1.07–1.62) | |
| P for trend 2 | .005 | .005 | .009 | |
| Women (n = 1389) | ||||
| Tertile 1 | 51/472 | 1.00 | 1.00 | 1.00 |
| Tertile 2 | 27/470 | 0.50 (0.31–0.82) | 0.49 (0.30–0.80) | 0.46 (0.28–0.76) |
| Tertile 3 | 53/446 | 1.11 (0.74–1.67) | 1.02 (0.67–1.56) | 0.91 (0.59–1.41) |
| P for trend 1 | .62 | .87 | .77 | |
| 1-SD increase (115.3) | 1.03 (0.86–1.23) | 0.99 (0.82–1.19) | 0.95 (0.79–1.16) | |
| P for trend 2 | .75 | .91 | .63 | |
Data are ORs (95% CI). P for trend 1 was tested for liner trend of fetuin-A tertiles, and P for trend 2 was tested for liner trend of each 1-SD increase of fetuin-A. Model 1 was unadjusted; model 2 was adjusted for age, current smoking status, SBP, BMI, and WC; and model 3 was model 2 further adjusted for TC, log10 TG, diabetes status, log10 HOMA-IR, log10 hsCRP, antihypertensive therapy, log10 ALT, log10 AST, and log10 GGT.
In addition, the c-statistic was improved from 0.60 to 0.63 after adding fetuin-A into basic model that included age, BMI, and current smoking status. The risk prediction improvement was comparable with adding lipid levels and hsCRP simultaneously in the model (c-statistic 0.63). When assessed by integrated discrimination improvement, fetuin-A (0.015, SE 0.011) was secondary to diabetes status (0.024, SE 0.006) in risk prediction improvement (Supplemental Table 3).
Discussion
In this prospective study, we found that higher baseline serum fetuin-A levels were associated with increased risk of developing albuminuria in men, independent of diabetes status, blood pressure, atherogenic lipid profile, hsCRP, insulin resistance, use of antihypertensive medications and liver enzymes. However, the association was not observed in women.
To our knowledge, this is the first prospective investigation on the association of serum fetuin-A levels with incident albuminuria. Consistent with our results, a case-control study conducted in patients with metabolic syndrome demonstrated a positive correlation between serum fetuin-A level and microalbuminuria (r = 0.26, P = .02) (12). In a cross-sectional analysis, serum fetuin-A levels were lower in diabetic patients with microalbuminuria than those with macroalbuminuria (13). However, these two studies were conducted among patients with metabolic abnormalities, so the relationship between serum fetuin-A and albuminuria might be confounded. Moreover, previous studies did not assess the longitudinal relationship between serum fetuin-A levels and albuminuria. In the current analysis, we extended previous studies in a general population, adjusted for a wide range of variables and provided new evidence to the independent association between serum fetuin-A and albuminuria in a prospective setting. In addition, we also assessed risk prediction improvement. Although additional information of fetuin-A did not significantly improve the c-statistic, the degree of model improvement was comparable with adding lipid levels and hsCRP simultaneously in the model. The lack of significance might be attributable to relative small sample size. Of note, a significant association does not necessarily lead to a significant improvement in risk prediction (23). The major point of our current study is that we found fetuin-A was independently associated with risk of incident albuminuria beyond traditional predictors such as diabetes and hypertension. Using a prospective cohort study design that has minimized the bias of reverse correlation, we could make a suggestive causal inference on the association between fetuin-A and the risk of albuminuria. The association was still significant after adjustment of a wide range of traditional cardiovascular risk factors, indicating the independent association between fetuin-A and incident albuminuria.
Using a cross-sectional analysis, we have previously showed that high serum fetuin-A was independently associated with albuminuria in the normal glucose tolerance population (14). Although in that study the significant association was detected in women instead of men, the seemingly discrepant result is acceptable due to different population and study design. The cross-sectional study was conducted in participants with NGR, whose characteristics were not the same as those of general population included in the current analysis. In our previous study, men with increased urinary albumin excretion had more metabolic risk factors than women did, whereas in the present study, more metabolic risk factors were associated with incident albuminuria in women (see Table 1), which might confound the association between fetuin-A and albuminuria to null.
We observed sex difference in the current analysis. Baseline serum fetuin-A was significantly related to incident albuminuria in men after multivariate adjustment, but the positive association was not found in women. The exact mechanism for the observed sex difference is unclear. We proposed two possible explanations. First, men are more prone to abdominal fat disposition and generally have higher volumes of visceral fat (24). Previous studies also showed that men had higher liver fat content than women in Hispanics, Caucasians, and African-Americans (25). However, limited data are available in Chinese. Visceral fat and liver fat are strongly associated with cardiometabolic risk factors and albuminuria (26, 27). Sex difference also exists in CVDs, with men being more affected than women. There are some pieces of evidence suggesting that body fat distribution might explain the sex difference in CVDs (28, 29). Thus, different body fat distribution may partly account for the observed sex difference in our study. Additionally, fetuin-A may influence unmeasured biological markers, which may produce different effects on albuminuria in men and women.
The biological mechanism for the positive association of fetuin-A with albuminuria remains unknown. There are several possible explanations. Fetuin-A has been identified to be a prerequisite for free fatty acids and Toll-like receptor 4 to induce inflammatory signaling and insulin resistance (30, 31), which could lead to endothelial cell damage and subsequent albuminuria. In addition, recent studies demonstrated that fetuin-A was the link between liver and kidney cross talk through its inhibition on adiponectin and 5-AMP activated protein kinase, which promote podocyte foot process effacement and albuminuria (32). Thus, fetuin-A lies in upstream pathways of cell signaling cascades, and our current finding might provide new therapeutic targets for cardiometabolic disorders.
To our knowledge, our study is the first to prospectively investigate the association of serum fetuin-A level with the development of albuminuria in a general population independent of a wide range of established risk factors for albuminuria. However, several limitations in our study should be acknowledged. First, although we controlled for a wide range of potential confounders, it cannot be excluded that the observed association might be mediated by unmeasured biomarkers. Second, albuminuria was assessed on a single morning urine sample using UACR, instead of the 24-hour collection. However, UACR is a reliable measure of albuminuria and is in good agreement with urinary albumin excretion by 24-hour collection (33). In addition, the US National Kidney Foundation recommended using UACR on a spot urine specimen to measure albuminuria (34). Third, we used HOMA-IR rather than the gold standard hyperinsulinemic-euglycemic clam method to estimate insulin resistance. HOMA-IR remains a suboptimal method for measuring insulin resistance, especially for those with hyperglycemia or diabetes (35, 36). Fourth, the independent association between fetuin-A and incident albuminuria was only found in men, limiting the usefulness of fetuin-A as a predictor for albuminuria in women. Fifth, most participants were middle-aged and elderly Chinese adults, so the results may not be generalized to younger individuals or other ethnicities. Future studies are needed to confirm our finding in a different population and to include more potential confounders to provide better understanding of the mechanism underlying the observed association.
In conclusion, our study found that higher serum fetuin-A levels were independently associated with increased risk of developing albuminuria in middle-aged and elderly men, drawing attention to the role of hepatokines in the pathogenesis of albuminuria and cardiovascular disease, and may support the exploration of this pathway in therapeutic agent development in renal and cardiovascular diseases.
Acknowledgments
We are grateful to the research participants for their participation in this study. We are also grateful for the research team who contributed to the data collection and laboratory measurement.
The funding agencies had no role in the design and conduct of the study; in the collection, management, analysis, and interpretation of the data; or in the preparation, review, or approval of the manuscript or the decision to submit for publication.
This study was supported by the Grant 2013BAI09B13 from the National Clinical Research Center for Metabolic Diseases; Grant 2015CB553600 from the 973 Program of China; Grants 81471059, 81471062, 81321001, 81390350, 81222008, 81270877, and 81130016 from the National Natural Science Foundation of China; and Grant 2013ZYJB1002 from the Joint Research Program for Important Diseases of the Shanghai Municipal Commission of Health and Family Planning.
Disclosure Summary: The authors have nothing to disclose.
X.L. and W.S. contributed equally to this work.
Abbreviations
- ALT
alanine aminotransferase
- AST
aspartate aminotransferase
- BMI
body mass index
- CI
confidence interval
- CVD
cardiovascular disease
- eGFR
estimated glomerular filtration rate
- FPG
fasting plasma glucose
- GGT
γ-glutamyltransferase
- HOMA-IR
homeostasis model assessment of insulin resistance
- hsCRP
high-sensitivity C-reactive protein
- IGR
impaired glucose regulation
- NGR
normal glucose regulation
- OGTT
oral glucose tolerance test
- OR
odds ratio
- SBP
systolic blood pressure
- TC
total cholesterol
- TG
triglycerides
- UACR
urinary albumin to creatinine ratio
- WC
waist circumference.
