


Abstract
Heredity is an important risk factor for osteoporotic fracture, but it remains unclear whether genetic factors improve the predictability of future fracture occurrence.
To compare an integration model of genetic profiling with the current model for predicting future fracture occurrence.
A retrospective observational cohort study.
Postmenopausal women aged 45–93 years who were untreated (n = 117), hormone-treated (n = 491), or bisphosphonate (BP)-treated (n = 415), with a mean 6.1-year follow-up.
The main outcome was incident fractures. Ninety-five single nucleotide polymorphisms were genotyped. We calculated the Korean-specific genetic risk score 35 (GRS35) from 35 single nucleotide polymorphisms associated with osteoporosis-related traits at the baseline visit.
Osteoporotic fracture occurred more frequently in the highest GRS35 tertile group than in the lower two tertile groups after adjustments for confounders (hazard ratio [HR], 1.73; 95% confidence interval [CI], 1.17–2.55). The associations of the GRS35 with incident fracture were only significant in the BP group (HR, 2.25; 95% CI, 1.28–3.95) and not in the untreated (HR, 1.26; 95% CI, 0.34–4.66) and hormone-treated (HR, 1.21; 95% CI, 0.62–2.36) groups. Integration of the GRS35 into the current model further improved its predictability for incident fracture occurrence by 6.3% (P = .010).
Genetic profiling can more accurately predict future fracture risk, especially in individuals taking BPs.
Osteoporosis treatment aims to prevent osteoporotic fracture (OF). Thus, identifying individuals at high fracture risk is paramount when considering pharmacological treatment (1–3). For estimating risk, fracture risk assessment models combining bone mineral density (BMD) and clinical risk factors (CRFs) have been proposed (4, 5). Conceptually, OF risk is dependent on fall risk, bone mass, and quality (6). BMD measures bone mass, and CRFs can reflect fall risk and bone quality (6, 7). However, these models have inadequate predictive ability, with the area under the receiver operating characteristic curve (range, 0.60–0.63) (4, 8) resulting in overtreatment by 36% or undertreatment by 46% (8). Thus, their predictive abilities should be further improved.
One of the most important CRFs is family fracture history, indicating a crucial influence of genetic factors on fracture susceptibility (9). Most OF risk components, such as BMD, bone quality (loss, ultrasound properties, turnover markers, and geometry of bone), and nonskeletal factors (cognition and neuromuscular functions), have heritability (9). The OF heritability is approximately 25–35% (10, 11) and largely independent of BMD and CRFs (10, 12). Genome-wide association studies (GWASs) have identified many genetic variants associated with fracture risk (9, 13). We also recently reported that the integration of genetic profiling into the current model could improve its ability to predict fracture risk independently of BMD and CRFs beyond family fracture history (14). Thus, genetic profiling can improve the OF predictability of the current model. However, most genetic studies of OFs, which were cross-sectional design, show an association of genetic factors with prevalent, but not incident, fracture. Therefore, it remains unclear whether genetic profiling could improve the predictive accuracy of future fracture occurrence (15).
One of the most troublesome aspects of antiosteoporotic drugs is highly variable efficacy (16), with the inadequate response rate (range, 8–25%) (17, 18). Additionally, BMD change explains approximately 4–61% of the drug-induced fracture reduction (16, 19, 20). Thus, genetic factors may be one important cause of this variability that acts independently of BMD changes (21). However, few studies have shown associations between candidate gene polymorphisms and antiosteoporotic treatment responses (21). Thus, the clinical usefulness of genetic factors for predicting the efficacy variability of drugs is still unclear. The present study investigated whether genetic profiling can improve the predictability of future OF occurrence in Korean postmenopausal women taking antiosteoporotic medications.
Subjects and Methods
Study population
Supplemental Figure 1 shows the study flowchart. The population for the genetic risk score (GRS) generation comprised 1269 postmenopausal Korean women who visited Asan Medical Center, Seoul, Korea, and participated in previous GWASs (22). Inclusion and exclusion criteria are described in the Supplemental Data. The incident fracture rates of 1023 women followed up for at least 1 year could be assessed; these women were included in further analyses. All study participants provided written informed consent. This study was approved by the Institutional Review Board of the Asan Medical Center.
All participants were drug-naive at the baseline visit and were left untreated (n = 117) or treated with hormone replacement therapy (HRT) (n = 491) or bisphosphonate (BP) (n = 415) during follow-up. In the HRT group, women were treated with conjugated equine estrogen (0.625 mg daily) either alone or in combination with medroxyprogesterone acetate in a cyclic (5–10 mg daily) or continuous (2.5 mg daily) regimen. In the BP group, women were treated with usual doses of alendronate, risedronate, or ibandronate. Individuals did not take or change to other drugs affecting bone metabolism during follow-up. Adherence to therapy during follow-up was defined as a medication possession ratio ≥80% (total number of days' supply/follow-up period × 100%) (23).
BMD measurements and fracture assessment
We measured areal BMD (g/cm2) at the lumbar spine (LS; L1–L4) and femoral neck (FN) by dual-energy x-ray absorptiometry at both baseline and follow-up visits (detailed in the Supplemental Data). Osteoporosis was defined as the lowest T-score ≤−2.5 SD according to the World Health Organization definition (24).
Lateral thoracolumbar radiographs were obtained from all participants to determine morphological vertebral fractures (VFs) at both baseline and follow-up visits. VF assessment was in accordance with the recommendations of the Working Group on Vertebral Fractures (25). A VF was quantitatively defined as a >20% reduction in any vertebral height measurement (ie, anterior, middle, or posterior) (26). Nonvertebral fractures (NVFs) at the major osteoporosis-related locations (ie, hip, distal radius, proximal humerus, and pelvis) were assessed using a self-administered questionnaire at both baseline and follow-up visits. Fractures clearly caused by major trauma (such as motor vehicle accidents or falls from higher than standing height) were excluded. Thus, only low-trauma fractures after menopause were included. Follow-up time was recorded from the date of baseline visit to the date of the first incident fracture. When a subject sustained fracture at multiple sites, all sites were included in the analyses.
Selection of risk alleles for generating the GRSs
We calculated the two GRSs (GRS35 and GRS63) using the 95 independent single nucleotide polymorphisms (SNPs; Supplemental Table 1) identified in the discovery set of the largest GWAS meta-analysis of BMD (detailed in the Supplemental Data) (22). Genotyping methods are detailed in the previous report (22) and in the Supplemental Data. To identify risk alleles for Korean-specific GRS35, all SNPs were tested to determine their independent associations with osteoporosis-related traits (low BMD or the presence of osteoporosis or OF) at the baseline visit. A risk allele was one that was associated with a decreased BMD, increased risk of osteoporosis, or prevalent fracture at vertebral, nonvertebral, and any sites with marginal significance if the P values were lower than .05 but higher than the significance level of Bonferroni correction for multiple testing (α = 0.05/35 SNPs/three genetic models = 0.00048; detailed in the Supplemental Data). For each individual, each gene was coded as 2 when two risk alleles were present, 1 with one risk allele, or 0 with no risk allele. To estimate the cumulative effect of the genetic markers, all scores were summed to yield GRS35. Global GRS63, based on the 63 SNPs showing significant genome-wide association (P < 5 × 10⁻⁸) with osteoporosis-related traits in the previous GWAS meta-analysis (Supplemental Table 2) (22), was weighted based on the FN BMD effect size of BMD-decreasing allele of each SNP (detailed in the Supplemental Data).
Statistics
All data are presented as means (SD) or as number (percentage). The subject characteristics were compared among the three groups using one-way ANOVA for continuous variables and χ2 tests for categorical variables. Multiple linear or logistic regression models were used to analyze the associations of the 95 SNPs with osteoporosis-related traits at the baseline visit. Associations of the GRSs with osteoporosis-related traits and annualized BMD changes were also tested using multiple linear or logistic regression models. Variance explained (adjusted R2) was estimated from a linear regression model incorporating the GRS as the predictor and the age- and weight-adjusted standardized BMD residuals as an outcome. Cox proportional hazard models were used to investigate associations between GRS tertiles and incident fracture in multiple adjusted models. In these models, FN BMD was used as a representative value because of its inclusion in most fracture risk prediction models (5, 27) and the technical limitations of LS BMD, such as incomplete exclusion of osteoarthritis, degenerative changes, or aortic calcification (28).
We used a reclassification analysis (29), an improved method for measuring the usefulness of adding markers to prediction models, to assess the impact of genetic profiling on fracture prediction. The event probability (any fracture, VF, or NVF) was compared for each individual between the presence and absence of GRS integration into the current model. We selected a 15% cutoff of a 10-year OF probability as a treatment threshold in recent Japanese practice guidelines (2). For each model, the proportion of individuals that would be reclassified was calculated and compared. If GRS was useful for event prediction, the event probability estimated by the integration model would be expected to increase for the event group and decrease for the no-event group when compared with the no-integration model. Predictive improvement was calculated as the net reclassification improvement (NRI) index (29), as follows: NRI = (probability increase in the event group) − (probability decrease in the event group) − (probability increase in the no-event group) + (probability decrease in the no-event group).
The statistical significance of NRI was estimated by a Z-test, a simple asymptotic test for the null hypothesis that the NRI index = 0.0. A net gain significantly greater than zero indicates statistical significance (29). All statistical analyses were performed using SPSS version 18.0 (SPSS Inc), and P ≤ .05 was considered statistically significant.
Results
Supplemental Table 3 shows the baseline characteristics of the study population (n = 1269) for GRS generation. Thirty-five risk alleles in 34 genomic loci were associated with one or more osteoporosis-related traits (Supplemental Tables 4 and 5). One allele represented each locus, except for AKAP11. The two alleles in AKAP11 were poorly correlated (r2 = 0.012). Finally, GRS35 included 35 risk alleles (Supplemental Table 6). Because of little variability in the odd ratios and 95% confidence intervals (CIs), the contribution of each allele to any prevalent fracture was regarded as being equal. Therefore, GRS35 were not weighted.
A total of 1023 subjects (age, 45–93 years) were followed up (mean [SD], 6.1 [3.3] years) (Table 1). The median distributions of GRS35 and GRS63 were 36 (range, 24–48) and 56.4 (range, 37.3–72.4), respectively (Supplemental model 2). Compared with the untreated group, HRT and BP groups had fracture-prone baseline characteristics, such as an older age, lower weight, lower baseline BMD, and/or higher previous fracture history. The annualized BMD changes at both sites were higher in the BP group than in the other two groups, and LS BMD changes were higher in the HRT group than in the untreated group (Table 1). The subjects were divided into GRS tertiles: T1, 24 ≤ GRS35 ≤ 33, and 37.3 ≤ GRS63 ≤ 54.2; T2, 34 ≤ GRS35 ≤ 37, and 54.3 ≤ GRS63 ≤ 58.7; and T3, 38 ≤ GRS35 ≤ 48, and 58.8 ≤ GRS63 ≤ 72.4. A higher GRS was significantly associated with a lower LS BMD (all P < .001 for GRS35; P = .011–.071 for GRS63) and FN BMD (P = .001–.006 for GRS35; P = .002–.024 for GRS63) and higher prevalence of osteoporosis (P = .010–.049 for GRS35) at the baseline visit (Table 2). We found that 0.7 and 2.0% of the genetic variances of LS BMD were explained by GRS35 and GRS63, respectively. In addition, 1.1 and 0.9% of the genetic variances of FN BMD were explained by GRS35 and GRS63, respectively. A higher GRS35, but not GRS63, was also significantly associated with a higher prevalence of any fracture (P = .002–.004), VF (P = .013–.024), and NVF (all P = .030) (Table 3).
Baseline Characteristics of the Study Subjects (n = 1023)
| Variables | Untreated Group | HRT Group | BP Group | P |
|---|---|---|---|---|
| n | 117 | 491 | 415 | |
| Age, y | 55.1 ± 7.1a,b (range, 45–77) | 55.9 ± 6.7 (range, 45–77) | 60.9 ± 8.2 (range, 45–93) | .001 |
| Height, cm | 155.7 ± 4.5b | 155.4 ± 5.2b | 154.4 ± 5.6 | .004 |
| Weight, kg | 57.5 ± 6.7b | 56.8 ± 7.0b | 55.2 ± 7.6 | .001 |
| Body mass index, kg/m2 | 23.8 ± 2.9 | 23.5 ± 2.7 | 23.2 ± 3.0 | .086 |
| Current smoker | 2 (1.7) | 14 (2.9) | 13 (3.1) | .715 |
| Alcohol intake ≥3 U/d | 2 (1.7) | 4 (0.8) | 2 (0.5) | .410 |
| Family history of fracture | 10 (8.5) | 32 (6.5) | 36 (8.7) | .439 |
| Baseline BMD, g/cm2 | ||||
| LS | 0.972 ± 0.014a,b | 0.868 ± 0.007b | 0.801 ± 0.007 | <.001 |
| FN | 0.763 ± 0.011a,b | 0.707 ± 0.005b | 0.658 ± 0.006 | <.001 |
| Previous fracture | 4 (3.4) | 69 (14.1) | 104 (25.1) | <.001 |
| VF | 2 (1.7) | 45 (9.2) | 81 (19.5) | <.001 |
| NVF | 2 (1.7) | 29 (5.9) | 28 (6.7) | .117 |
| Follow-up period | 5.4 ± 3.2a | 6.7 ± 3.4b | 5.2 ± 3.5 | <.001 |
| Adherence to therapy | 272 (55.4) | 257 (61.9) | ||
| Annualized BMD change, % change/y | ||||
| LS | 0.0 ± 5.7a,b | 2.9 ± 7.0b | 4.2 ± 7.1 | <.001 |
| FN | 0.7 ± 5.5b | 1.9 ± 5.9b | 3.1 ± 6.9 | <.001 |
| Incident fracture | 13 (11.1) | 42 (8.6) | 59 (14.2) | .026 |
| VF | 11 (9.4) | 28 (5.7) | 50 (12.0) | .003 |
| NVF | 3 (2.6) | 16 (3.3) | 14 (3.4) | .907 |
| GRS63 | 56.2 ± 5.7 | 56.8 ± 5.0 | 56.5 ± 5.3 | .485 |
| Tertile groups for GRS63 | ||||
| Lowest (T1, 37.3–54.2) | 44 (37.6) | 156 (31.8) | 140 (33.7) | |
| Medium (T2, 54.3–58.7) | 32 (27.4) | 166 (33.8) | 142 (34.2) | |
| Highest (T3, 58.8–72.4) | 41 (35.0) | 159 (34.4) | 133 (32.0) | |
| GRS35 | 35.5 ± 4.0 | 36.0 ± 3.8 | 35.7 ± 3.5 | .413 |
| Tertile groups for GRS | ||||
| Lowest (T1, 24–33) | 32 (27.4) | 134 (27.3) | 114 (27.5) | |
| Medium (T2, 34–37) | 40 (34.2) | 137 (27.9) | 135 (32.5) | |
| Highest (T3, 38–48) | 45 (38.5) | 220 (44.8) | 166 (40.0) |
Values are expressed as mean ± SD or number (percentage). Significant results (P ≤ .05) are in bold. Adherence to therapy during follow-up was defined as a medication possession ratio ≥80% (total number of days' supply/follow-up period × 100%).
P value vs the HRT group by post hoc analysis of variance data.
P value vs the BP group by post hoc analysis of variance data.
Association of the GRS With BMD and Osteoporosis
| LS BMD | FN BMD | Osteoporosis | ||||
|---|---|---|---|---|---|---|
| β | P | β | P | OR (95% CI) | P | |
| GRS35 | ||||||
| Univariate | −0.114 | <.001 | −0.086 | .006 | 1.03 (1.00–1.07) | .049 |
| Multivariate-adjusteda | −0.118 | <.001 | −0.093 | .001 | 1.05 (1.01–1.09) | .010 |
| Multivariate-adjustedb | −0.117 | <.001 | −0.094 | .001 | 1.05 (1.01–1.09) | .010 |
| GRS63 | ||||||
| Univariate | −0.057 | .071 | −0.070 | .024 | 1.01 (0.98–1.03) | .636 |
| Multivariate-adjusteda | −0.072 | .009 | −0.085 | .003 | 1.02 (0.99–1.04) | .278 |
| Multivariate-adjustedb | −0.070 | .011 | −0.086 | .002 | 1.02 (0.99–1.04) | .283 |
Abbreviation: OR, odds ratio. Significant results (P ≤ .05) are in bold.
Association analysis was adjusted for age, weight, and height.
Association analysis was adjusted for age, height, weight, smoking status, alcohol intake (≥3 U/d), and family history of fracture.
Association of the GRS With Prevalent Fractures of Any, Vertebral, and Nonvertebral Sites
| GRS35 | GRS63 | |||
|---|---|---|---|---|
| OR (95% CI) | P | OR (95% CI) | P | |
| Any fracture | ||||
| Univariate | 1.07 (1.02–1.12) | .004 | 1.02 (0.98–1.05) | .383 |
| Multivariate-adjusteda | 1.08 (1.03–1.13) | .002 | 1.02 (0.98–1.05) | .310 |
| Multivariate-adjustedb | 1.08 (1.03–1.13) | .003 | 1.02 (0.98–1.05) | .390 |
| VF | ||||
| Univariate | 1.06 (1.01–1.12) | .020 | 1.00 (0.97–1.04) | .882 |
| Multivariate-adjusteda | 1.07 (1.01–1.14) | .013 | 1.01 (0.97–1.05) | .681 |
| Multivariate-adjustedb | 1.07 (1.01–1.13) | .024 | 1.00 (0.97–1.04) | .837 |
| NVF | ||||
| Univariate | 1.08 (1.01–1.16) | .030 | 1.04 (1.00–1.10) | .076 |
| Multivariate-adjusteda | 1.08 (1.01–1.17) | .030 | 1.05 (1.00–1.09) | .082 |
| Multivariate-adjustedb | 1.08 (1.01–1.17) | .030 | 1.08 (1.00–1.10) | .084 |
Abbreviation: OR, odds ratio. Significant results (P ≤ .05) are in bold.
Association analysis of the GRS was adjusted for age, height, weight, smoking status, alcohol intake (≥3 U/d), and family history of fracture.
Association analysis of the GRS was adjusted for age, height, weight, smoking status, alcohol intake (≥3 U/d), family history of fracture, and baseline BMD at the FN.
A total of 114 (11.1%) incident fractures occurred during follow-up (Table 1). The fracture–event rate was 182.9 per 10 000 person-years. Any incident fractures, VF, and NVF were common in BP and HRT groups because of their fracture-prone baseline characteristics. A higher GRS was related to increased incident fracture. The cumulative incidences of any fracture from T1 to T3 were 2.3, 2.7, and 6.1% for GRS35 and 3.6, 2.8, and 4.7% for GRS63, respectively. The event rates were 131.0, 160.8, and 233.1 per 10 000 person-years of GRS35 and 174.4, 141.1, and 233.5 per 10 000 person-years of GRS63, respectively. The fracture incidence of T3 was clearly higher than those of T1 and T2, whereas the incidence was similar between T1 and T2. Therefore, T1 and T2 were pooled into one group (T1–T2) in the subsequent analyses.
Model 1 compares the fracture incidence of the T3 group with that of the T1–T2 group. Model I (the simplest model) included age, height, weight, and treatment types. Model II (the current fracture risk assessment model) further included smoking and alcohol habits, family fracture history, previous fracture, and baseline BMD values. Model III further included annualized BMD changes, and model IV further included adherence to therapy. The T3 group had significantly higher cases of any fracture incidence in all models (hazard ratio [HR], 1.62; 95% CI, 1.12–2.35, of GRS35; and HR, 1.62; 95% CI, 1.11–2.36, of GRS63 in model I; HR, 1.66; 95% CI, 1.14–2.41, of GRS35; and HR, 1.69; 95% CI, 1.16–2.48, of GRS63 in model II; HR, 1.76; 95% CI, 1.19–2.59, of GRS35; and HR, 1.59; 95% CI, 1.08–2.34, of GRS63 in model III; and HR, 1.73; 95% CI, 1.17–2.55, of GRS35; and HR, 1.56; 95% CI, 1.05–2.30, of GRS63 in model IV). Thus, GRS can further predict any fracture occurrence beyond the current fracture risk assessment model, independently of annualized BMD changes. In the exploratory subanalyses of fracture type, T3 also had higher incident VF in all models (HR, 1.53–1.72 of GRS35 and 1.56–1.72 of GRS63) than that of T1–T2. However, there was no significant association between GRS and incident NVF, possibly due to the lower incidence of NVF in our subjects.
In subanalyses according to treatment type, we only analyzed the relationship of GRS with any fracture because the incidence of NVF was too small for analysis (Table 4). Interestingly, GRS35 was clearly only associated with incident fracture in the BP group, and GRS63 was clearly only associated with incident fracture in the untreated group, but not in the other groups. Compared with the T1–T2 group, the HR of GRS35 T3 was 1.81 (95% CI, 1.08–3.04) in model I, 2.27 (95% CI, 1.31–3.93) in model II, 2.22 (95% CI, 1.27–3.87) in model III, and 2.25 (95% CI, 1.28–3.95) in model IV. Compared with the T1–T2 group, the HR of GRS63 T3 was 3.08 (95% CI, 0.97–9.75) in model I, 4.09 (95% CI, 1.11–15.04) in model II, 3.66 (95% CI, 1.02–13.14) in model III, and 3.89 (95% CI, 1.06–14.29) in model IV.
Cox Proportional HRs and 95% CIs of Incident Fractures by the GRS (Highest Tertile vs Medium and Lowest Tertiles Combined)
| Control Group | HRT Group | BP Group | ||||
|---|---|---|---|---|---|---|
| HR (95% CI) | P | HR (95% CI) | P | HR (95% CI) | P | |
| Any incident fracture by GRS35 | ||||||
| Model Ia | 1.00 (0.31–3.22) | .995 | 1.50 (0.80–2.80) | .208 | 1.81 (1.08–3.04) | .025 |
| Model IIb | 0.98 (0.27–3.52) | .977 | 1.42 (0.75–2.71) | .284 | 2.27 (1.31–3.93) | .018 |
| Model IIIc | 1.03 (0.30–3.58) | .961 | 1.26 (0.64–2.45) | .504 | 2.22 (1.28–3.87) | .005 |
| Model IVd | 1.26 (0.34–4.66) | .728 | 1.21 (0.62–2.36) | .570 | 2.25 (1.28–3.95) | .005 |
| Any incident fracture by GRS63 | ||||||
| Model Ia | 3.08 (0.97–9.75) | .056 | 1.54 (0.82–2.89) | .180 | 1.43 (0.83–2.45) | .197 |
| Model IIb | 4.09 (1.11–15.04) | .034 | 1.40 (0.73–2.69) | .315 | 1.36 (0.78–2.36) | .281 |
| Model IIIc | 3.66 (1.02–13.14) | .046 | 1.40 (0.73–2.69) | .319 | 1.31 (0.74–2.30) | .353 |
| Model IIId | 3.89 (1.06–14.29) | .041 | 1.40 (0.73–2.70) | .310 | 1.32 (0.74–2.37) | .279 |
Significant results (P ≤ .05) are in bold.
Model I: adjusted for age, height, weight, and antiosteoporotic medication (no medication, hormone replacement, and BP treatment).
Model II: adjusted for smoking status, alcohol intake (≥3 U/d), family history of fracture, previous fracture, and baseline BMD values at the FN, in addition to the risk factors from model I.
Model III: adjusted for annualized changes in BMD at the FN, in addition to the risk factors from model II.
Model IV: adjusted for adherence to therapy, which was defined as a medication possession ratio ≥80% (total number of days' supply/follow-up period × 100%), in addition to the risk factors from model III.
Reclassification analysis was performed to compare the predictability of model V (GRS + model IV) with that of model IV (Table 5). Model IV included all CRF components, treatment types, baseline BMD, annualized BMD values, and adherence to therapy. For any incident fracture, model V of GRS35 reclassified seven more of 114 subjects (with incident fracture, 6.1%) into the higher-risk group and none into the lower-risk group, a gain of 6.1% (6.1% minus 0%). Model V of GRS35 reclassified 29 more of 909 subjects (3.2%) with no incident fracture into a lower-risk group and 27 (3.0%) with no fracture into a higher-risk group, a gain of 0.2% (3.2% minus 3.0%). In total, there was a net gain of 6.3% with model V of GRS35 for any fracture compared with model IV (P = .010). For VF, model V of GRS35 yielded a significant net gain of 6.9% (P = .013). For NVF, there was no significant net gain with model V of GRS35 (P = .739). However, there was no significant net gain with model V of the GRS63 for any fracture, VF, and NVF (P = .053–.659).
Reclassification Analysis to Determine the Effect of Adding the GRS to the Current Risk Assessment Model
| Model IV | Model V for GRS35 | Frequency (Row %) | Reclassified, % | NRI, % | P | ||||
|---|---|---|---|---|---|---|---|---|---|
| <15% | ≥15% | Total | Up | Down | |||||
| FX | <15% | 39 | 7 | 46 | 7 (6.1%) | 0 (0.0%) | 6.1 | 6.3 | .010 |
| ≥15%a | 0 | 68 | 68 | ||||||
| Total | 39 | 75 | 114 | ||||||
| No FX | <15% | 692 | 27 | 719 | 27 (3.0%) | 29 (3.2%) | 0.2 | ||
| ≥15%a | 29 | 161 | 190 | ||||||
| Total | 721 | 188 | 909 | ||||||
| Model V for GRS63 | |||||||||
|---|---|---|---|---|---|---|---|---|---|
| FX | <15% | 37 | 10 | 47 | 10 (8.8%) | 9 (7.9%) | 0.9 | 1.8 | .659 |
| ≥15%a | 9 | 58 | 67 | ||||||
| Total | 46 | 68 | 114 | ||||||
| No FX | <15% | 664 | 47 | 711 | 47 (5.2%) | 55 (6.1%) | 0.9 | ||
| ≥15%a | 55 | 143 | 198 | ||||||
| Total | 719 | 190 | 909 | ||||||
| Model V for GRS35 | |||||||||
|---|---|---|---|---|---|---|---|---|---|
| VF | <15% | 29 | 6 | 35 | 6 (6.7%) | 0 (0.0%) | 6.7 | 6.9 | .013 |
| ≥15%a | 0 | 54 | 54 | ||||||
| Total | 29 | 60 | 89 | ||||||
| No VF | <15% | 759 | 45 | 804 | 10 (1.1%) | 12 (1.3%) | 0.2 | ||
| ≥15%a | 35 | 95 | 130 | ||||||
| Total | 794 | 140 | 934 | ||||||
| Model V for GRS63 | |||||||||
|---|---|---|---|---|---|---|---|---|---|
| VF | <15% | 27 | 11 | 38 | 11 (12.4%) | 5 (5.6%) | 6.7 | 7.8 | .089 |
| ≥15%a | 5 | 46 | 51 | ||||||
| Total | 32 | 57 | 89 | ||||||
| No VF | <15%a | 759 | 35 | 794 | 35 (3.7%) | 45 (4.8%) | 1.1 | ||
| ≥15% | 45 | 95 | 140 | ||||||
| Total | 804 | 130 | 934 | ||||||
| Model V for GRS35 | |||||||||
|---|---|---|---|---|---|---|---|---|---|
| NVF | <15% | 26 | 0 | 26 | 0 (0.0%) | 0 (0.0%) | 0.0 | 0.1 | .739 |
| ≥15%a | 0 | 7 | 7 | ||||||
| Total | 26 | 7 | 33 | ||||||
| No NVF | <15% | 966 | 4 | 970 | 4 (0.4%) | 5 (0.5%) | 0.1 | ||
| ≥15%a | 5 | 15 | 20 | ||||||
| Total | 971 | 19 | 990 | ||||||
| Model V for GRS63 | |||||||||
|---|---|---|---|---|---|---|---|---|---|
| NVF | <15% | 26 | 3 | 29 | 3 (9.1%) | 0 (0.0%) | 9.1 | 10.2 | .053 |
| ≥15%a | 0 | 4 | 4 | ||||||
| Total | 26 | 7 | 33 | ||||||
| No NVF | <15% | 965 | 5 | 970 | 16 (1.6%) | 5 (0.5%) | 1.1 | ||
| ≥15%a | 16 | 4 | 20 | ||||||
| Total | 981 | 9 | 990 | ||||||
Abbreviation: FX, any fracture. Significant results (P ≤ .05) are in bold.
Model IV: adjusted for CRFs (age, height, weight, smoking status, alcohol intake, family history of fracture, previous fracture), antiosteoporotic medication (no medication, hormone replacement, and BP), BMD at the FN, annualized BMD change at the FN, and adherence to therapy, which was defined as a medication possession ratio ≥80% (total number of days' supply/follow-up period × 100%).
Model V: included the GRS, in addition to the risk factors from model IV. The numbers in parentheses indicate the percentage of reclassification.
As the cutoff point for reclassification analysis, a 15% event probability was selected because recent Japanese practice guidelines suggested a 10-year probability of major OF of 15% as a treatment threshold (2).
Discussion
In the present study, we generated a Korean-specific GRS35 from 35 risk alleles associated with one or more osteoporosis-related traits at the baseline visit and a global GRS63 from 63 SNPs associated with BMD in a recent large-scale GWAS meta-analysis. The GRS was used for genetic profiling to estimate the cumulative effect of the risk alleles. Incident fracture occurred more frequently in subjects with a higher GRS, especially at vertebrae, and was independent of CRFs, including family fracture history, baseline BMD value, BMD change, and adherence to drugs. Interestingly, the association of GRS35 was especially prominent in patients taking BPs, suggesting that the reduction in fracture risk caused by BP may be ameliorated in patients with a higher GRS35. The association of GRS63 was especially prominent in untreated patients, suggesting that the association may be ameliorated by drugs. Integration of GRS35, but not GRS63, into the current assessment model improved the predictive accuracy by 6.3%. Thus, we have shown two novel findings: 1) genetic profiling improved the predictability of the current assessment model for incident fracture occurrence beyond family fracture history; and 2) genetic factors predicted the efficacy response of BPs.
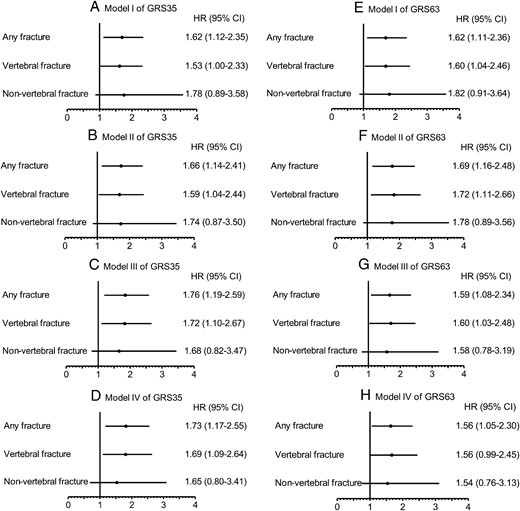
Forest plot of the Cox proportional HRs and 95% CIs of incident fracture according to the GRS35 or GRS63 (highest tertile vs middle and lowest tertiles combined).
A, Model I of GRS35; B, Model II of GRS35; C, Model III of GRS35; D, Model IV of GRS35; E, Model I of GRS63; F, Model II of GRS63; G, Model III of GRS63; H, Model IV of GRS63.
Genetic factors clearly affected OF susceptibility (13), but their clinical usefulness had been unclear because of a minimal contribution of each SNP to the fracture risk (15, 22). Therefore, we tested whether combining the effects of many SNPs (GRS) by genetic profiling would increase the predictive accuracy. This combination was useful for predicting incident fracture occurrence, so the GRS could be clinically useful as a risk factor for OF in combination with BMD and CRFs. Similarly, a simulation study reported that the integration of genetic profiling into current prognostic models may significantly improve their ability to predict fracture risk (10). We also noted a similar result in our recent real genotyping study (14). However, these studies were cross-sectional studies to test an association of the GRS with prevalent, but not incident, fracture.
The drug-induced BMD increase explains 4–61% of the reduction in fractures (16, 19, 20), suggesting the importance of improved bone quality on fracture reduction by antiosteoporotic medication. Indeed, bone histomorphometric data have shown that agents such as HRT and BPs improve bone quality in humans (30, 31). In the present study, a higher GRS35 was associated with more prevalent fractures at baseline visits. In addition, a higher GRS35 predicted a higher occurrence of incident fractures. These associations were independent of baseline BMD and BMD changes, respectively. Moreover, GRS35 was not associated with the BMD change in any group (data not shown). Thus, a higher GRS35 may reflect not only baseline impaired bone quality (deterioration of microarchitecture, geometry, macrostructure, mineralization, and increased bone turnover) (9), but also the reduced improvement in bone quality with drugs. This result may be important in the field of osteoporosis management because bone quality cannot currently be easily measured (32).
Here, GRS35 was also associated with incident fracture in the BP group but not the HRT group. HRT and BP reduce VF risk to a similar extent, despite a smaller increase in BMD from HRT (1–3%) than from BP (5–6%) (33). Thus, HRT improves bone quality more than BPs. Our data suggest that HRT, but not BPs, could improve bone quality, even in subjects with a higher GRS, resulting in a lack of an association between GRS35 and fracture risk in the HRT group. Another possible explanation is that the HRT group had a relatively lower rate of incident fracture because of fewer risk factors for fracture at baseline, possibly weakening the statistical power.
The efficacy responses of antiosteoporotic treatments range from good to none. Clinical trials showed an inadequate response (BMD change of ≤0%) in 10–15% of patients treated with HRT and 8–25% of patients treated with BP (17, 18). Although the cause of an inadequate response is currently unclear, genetic factors may be an important cause of variable drug responses (21). Our present results confirm this hypothesis. Especially from a clinical viewpoint, the association between a higher GRS35 and a higher incidence of fractures in the BP group is important because BPs are now the most widely used first-line antiosteoporotic drugs (3). Although our finding needs to be replicated in other cohorts, the fracture reduction by BP may be weakened in patients with a higher GRS35 in Korean populations.
The differences in the underlying linkage disequilibrium structure and in the frequency of sequence variants between Caucasian and Asian populations (34) can influence the results of association studies with genetic profiling (35). Therefore, we hypothesized that genetic profiling using a Korean-specific GRS (GRS35) would provide more information about fracture risk than the global GRS (GRS63). Consistent with our hypothesis, GRS35 provided more information about risk for incident fracture than GRS63, and integration of GRS35, but not GRS63, into the current model further improved its predictability for incident fracture occurrence. Similarly, one study recently showed that the global GRS63 improved the fracture prediction in another larger Caucasian population (n = 8202) during preparation of our manuscript (36). Therefore, we suggest that genetic profiling considering the ethnicity rather than the number of SNPs could more accurately predict future fracture risk, and finding the ethnic-specific GRS might be needed. In addition, the association of GRS63 was especially prominent in untreated patients. Although we cannot suggest a mechanism for this result, GRS63 was developed from BMD-associated SNPs. Thus, the associations of GRS63 were attenuated by drugs that could modify BMD.
Our study had several limitations. First, the associations of the risk alleles were marginally significant. However, 35 SNPs were associated at P < 5 × 10⁻⁶ in the discovery set of the GWAS (22) and were tested for replication of association here. Second, the subjects were not randomized, with some baseline characteristics differing among the groups. Randomization is ethically impossible because current treatment guidelines recommend different therapeutic strategies according to individual fracture risk profiles (1–3). Third, there was similar fracture incidence between T1 and T2, so we divided our subjects into only two risk groups. Fourth, a major weakness of the study is that the prediction model is based on retrospective data but not on the actual prospective data. Finally, our results could be restricted to the Korean population and could not be transferred to other ethnic populations. Therefore, prospective studies including other ethnicities are needed.
In summary, genetic profiling can provide a useful index of OF risk and drug response for an individual taking antiosteoporotic medication. An individualized index would potentially help clinicians to tailor treatment and make informed choices related to lifestyle and preventive interventions.
Acknowledgments
We are grateful to all of the collaborators of the Genetic Factors for Osteoporosis (GEFOS) consortium (http://www.gefos.org/). A full list of the members and affiliations of GEFOS appears at the end of the Supplemental Data.
This work was supported by grants from the Korea Health Technology R&D Project and the National Project for Personalized Genomic Medicine, Ministry of Health & Welfare, Republic of Korea (Project No. A110536) and by grants from the Asan Institute for Life Sciences, Seoul, Republic of Korea (Project No. 2014-626). This work was supported under the framework of an international cooperation program managed by the National Research Foundation of Korea (Grant NRF-2015K2A2A2002107). The genotyping of this study was done within the setting of the Genetic Factors for Osteoporosis (GEFOS) consortium funded by the European Commission (HEALTH-F2-2008-201865-GEFOS).
Disclosure Summary: All authors have nothing to disclose.
M.I.K. and J.-M.K. are joint senior authors.
S.H.L. and E.-H.C. are joint first authors.
Abbreviations
- BMD
bone mineral density
- BP
bisphosphonate
- CI
confidence interval
- CRF
clinical risk factor
- GRS
genetic risk score
- GWAS
genome-wide association study
- HR
hazard ratio
- HRT
hormone replacement therapy
- NRI
net reclassification improvement
- NVF
non-VF
- OF
osteoporotic fracture
- SNP
single nucleotide polymorphism
- VF
vertebral fracture.
