


The diagnosis of adrenal insufficiency is clinically challenging and often requires ACTH stimulation tests.
To determine the diagnostic accuracy of the high- (250 mcg) and low- (1 mcg) dose ACTH stimulation tests in the diagnosis of adrenal insufficiency.
We searched six databases through February 2014. Pairs of independent reviewers selected studies and appraised the risk of bias. Diagnostic association measures were pooled across studies using a bivariate model.
For secondary adrenal insufficiency, we included 30 studies enrolling 1209 adults and 228 children. High- and low-dose ACTH stimulation tests had similar diagnostic accuracy in adults and children using different peak serum cortisol cutoffs. In general, both tests had low sensitivity and high specificity resulting in reasonable likelihood ratios for a positive test (adults: high dose, 9.1; low dose, 5.9; children: high dose, 43.5; low dose, 7.7), but a fairly suboptimal likelihood ratio for a negative test (adults: high dose, 0.39; low dose, 0.19; children: high dose, 0.65; low dose, 0.34). For primary adrenal insufficiency, we included five studies enrolling 100 patients. Data were only available to estimate the sensitivity of high dose ACTH stimulation test (92%; 95% confidence interval, 81–97%).
Both high- and low-dose ACTH stimulation tests had similar diagnostic accuracy. Both tests are adequate to rule in, but not rule out, secondary adrenal insufficiency. Our confidence in these estimates is low to moderate because of the likely risk of bias, heterogeneity, and imprecision.
Adrenal insufficiency is a life-threatening disorder characterized by failure of adrenal cortisol production either from adrenal disease (primary adrenal insufficiency, PAI) or deficiency of ACTH (secondary adrenal insufficiency, SAI) (1, 2). Prompt diagnosis is important because adequate hormonal replacement therapy is lifesaving (1, 3–5). Even with early diagnosis and institution of therapy, patients with the diagnosis of adrenal insufficiency have higher mortality (6, 7), decreased quality of life (8, 9), and increased risk of adrenal crisis (10, 11).
Adrenal insufficiency may present with nonspecific symptoms (eg, fatigue, weight loss, nausea, loss of appetite), resulting in a potential delay in diagnosis. In a cross-sectional study of 216 patients with both primary and secondary adrenal insufficiency, 47% had symptoms for more than 1 year before diagnosis and 20% had symptoms for more than 5 years before diagnosis. The correct diagnosis was established during the initial medical encounter in only 15% of patients (12).
Once adrenal insufficiency is suspected, biochemical testing is required to confirm the diagnosis (1). The initial step in evaluation is the measurement of baseline morning serum cortisol and an ACTH stimulation test. The insulin hypoglycemia test (insulin tolerance test) is considered the gold standard for the diagnosis of SAI. This test may not be possible in all situations because it requires medical supervision and can be unsafe in patients with history of seizures, cardiac disease, or the elderly (1, 13). The single-dose overnight metyrapone stimulation test is another confirmatory dynamic test that has been used in the past for the diagnosis of adrenal insufficiency. Through its inhibition of 11-β-hydroxylase, metyrapone results in decreased cortisol levels with subsequent feedback stimulation of ACTH and accumulation of the pre-enzyme block substrate 11-deoxycortisol. This test has a similar diagnostic performance to the insulin hypoglycemia test and is a potential alternative when there is a contraindication to the insulin hypoglycemia test (13, 14).
The insulin-induced hypoglycemia test and the single-dose overnight metyrapone tests are expensive, cumbersome, and have potential significant side effects compared to the ACTH stimulation tests. These latter tests assess the serum cortisol response to acute ACTH stimulation with either a 250-μg dose (high or standard dose) or 1-μg dose (low dose) (1, 13).
The objective of this systematic review and meta-analysis was to compare the diagnostic accuracy of the high- and low-dose ACTH stimulation tests in patients with either primary or secondary adrenal insufficiency.
Materials and Methods
Eligibility criteria
Inclusion criteria for eligible studies were predefined in a study protocol. We included observational and randomized studies that assessed the diagnostic accuracy of high- and low-dose ACTH stimulation tests for the diagnosis of PAI or SAI when compared to a gold standard. In cases of PAI the gold standard included clinical features, serum cortisol, serum ACTH levels, and follow-up. In SAI, both the insulin tolerance test and metyrapone test were considered gold standards. Exclusion criteria included case series (uncontrolled studies), review studies, and studies that evaluated patients with critical illness; patients with expected secondary adrenal insufficiency because of exogenous steroid use (eg, patients with autoimmune diseases treated with steroids, patients with asthma) or steroid therapy not discontinued before adrenal insufficiency testing (with no restriction regarding time of discontinuation).
Search strategy
We conducted a comprehensive search of several databases without language restriction from each database's earliest inception to February 28, 2014. The databases included Ovid Medline In-Process & Other Non-Indexed Citations, Ovid MEDLINE, Ovid EMBASE, Ovid Cochrane Central Register of Controlled Trials, Ovid Cochrane Database of Systematic Reviews, and Scopus. The search strategy was designed and conducted by an experienced librarian with input from the study's principal investigator (M.H.M.). Controlled vocabulary supplemented with keywords was used to search for adrenal insufficiency. The details of the search are available in the supplemental material. Cross-referencing with previously published systematic reviews and contacting content experts were also performed to supplement the electronic search.
Working independently and in duplicate, the reviewers screened the available abstracts (N.SO., A.A., I.B., A.J., K.B., E.K.). Articles in full text were then retrieved and were reviewed independently and in duplicate for eligibility. Disagreements between reviewers were resolved by consensus.
Data extraction for systematic review
Working independently and in duplicate, data from the included studies were extracted using a standardized data extraction sheet, including baseline information about included studies and the number of patients with true-positive, true-negative, false-positive, and false-negative results. In cases where the required data were not present in the published manuscript, authors were contacted for additional information (four authors were contacted with response obtained from one author).
Quality of the studies
Critical appraisal of the included studies was performed independently and in duplicate following the Quality Assessment of Diagnostic Accuracy Studies instrument. This includes the assessment of the risk of bias and applicability in the following domains: patient selection, index test, reference standard, and flow and timing. This tool includes signaling questions to help reviewers assess the risk of bias. One domain of the tool evaluates patient selection and the methods used for enrolling patients (eg, consecutive or random sample) and the appropriateness of exclusion criteria. Another domain evaluates the index test and whether it was interpreted without knowledge of the standard reference. A domain about the reference standard evaluates whether the interpretation of the reference standard was performed without knowing the results of the index text. Finally, the domain of flow and timing focuses on knowing when the reference standard was performed and in how many patients (15, 16). Cases in which the reviewers' assessment of the risk of bias differed were resolved by consensus.
Statistical analysis
Diagnostic estimates from included studies were pooled by fitting a two-level mixed logistic regression model with independent binomial distributions for the true positives and true negatives. These distributions were conditional on the sensitivity and specificity in each study. We also used a bivariate normal model for the logit transforms of sensitivity and specificity between studies (17, 18). The analysis was done using STATA, version 13 (StataCorp, College Station, TX). Heterogeneity between the studies was assessed using the I2 statistic. We report sensitivity, specificity, likelihood ratios, and diagnostic odds ratios (ORs), with 95% confidence intervals (CIs).
Results
Search results
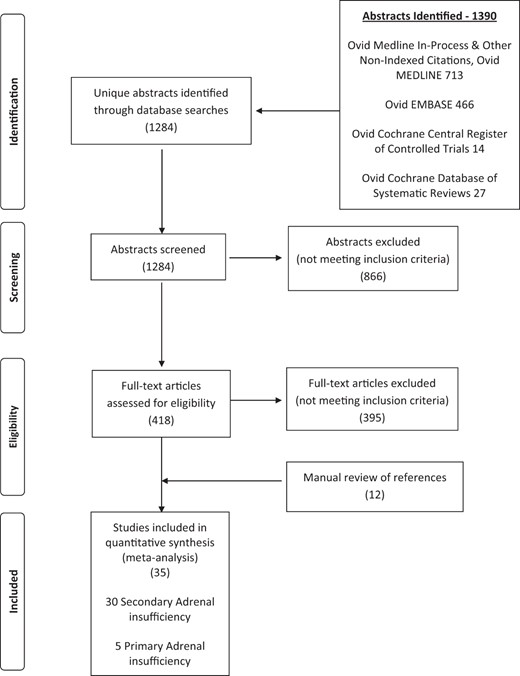
The results of the systematic search are shown in Figure 1. The systematic search identified 1284 potentially relevant references of which 35 studies were included (30 in SAI, five in PAI).
Study selection.
Risk of bias
Using the Quality Assessment of Diagnostic Accuracy Studies-2 instrument, all included studied had moderate risk of bias as shown in Supplemental Figure 1. This conclusion is mainly driven by unclear or inappropriate patient selection and referral bias leading to high prevalence. Otherwise, the studies had low risk of bias in the domains of index test, reference standard, and flow and timing.
Secondary adrenal insufficiency
We identified 30 studies (19–48) assessing the diagnostic performance of the ACTH stimulation test in patients with suspected SAI. Supplemental Tables 1 and 2 summarize the characteristics of these studies that enrolled adults and children, respectively. These studies enrolled a total of 1437 patients with a prevalence of SAI of 36% (35% in adults and 38% in children). Most studies administered ACTH IV.
We included studies that defined whether the test was positive or negative based on predefined cutoffs that the serum cortisol level had to exceed at any time after ACTH administration, “peak cortisol level.” Other studies used a specific time (30 or 60 minutes) to assess for this predefined serum cortisol value to determine whether the test was positive or negative. The distribution of the included studies in terms of test used and cutoff is as follows:
The overall analysis for the accuracy of high-dose ACTH stimulation test in adults included 29 datasets (19, 21–23, 25–29, 31, 33–40, 42, 44–46, 48). Six studies were included in the analysis of high-dose ACTH in adults using 500 nmol/L at 30 minutes as a cutoff (22, 25, 28, 34, 39, 44), 14 studies used a 500 nmol/L peak serum cortisol value as a cutoff (19, 21, 23, 26, 29, 33, 36–38, 40, 42, 45, 46, 48), and eight a serum cortisol cutoff of 550 nmol/L (21, 23, 31, 33, 35, 38, 45, 48).
The overall analysis for the accuracy of the low-dose ACTH stimulation test in adults included 19 datasets (19, 20, 23–25, 29, 35, 37, 38, 40, 43, 45, 46, 48). Eleven studies used a 500-nmol/L peak serum cortisol value for the low-dose ACTH stimulation test in adults (19, 20, 23, 29, 37, 38, 40, 43, 45, 46, 48); six used a peak serum cortisol level of 550 nmol/L as the cutoff value (23, 35, 38, 43, 45, 48).
The overall analysis of the low-dose ACTH stimulation test in children included five datasets (30, 32, 41, 47). Three studies evaluated the low-dose ACTH stimulation test in children with a peak cortisol of 500 nmol/L (32, 41, 47) and two a peak cortisol level of 550 nmol/liter as the cutoff (30, 41). The overall analysis of the high-dose ACTH stimulation test in children included four datasets (30, 41, 47). Two studies evaluated the high-dose ACTH in children using a peak of 500 nmol/liter (41, 47) and two studies with a peak cortisol of 550 nmol/liter (30, 41).
Diagnostic performance in SAI
The diagnostic performance for the high- and low-dose ACTH stimulation test in adults and children according to three different test cutoffs are summarized in Table 1 and 2. Summary receiving operator characteristics curves are in Figures 2 and 3 for low and high dose, respectively. Studies were excluded if patients on long-acting steroid were included or, because of the lack of a predefined gold standard, reported equivocal results for the gold standard or used a gold standard that was not compatible with the inclusion criteria (14, 49–60).
Meta-Analysis Results: ACTH Stimulation Tests for the Diagnosis of Secondary Adrenal Insufficiency
| Estimate | 95% CI | |
|---|---|---|
| Adult High-Dose ACTH Stimulation Test | ||
| Sensitivity | 0.64 | 0.52–0.73 |
| Specificity | 0.93 | 0.89–0.96 |
| Likelihood ratio for positive test | 9.1 | 5.7–14.6 |
| Likelihood ratio for negative test | 0.39 | 0.30–0.52 |
| Diagnostic odds ratio | 23 | 13–42 |
| Adult Low-Dose ACTH Stimulation Test | ||
| Sensitivity | 0.83 | 0.75–0.89 |
| Specificity | 0.86 | 0.78–0.91 |
| Likelihood ratio for positive test | 5.9 | 3.8–8.9 |
| Likelihood ratio for negative test | 0.19 | 0.13–0.29 |
| Diagnostic odds ratio | 30 | 18–50 |
| Children High-Dose ACTH Stimulation Test | ||
| Sensitivity | 0.36 | 0.10–0.73 |
| Specificity | 0.99 | 0.81–0.99 |
| Likelihood ratio for positive test | 43.5 | 1–1891.2 |
| Likelihood ratio for negative test | 0.65 | 0.36–1.15 |
| Diagnostic odds ratio | 67 | 1–4152 |
| Children Low-Dose ACTH Stimulation Test | ||
| Sensitivity | 0.69 | 0.28–0.93 |
| Specificity | 0.91 | 0.63–0.98 |
| Likelihood ratio for positive test | 7.7 | 1.3–44.8 |
| Likelihood ratio for negative test | 0.34 | 0.10–1.18 |
| Diagnostic odds ratio | 23 | 2–313 |
ACTH Stimulation Tests for the Diagnosis of Secondary Adrenal Insufficiency Based on Cortisol Cutoff
| Adults | |||||||||
|---|---|---|---|---|---|---|---|---|---|
| High-Dose ACTH Test | Low-Dose ACTH Test | ||||||||
| Cortisol Cutoff (nmol/liter) | LR+ | LR− | Diagnostic OR | No. of Studies | LR+ | LR− | Diagnostic OR | No. r of Studies | P Value (for Difference) |
| 500–30 minutes | 6.3 (2.5–16) | 0.32 (0.20–0.51) | 20 (5–75) | 6 | NR | NR | NR | NR | NA |
| 500–peak | 12.4 (6.7–23.0) | 0.48 (0.32–0.72) | 26 (11–60) | 14 | 7.1 (4.3–11.6) | 0.21 (0.13–0.33) | 34 (17–68) | 11 | .631 |
| 550–peak | 6.4 (3.4–12) | 0.36 (0.21–0.61) | 18 (8–43) | 8 | 3.8 (1.5–9.4) | 0.23 (0.11–0.49) | 16 (6–40) | 6 | .855 |
| Children | |||||||||
|---|---|---|---|---|---|---|---|---|---|
| High-Dose ACTH Test | Low-Dose ACTH Test | ||||||||
| 500–peak | 15.96 (2.12–120.04) | 0.37 (0.01–12.95) | 40.67 (1.1–1424.1) | 2 | 18.3 (2.04–164.73) | 0.31 (0.5–1.9) | 93.63 (14.6–620.1) | 3 | .686 |
| 550–peak | 6.1 (1.09–34.17) | 0.78 (0.58–1.06) | 7.96 (1.2–51.4) | 2 | 4.3 (2.65–7.06) | 0.2 (0.02–1.92) | 24.8 (1.73–356.9) | 2 | .494 |
Abbreviations: LR+, likelihood ratio of a positive test; LR−, likelihood ratio of a negative test; NA, not applicable; NR, not reported.
Heterogeneity values (I2)–adults: high-dose 30-minute cutoff, 32%; high-dose 500 peak cut off, 90%; high-dose 550 peak cutoff: 81% low-dose 500 peak cut off: 88%; low-dose 550 peak cut off, 93%. Children: high-dose 500 peak cutoff, 60%; high-dose 550 peak cutoff, 0%; low-dose 500 peak cutoff, 0%; low-dose 550 peak cutoff. 66%.
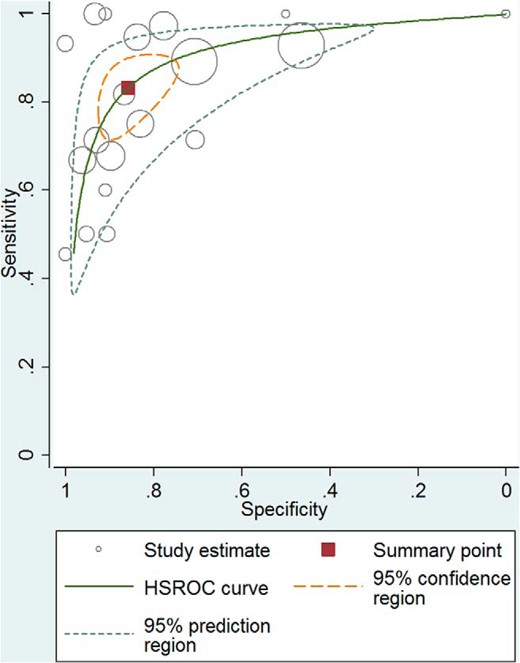
Receiver operator characteristic curve–high-dose ACTH stimulation test for secondary adrenal insufficiency. HSROC, hierarchical summary receiver operating characteristic.
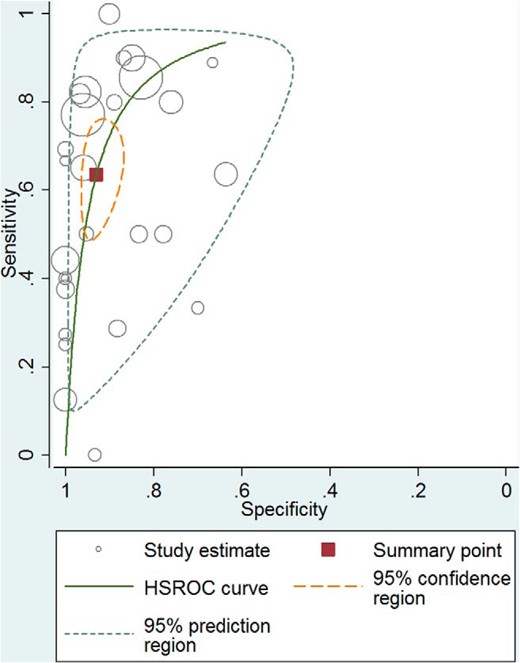
Receiver operator characteristic curve–low-dose ACTH simulation test for secondary adrenal insufficiency. HSROC, hierarchical summary receiver operating characteristic.
In general, both tests had low and high specificity resulting in reasonable likelihood ratios for a positive test (adults: high dose, 9.1; low dose, 5.9; children: high dose, 43.5; low dose, 7.7), but a fairly suboptimal likelihood ratio (LR) for a negative test (adults: high dose, 0.39; low dose, 0.19; children: high dose, 0.65; low dose, 0.34). Both high- and low-dose tests had moderate accuracy overall (diagnostic ORs ranging from 23 to 67) primarily because of the low sensitivity. However, there was no statistically significant difference between accuracy of the high- and the low-dose tests when comparing diagnostic ORs. The analysis was associated with significant heterogeneity, which is common in diagnostic meta-analysis. A summary of the meta-analysis results is shown in Tables 1 and 2. The receiver operator characteristic (61) curve for the high- and low-dose ACTH stimulation test in adults are found in Figures 2 and 3, respectively.
Primary adrenal insufficiency
We identified five studies (62–66) investigating the diagnostic performance of the high-dose ACTH stimulation test for the diagnosis of PAI. The characteristics of these studies are summarized in Supplemental Table 3.
Diagnostic performance in PAI
Data were insufficient to estimate specificity, likelihood, and diagnostic ORs. Only the sensitivity (the rate of a positive test among patients with confirmed PAI) was estimable and was 92% (95% CI, 81–97%).
Discussion
This systematic review and meta-analysis aimed at identifying the diagnostic accuracy of ACTH stimulation test in patients with PAI and SAI. We demonstrated that both high- and low-dose stimulation tests had similar diagnostic accuracy in SAI. Both tests in general had moderate accuracy because of low sensitivity. Therefore, they are more helpful in ruling in the condition when positive. However, they are not as reliable in ruling out the condition when negative. We demonstrated overall consistency of accuracy measures across different peak cortisol cutoffs and in children and adults. Data in PAI are insufficient to estimate diagnostic accuracy, and one can only conclude that the high-dose test had high sensitivity of 92%. Many of these PAI patients may have had congenital adrenal hyperplasia; however, the available studies did not provide data to distinguish these patients and allow estimation of diagnostic accuracy measures specific to them. The quality of evidence (confidence in estimates) generated from this analysis is moderate in PAI (because of heterogeneity) and low to moderate in SAI (because of heterogeneity and increased risk of bias).
Two previous systematic reviews attempted to evaluate the diagnostic accuracy of ACTH stimulation tests (67, 68). Dorin and colleagues reported high sensitivity (97.5%) and specificity (96.5%) for the high-dose ACTH stimulation test in the diagnosis of primary adrenal insufficiency. However, they included studies in which healthy volunteers and persons without endocrine disease were used as a reference. We did not find any studies that assessed the performance accuracy of the high-dose ACTH test in patients with suspected PAI and, therefore, are only able to report the sensitivity based on studies that included patients with known disease. Data from such cohorts exaggerate diagnostic accuracy measures (compared to the optimal study design that includes patients with suspected disease).
Dorin and colleagues noted a positive LR of 11.5 and a negative LR of 0.45 for the high-dose ACTH stimulation test (at a set specificity of 95%) for evaluating SAI, which is comparable with our results. We found no statistically significant difference between the diagnostic performance of the high- vs low-dose ACTH simulation test for the diagnosis of SAI, which is consistent with previous reports (67). Our results are in contrast to the findings of Kazlauzkaite and colleagues (68), who performed a systematic review based on patient level data and reported better performance of the 30-minute cortisol values obtained during low dose ACTH stimulation test when compared to the high-dose ACTH stimulation test, even when excluding patients with steroid use from the analysis. Differences in methods (patient level data) and number of included studies (13) should be taken into consideration when comparing the results of this meta-analysis to prior reports.
The limitations of the current available literature are mostly related to significant variability in 1) the pretest probability of the diagnosis of adrenal insufficiency in the included populations, 2) the use of different cortisol assays (mostly radioimmunoassays in the included studies), and 3) different cutoff values for the interpretation of the test results (time of measurement and value) in both the index test (ACTH stimulation test) and the gold standard (insulin tolerance test and/or metyrapone test). In addition, technical differences should also be considered in future studies in which the diagnostic performance of the different doses of ACTH stimulation tests are evaluated such as the preparation of the 1-mcg dose of ACTH and the length of tubing used for administration (69). These differences are reflected in the significant level of heterogeneity that we encountered between studies and the wide CIs for some of the estimates.
In addition, the quality assessment of the included studies showed a moderate risk for bias due to patient selection and concern of applicability of the results due to the performance and interpretation of the index test.
Despite these limitations, we believe the results of our study provide interesting insights for the diagnostic performance of ACTH stimulation studies in diagnosing adrenal insufficiency. First, when considering the diagnosis, physicians should have an understanding of the pretest probability of disease. This is important because the presented likelihood ratios of both the high- and low-dose ACTH stimulation tests suggest that, although helpful, these tests are not perfect and can be misleading in some cases. Second, knowledge of the limitations of the test and possible responsible factors (cortisol assay used, time, and cut off used for interpretation) should be considered during the medical decision-making process. The use of gold standard tests might be needed when the results of the ACTH stimulation tests are equivocal or when the test is negative in the setting of high clinical suspicion. For example, in a patient with history of pituitary disease who presents with fatigue and deficiency of other pituitary hormones, most clinicians would be highly suspicious of SAI (high risk for SAI). As shown, in Supplemental Figure 2A, a negative test in that patient would not decrease the likelihood of disease to a level at which most physicians would be comfortable excluding SAI.
On the other hand, in a patient with fatigue without any signs or risk factors for SAI and an equivocal serum morning cortisol (3–18 mcg/dL) (low risk for SAI), a negative result will significantly decrease the probability of disease (Supplemental Figure 2B). Unfortunately, there are no validated tools to establish a reliable pretest probability for adrenal insufficiency and this only depends on clinical experience.
A taskforce from the Endocrine Society will provide the clinical context and interpretation to our findings.
Conclusion
Both high- and low-dose ACTH stimulation tests have similar diagnostic accuracy. Both tests are adequate to rule in, but not rule out, secondary adrenal insufficiency. Our confidence in these estimates is low-moderate because of the risk of bias of the included studies, heterogeneity, and imprecision.
Acknowledgments
We thank Larry J. Prokop for his help in designing and executing the search strategy.
Funding for this study was provided by The Endocrine Society.
Disclosure Summary: the authors have nothing to disclose.
Abbreviations
- CI
confidence interval
- LR
likelihood ratio
- OR
odds ratio
- PAI
primary adrenal insufficiency
- SAI
secondary adrenal insufficiency.
References
Author notes
N.S.O. and A.A.N. contributed equally to this study.
