


Menopausal hormone therapy (MHT) favorably affects bone mineral density (BMD). Whether MHT also affects bone microarchitecture, as assessed by trabecular bone score (TBS), has never been evaluated.
Our objective was to assess the effect of MHT on TBS and BMD before and after its withdrawal.
This was a cross-sectional study.
This study included the general community.
Data were collected from the OsteoLaus cohort (1500 women aged 50–80 years). After exclusion of women with bone-modulating treatments, 1279 women were categorized according to MHT status into current (CU), past (PU), and never (NU) users.
Spine TBS and BMD at lumbar spine, femoral neck, and total hip were assessed by dual X-ray absorptiometry.
Age- and body mass index-adjusted analysis showed higher TBS values in CU vs PU or NU (1.31 ± 0.01, 1.29 ± 0.01, and 1.27 ± 0.01, respectively; P < .001). All BMD values were significantly higher in CU vs PU or NU. Compared to NU, PU exhibited higher lumbar spine (0.94 ± 0.01 vs 0.91 ± 0.01 g/cm2; P = .017) and total hip (0.86 ± 0.01 vs 0.84 ± 0.01 g/cm2; P = .026) BMD and a trend for higher TBS (P = .066). The 10-year loss of TBS and BMD at lumbar spine and total hip was significantly lower for both CU and PU vs NU. MHT duration had no effect on bone parameters. In PU, the residual effect on TBS and BMD was significantly more prominent in early discontinuers (<2 years).
MHT is associated with bone microarchitecture preservation, as assessed by TBS. The effect of MHT on TBS and BMD persists at least 2 years after withdrawal.
Osteoporosis is a systemic skeletal disease characterized by low bone mass and microarchitectural deterioration of bone tissue, resulting in increased bone fragility and susceptibility to fracture (1). Bone mineral density (BMD), measured by dual X-ray absorptiometry (DXA), is a major determinant of bone strength and fracture risk (2). Nevertheless, one-half of fragility fractures occur in individuals with BMD values in the osteopenic or even normal range (3), highlighting the role of other factors on bone strength, such as bone microarchitecture. A noninvasive assessment of the latter has been proposed by the use of trabecular bone score (TBS). TBS is a textural index that evaluates pixel gray-level variations in the lumbar spine DXA image, providing an indirect index of trabecular microarchitecture (4). Multiple case-control studies, prospective trials (5, 6), and a meta-analysis (7) have shown that TBS predicts fracture risk in postmenopausal women, independently of clinical risk factors, BMD and FRAX tool. In 2015, TBS was added in the FRAX tool to evaluate the 10-year fracture risk.
Menopausal hormone therapy (MHT) was for many years a first-line therapy in the prevention of postmenopausal osteoporosis. This practice was supported by observational data. The Women’s Health Initiative (WHI) randomized trial was the first study to prove that MHT reduces the incidence of all osteoporosis-related fractures in postmenopausal women, even those at low risk of fracture (8, 9). The trial concluded, however, that the bone benefits are outweighed by other adverse events, particularly an increase in breast cancer, coronary heart disease, and strokes in the estrogen/progestin arm and an excess of strokes in the estrogen-only arm. These conclusions led to a diminishing clinical use of estrogen (10), with regulatory bodies downgrading MHT to second-line therapeutic choice for postmenopausal osteoporosis.
However, controversy persists about the validity of these conclusions (11). Subgroup analysis of women aged 50–59 years at entry in the WHI trial showed favorable long-term outcomes for cardiovascular disease and global index of health (12, 13). Promising evidence for protection against bone loss has been reported with lower doses of oral estrogen or transdermal administration (14). The latter most likely causes fewer less adverse vascular events (15). As a result, the latest guidelines reestablish MHT as a first-line treatment for the prevention of fracture in at-risk women before age of 60 years or within 10 years after menopause without any mandatory time limit for the duration of treatment (16). The initiation of MHT after the age of 60 years remains not recommended because of the risk of long-term complications and the existence of alternatives medications with a better safety profile.
Although the positive effect of MHT on BMD is well-established, there are no available data on the direct influence of MHT on TBS. A small retrospective cohort study assessed the longitudinal changes of BMD and TBS in two different states of estrogen deprivation: natural menopause and aromatase inhibitor treatment (17). After a follow up of 2–3 years, TBS declined in both groups, but to a lesser extent than BMD.
Given the renewed interest for MHT, we aimed to explore the effect of MHT on TBS and BMD before and after its withdrawal using data from a large cross-sectional, population-based study on osteoporosis in women conducted in Lausanne, Switzerland.
Materials and Methods
Setting.
Data from the OsteoLaus study were used (18). OsteoLaus is a substudy of the CoLaus study, an ongoing prospective study aiming to assess the determinants of cardiovascular disease using a population-based sample drawn from the city of Lausanne, Switzerland (19). Between September 2009 and September 2012, all women aged between 50 and 80 years from the CoLaus study were invited to participate in the OsteoLaus study and 85% accepted. The OsteoLaus study was approved by the Institutional Ethics Committee of the University of Lausanne. All participants signed an informed consent.
At baseline, each patient had: 1) A questionnaire on potential clinical risk factors for fracture/osteoporosis (including Swiss FRAX assessment) and on conditions affecting bone metabolism; 2) determination of the type, dose and duration of MHT; 3) a spine (L1 to L4) and femur DXA scan using the Discovery A System (Hologic); 4) a blind central processing of TBS (TBS iNsight v2.1, medimaps) based on a previously acquired anteroposterior spine DXA scan; and 5) a vertebral fracture assessment (VFA) by two experimented clinicians using the semiquantitative approach of Genant (20).
Participants.
A total of 1500 women were included in the OsteoLaus cohort; 58 were excluded from our analysis because of uninterpretable lumbar spine images (extreme body mass index [BMI] defined as <15 kg/m2 or >37 kg/m2, severe spine deformations, osteosynthesis material, fewer than two evaluable vertebrae). A total of 137 women were excluded for current or past osteoporotic treatment other than MHT and 23 for current or past exposure to aromatase inhibitors or tamoxifen. Three others cases were excluded because of congenital hyperostosis, androgen treatment, and transsexuality.
According to MHT status, the remaining participants (n = 1279) were divided into three groups: current (CU), past (PU), and never users (NU). The CU group was on MHT at trial entry or discontinued MHT for less than 6 months (otherwise considered as PU). The CU group had followed MHT for at least 6 months (otherwise considered as NU). The PU group followed MHT for at least 6 months (otherwise considered as NU) and discontinued MHT at least 6 months before trial entry (otherwise considered as CU).
Variables.
BMD at lumbar spine, femoral neck, total hip, as well as spine TBS were defined as the primary outcomes of the analysis. Age and BMI were considered as major confounders and effect modifiers. Other variables of interest were prevalence of vertebral fractures in VFA (defined as at least one fracture of grade 2/3 and/or at least two fractures of grade 1), history of fragility fractures (defined as low-trauma fractures, symptomatic or asymptomatically discovered on VFA), history of major osteoporotic fractures (defined as fragility fractures in vertebrae, hip, proximal humerus, distal forearm, and pelvis), and use of supplements (defined as current or past use of calcium and/or vitamin D). The 10-year fracture risk was calculated with the Swiss FRAX tool.
Dietary calcium intake was assessed using a validated, semiquantitative food frequency questionnaire, which also includes portion size (21). This food frequency questionnaire has been validated in the Geneva population (22).
Plasma 25-hydroxyvitamin D levels were available for most the participants (n = 1204, NU = 582, PU = 359, CU = 263) from the second CoLaus visit that took place within 6 months before the OsteoLaus visit. The plasma 25-hydroxyvitamin D level was measured using an ultrahigh pressure liquid chromatography-tandem mass spectrometry system (23). The interday coefficient of variation was 4.6% at 40 nmol/L.
Statistical analysis.
Statistical analyses were conducted using Stata, v14.1 (StataCorp), for Windows. Descriptive results were expressed as number of participants (percentage) or as average ± SD. Bivariate analyses were conducted using χ2 for categorical variables and ANOVA for continuous variables. Multivariate analyses for continuous variables were conducted using ANOVA or multiple regression; results were expressed either as adjusted average ± SE or as slope and (95% confidence interval [CI]). Post hoc pairwise comparisons were performed using the method of Scheffe. The association between bone outcomes and time since MHT discontinuation was modeled by nonlinear regression to identify possible hinges in the relationship. For each bone parameter, the hinge and the slopes before and after the hinge (when present) were estimated and their 95% CIs were assessed by bootstrap with 100 replications. Statistical significance was considered for a bivariate test with a P value < .05.
Results
Of the 1279 women included in the analysis, 282 (22%) were CU, 380 (30%) were PU, and 617 (48%) were NU. The vast majority of participants were of Caucasian ethnicity (1256/1279, 98.2%). Their baseline characteristics according to MHT group are shown in Table 1. PU group members were significantly older, had a higher prevalence of fractures, took calcium and vitamin D supplements more frequently, and had a higher 10-year fracture risk. The latter was no longer present after adjustment for age. No differences were found for BMI and dietary intake of calcium. There was a significant difference regarding plasma 25-hydroxyvitamin D levels (CU>PU>NU), which nonetheless remained slight with an average difference of 5.5 nmol/liter between CU and NU.
Baseline Characteristics of Participants According to MHT Status
| Never (n = 617) | Past (n = 380) | Current (n = 282) | P Value | |
|---|---|---|---|---|
| Age (y) | 62.1 ± 8.0 | 67.4 ± 6.2 | 64.0 ± 6.8 | <.001 |
| BMI (kg/m2) | 25.9 ± 4.5 | 26.0 ± 4.2 | 25.3 ± 4.0 | .084 |
| Fractures (%) | ||||
| VFA | 32 (5.2) | 30 (7.9) | 6 (2.1) | .005 |
| All fragility | 94 (15.2) | 89 (23.4) | 39 (13.8) | .001 |
| Major osteoporotic | 69 (11.2) | 58 (15.3) | 17 (6.0) | .001 |
| Calcium intake | ||||
| Diet (mg) | 954 ± 524 | 982 ± 506 | 1038 ± 571 | .102 |
| Supplements (%) | 215 (34.9) | 212 (55.8) | 105 (37.2) | <.001 |
| Plasma 25-hydroxyvitamin D (nmol/liter) | 51.1 ± 22.5 | 55.7 ± 23.1 | 56.6 ± 24.7 | .002 |
| FRAX , 10-y risk | 11.2 ± 7.1 | 13.4 ± 7.5 | 10.5 ± 5.6 | <.001 |
Results are expressed as number of participants (percentage) or as average ± standard deviation. Between groups analysis was performed by χ2 or analysis of variance.
The results for the primary bone outcomes according to MHT group, both unadjusted and after adjustment for age and BMI are shown in Table 2. CU group members had consistently higher values of TBS and BMD at all sites compared with NU and PU members in both unadjusted and adjusted models. After adjustment for age and BMI, PU members showed higher lumbar spine and total hip BMD than NU members (P = .017 and P = .026, respectively). A trend in favor of PU vs NU was noted for TBS values (P = .066).
BMD and TBS of the Sample According to MHT Status
| Never (n = 617) | Past (n = 380) | Current (n = 282) | |
|---|---|---|---|
| Unadjusted | |||
| BMD lumbar spine | 0.91 ± 0.15a | 0.94 ± 0.17b | 0.98 ± 0.15c |
| TBS lumbar spine | 1.28 ± 0.10a | 1.27 ± 0.10a | 1.31 ± 0.10b |
| BMD femoral neck | 0.73 ± 0.11a | 0.73 ± 0.10a | 0.76 ± 0.11b |
| BMD total hip | 0.85 ± 0.12a | 0.85 ± 0.11a | 0.89 ± 0.11b |
| Age- and BMI-adjusted | |||
| BMD lumbar spine | 0.91 ± 0.01a | 0.94 ± 0.01b | 0.98 ± 0.01c |
| TBS lumbar spine | 1.27 ± 0.01a | 1.29 ± 0.01a | 1.31 ± 0.01b |
| BMD femoral neck | 0.72 ± 0.01a | 0.73 ± 0.01a | 0.76 ± 0.01b |
| BMD total hip | 0.84 ± 0.01a | 0.86 ± 0.01b | 0.89 ± 0.01c |
Results are expressed as adjusted mean ± SE. Between-group analysis was performed using ANOVA. Post-hoc pairwise comparisons using the method of Scheffe.
Values with superscripts are significantly different at P < .05 for pairwise comparisons (a vs b, b vs c).
The effect of MHT was also assessed by a multivariate analysis with age as an independent variable (Table 3). The adjusted slopes for 10-year increments showed a decrease of all-sites BMD and TBS loss according to MHT status: CU<PU<NU (P < .05 for trend). Figure 1 provides a graphic representation of BMI-adjusted slopes for association of BMD and TBS with age, according to MHT group. CU group members exhibited significantly less steep slopes for loss of TBS as well as BMD at all sites. BMI-adjusted slopes for PU were significantly less steep than those for NU, with the exception of the BMD at femoral neck.
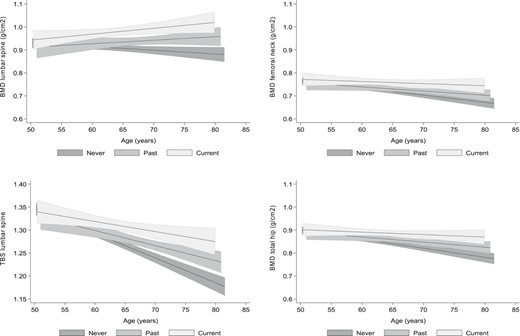
Graphic representation of the BMI-adjusted association and corresponding 95% CI of BMD and TBS with age, according to the menopausal HT group: CU (light gray), PU (medium gray), and NU (dark gray).
Multivariate Analysis of Bone Parameters According to MHT Status With Age as an Independent Variable
| Never (n = 617) | Past (n = 380) | Current (n = 282) | P Value for Parallelism | |||
|---|---|---|---|---|---|---|
| All | Current vs Never | Past vs Never | ||||
| BMD LS | ||||||
| Bivariate | −0.016 (−0.031; −0.001) | 0.015 (−0.013; 0.043) | 0.026 (−0.001; 0.052) | .013 | .009 | .042 |
| BMI-adjusted | −0.026 (−0.040; −0.011) | 0.014 (−0.013; 0.041) | 0.025 (−0.001; 0.050) | <.001 | .001 | .008 |
| TBS LS | ||||||
| Bivariate | −0.054 (−0.063; −0.045) | −0.033 (−0.048; −0.017) | −0.022 (−0.039; −0.005) | .002 | .001 | .024 |
| BMI-adjusted | −0.051 (−0.060; −0.041) | −0.032 (−0.048; −0.017) | −0.022 (−0.038; −0.005) | .005 | .003 | .048 |
| BMD FN | ||||||
| Bivariate | −0.031 (−0.042; −0.020) | −0.018 (−0.035; −0.001) | −0.009 (−0.028; 0.010) | .099 | .044 | .212 |
| BMI-adjusted | −0.038 (−0.048; −0.028) | −0.019 (−0.035; −0.002) | −0.010 (−0.027; 0.008) | .011 | .006 | .055 |
| BMD TH | ||||||
| Bivariate | −0.039 (−0.051; −0.028) | −0.022 (−0.041; −0.004) | −0.011 (−0.029; 0.008) | .025 | .011 | .115 |
| BMI-adjusted | −0.048 (−0.059; −0.038) | −0.023 (−0.040; −0.006) | −0.011 (−0.028; 0.007) | <.001 | <.001 | .012 |
Results are expressed as adjusted slope (95% CI) for a 10-y increment. Statistical analysis by ANOVA.
Abbreviations: FN, femoral neck; LS, lumbar spine; TH, total hip.
Table 4 shows the bone parameters according to MHT duration and time since MHT withdrawal. No association was found between MHT duration and bone outcomes in the combined CU+PU group. In the PU group, all BMD and TBS values were significantly higher when the time since discontinuation was less than 2 years compared with more than 5 years. A multivariate regression analysis using time since MHT discontinuation as a continuous variable led to similar conclusions, whereas a hinge analysis (Table 5) allowed the identification of an inflection point between 2 and 4 years since MHT discontinuation, beyond which the benefit of MHT on bone outcomes has disappeared. No statistically significant difference was noted between the different bone outcomes (TBS, BMD at different sites) in terms of inflection points.
Bone Parameters According to Duration of MHT and Time Since Withdrawal
| BMD Lumbar Spine | TBS Lumbar Spine | BMD Femoral Neck | BMD Total Hip | |
|---|---|---|---|---|
| Duration of MHT (y), n = 644 | ||||
| 0–2 | 0.92 ± 0.02 | 1.27 ± 0.01 | 0.73 ± 0.01 | 0.85 ± 0.01 |
| 2–5 | 0.95 ± 0.02 | 1.28 ± 0.01 | 0.73 ± 0.01 | 0.87 ± 0.01 |
| 5+ | 0.94 ± 0.01 | 1.28 ± 0.01 | 0.72 ± 0.01 | 0.85 ± 0.01 |
| P value | .485 | .640 | .672 | .326 |
| P value for trend | .379 | .679 | .506 | .823 |
| Time since withdrawal (y), n = 357 | ||||
| 0–2 | 1.02 ± 0.03a | 1.33 ± 0.02a | 0.77 ± 0.02a | 0.90 ± 0.02a |
| 2–5 | 0.93 ± 0.02b | 1.28 ± 0.01a,b | 0.71 ± 0.01b | 0.85 ± 0.01a, b |
| 5+ | 0.93 ± 0.01b | 1.27 ± 0.01b | 0.72 ± 0.01b | 0.85 ± 0.01b |
| P value | .007 | .002 | .007 | .009 |
| P value for trend | .003 | <.001 | .005 | .002 |
Results are expressed as adjusted mean ± SE. Information on duration of MHT was available for the majority of current (CU, n = 278) and past (PU, n = 366) MHT users, consisting a total of 644 participants. Information on time since MHT discontinuation was available for the majority (n = 357) of PU. Statistical analysis was performed using an ANOVA model including age, BMI, duration of MHT, and time since discontinuation. Post-hoc pairwise comparisons using the method of Scheffe.
Values with different superscripts are significantly different at P < 0.05 for pairwise comparisons (a vs b).
Piecewise Regression Between Bone Parameters and Time Since Discontinuation of MHT in Past Users of MHT
| BMD Lumbar Spine | TBS Lumbar Spine | BMD Femoral Neck | BMD Total Hip | |
|---|---|---|---|---|
| Unadjusted | ||||
| Hinge (y) | 3.486 (−1.540; 8.512) | 2.750 (0.612; 4.887)* | 2.250 (1.001; 3.499)*** | 2.405 (−0.171; 4.981) |
| Slope before hinge | −0.033 (−0.094; 0.028) | −0.032 (−0.060; −0.003)* | −0.061 (−0.135; 0.014) | −0.051 (−0.126; 0.024) |
| Slope after hinge | 0.001 (−0.003; 0.005) | −0.002 (−0.004; 0.000)* | 0.001 (−0.0004; 0.003) | 0.000 (−0.002; 0.002) |
| Multivariate-adjusteda | ||||
| Hinge (years) | 3.468 (0.324; 6.613)* | 2.750 (0.071; 5.429)* | 2.282 (1.007; 3.557)*** | 3.804 (1.628; 5.980)*** |
| Slope before hinge | −0.032 (−0.089; 0.025) | −0.028 (−0.057; 0.001) | −0.054 (−0.113; 0.005) | −0.022 (−0.082; 0.037) |
| Slope after hinge | 0.002 (−0.002; 0.006) | 0.001 (−0.001; 0.003) | 0.001 (−0.0004; 0.003) | 0.002 (0.000; 0.003) |
The analysis was conducted on past users of MHT, for which information on time since MHT discontinuation was available (n = 357). Nonlinear regression performed on the residuals following multivariate linear regression of the different bone parameters on age, BMI, and duration of MHT.
P < .05.
P < .01.
P < .001.
Adjusted on age, BMI, and duration of MHT.
Discussion
To maximize antifracture efficacy, agents against osteoporosis should ideally have an effect on both bone mass and bone microarchitecture. TBS has emerged as a noninvasive, easily acquired and reliable indirect indicator of bone microarchitecture, providing an additional surrogate marker for fracture risk assessment (4). The effect of antiosteoporotic drugs on TBS has been shown to be smaller in magnitude than the one on BMD (4, 24). In a substudy of the randomized Tamoxifen Exemestane Adjuvant Multicentre trial, Kalder et al explored the effect of exemestane and tamoxifen on BMD and TBS in postmenopausal women with hormone-sensitive breast cancer (25). After 2 years, TBS increased by 3.3% in the tamoxifen group compared to a decrease of 2.3% in the exemestane group. The positive impact of tamoxifen on TBS could suggest a potential advantage related with its estrogenic agonist properties.
This cross-sectional analysis of the OsteoLaus cohort demonstrates for the first time that MHT is associated with higher levels of TBS. CU group members presented significantly higher TBS values than in NU and PU members. After adjustment for age and BMI, a trend for higher TBS values in PU vs NU was observed. In the multivariate analysis, slopes for 10-year increments were significantly less steep in both CU and PU, indicating that MHT slows down the age-associated loss of TBS. Interestingly, the slopes for age-associated decline in TBS were significantly more pronounced than those in spine BMD, a finding which was attributed to TBS being less influenced by age-induced osteoarthritic changes (4), which falsely elevate spine BMD.
The only clinical study that has analyzed the effect of MHT on bone microarchitecture is the Kronos Early Estrogen Prevention Study (26). In a subset of this trial (MHT n = 45 vs placebo n = 30), bone microarchitecture was assessed by high-resolution peripheral quantitative computed tomography at the distal radius. After 4 years of follow-up, MHT prevented the decrease of cortical volumetric BMD as well as the increase of cortical porosity at distal radius. Nevertheless, the degradation of trabecular microarchitecture at the distal radius was not halted by MHT. No trabecular assessment of the lumbar spine was performed in the Kronos study, thus not allowing for a direct comparison with our data. It is possible that the beneficial effect of MHT on trabecular bone is not identical at all skeletal sites.
Our results confirm that current MHT use is associated with higher BMD values at all relevant sites, a finding consistent with previous randomized trials as well as a meta-analysis (27). The Postmenopausal Estrogen/Progestin Intervention trial investigated the effect of MHT in women in the early menopausal phase. After 3 years, those assigned to MHT regimens had an average gain of 5.1% and 2.4% at spine and total hip BMD, respectively, compared to a loss of 2.8% and 2.2% in the placebo group (28). In the relatively older population of the WHI trial (29), after 3 years of follow-up, the percentage difference in favor of the MHT group was 4.5% and 3.6% for BMD at lumbar spine and total hip, respectively. MHT was effective despite the absence of osteoporosis at baseline (mean T-scores: –1.3 at lumbar spine, –0.94 at total hip).
If the beneficial effect of MHT on BMD is well-established, this is not the case for the BMD preservation after its withdrawal. Our data argue in favor of a partially persistent effect in PU group members, who showed higher BMD values in the age-adjusted analysis as well as a less rapid decrease of age-associated BMD loss at lumbar spine and total hip compared to NU. Further analysis confirmed that time since MHT withdrawal is a crucial factor, with early discontinuers (<2 years) presenting with significantly higher BMD levels than the late ones (>5 years). The inflection point, beyond which the BMD benefit disappears, is estimated between 2 and 4 years.
Conflicting data exist about an eventual rebound effect after MHT withdrawal resulting in rapid loss of the previously acquired benefit. Several nonrandomized studies (30–32) did not find any accelerated bone loss after MHT discontinuation. In the Prospective Epidemiologic Risk Factor study (30), the dosage of bone remodeling markers did not show increased bone resorption following MHT withdrawal. However, in a randomized placebo-controlled trial, Greenspal et al (33) revealed significant loss of BMD (4.5%, 2.4%, and 1.8% at lumbar spine, femoral neck, and total hip, respectively) 1 year after estrogen withdrawal in comparison to alendronate discontinuation in 425 hysterectomized women previously treated with these agents vs placebo for 2 years. The loss of BMD observed in the estrogen group was associated with an increase of bone resorption markers. Similar results were described in other trials of recently menopaused (34, 35) or older women (36). In the latter study, there were no significant BMD differences between PU and placebo group already 2 years after estrogen withdrawal.
Possible explanations for these divergent results can be hypothesized. In the Prospective Epidemiologic Risk Factor trial, the authors reported heterogeneous rates of bone loss with faster decrease of BMD in women with lower BMI. Trémollieres et al (35) also detected large variations among MHT withdrawers. The rate of bone loss correlated with age and vertebral BMD at the time of MHT cessation but not with BMI. Differences regarding MHT type and dose between different studies as well as the nonassessment of 25-hydroxyvitamin D status in some trials constitute additional factors possibly contributing to the contradictory results. Because of our large sample covering the whole age spectrum of postmenopausal women, we consider our results to be less dependent on individual variables, thus being reliable for generalization to clinical practice. In our cohort, the mean BMI was in the slightly overweight range without differences between groups. Plasma 25-hydroxyvitamin D levels differed slightly but remained higher than 50 nmol/liter (= 20 μg/liter) in all groups. Relatively high BMI and adequate plasma 25-hydroxyvitamin D levels may have lessened excessive bone resorption post MHT withdrawal, in contrast to other studies.
Another interesting point is the between-sites discrepancy with absence of residual effect on femoral neck, whose content is rich in cortical bone. This finding has not been reproduced in previous studies and should be considered cautiously until further evaluation, given that estrogen-deprivation states have been preferentially linked to loss of trabecular bone.
BMD and TBS are surrogate markers of osteoporotic fracture risk. Consequently, given our results in favor of a residual effect in PU, we would expect decreased fracture incidence in this group in comparison with NU. The recently published National Institute for Health and Care Excellence guidelines (37) on the effect of MHT recency and duration on fracture incidence support this hypothesis. Indeed, after an exhaustive meta-analysis and based mostly on observational trials, the authors concluded that bone benefits of MHT seem to persist after its withdrawal; however, they have vanished by 5 years since MHT discontinuation. Data derived from randomized controlled trials showed no effect of MHT duration on fracture risk, whereas some observational studies suggested additional benefits only for MHT duration longer than 10 years.
In agreement with these conclusions, we did not detect any BMD differences according to MHT duration in the combined CU+PU group. The most plausible explanation is the accelerated gain of bone density at all sites during the first 2 years of treatment, seen with MHT (29) and also described for other antiresorptives. The increase of bone density slows down during the next years of treatment with a subsequent flattening of the changes, constituting the overall duration of MHT a less decisive factor on bone outcomes.
Our study has several limitations. First, the beginning and the end of MHT were self-reported. Second, for the same reason, we could not reliably distinguish the different routes of administration of MHT (oral, transdermal, vaginal) or the type of MHT (estrogen-alone or estrogen/progestin). Third, we could not determine the dose of estrogen per participant, which can be important given the potentially dose-dependent effects on bone outcomes. On the other hand, our study has many strong points to be taken into account. The large sample of the OsteoLaus cohort allows for adequate statistical power to detect differences between groups. Another strength is the quality of the data collected in the CoLaus and OsteoLaus cohorts. Radiological tests were performed in high quality and with standardized devices allowing for accurate measurement of BMD and TBS.
In conclusion, we report here for the first time that MHT is associated with better preservation of bone microarchitecture, as assessed by TBS. In addition to the well-established positive effect of MHT on BMD, the bone microarchitecture preservation probably contributes to the antifracture efficacy. The protective effect of MHT on BMD and TBS seems to persist after its withdrawal for at least 2 years. Given the renewed interest in MHT, our results provide encouraging informations for the impact of this treatment and its withdrawal on bone health.
Acknowledgments
Disclosure Summary: Didier Hans is co-owner of the TBS patent and has corresponding ownership shares. The corresponding author ensures that none of the other authors has any conflicts of interest.
Abbreviations
- BMD
bone mineral density
- BMI
mass body index
- CI
confidence interval
- CU
current user
- DXA
dual X-ray absorptiometry
- MHT
menopausal hormone therapy
- NU
never user
- PU
past user
- TBS
trabecular bone score
- VFA
vertebral fracture assessment
- WHI
Women’s Health Initiative.
