


Women are at increased risk for mood disturbance during the menopause transition. Hot flashes (HFs), sleep disruption, and fluctuating estradiol levels correlate with menopause-associated depression but co-occur, making cause and effect relationships difficult to disentangle.
Using a GnRH agonist (GnRHa) experimental model, we investigated whether depressive symptoms are associated with HFs and/or are explained by concomitant sleep fragmentation in the absence of estradiol fluctuation.
Depressive symptoms, objective polysomnographic sleep parameters, subjective sleep quality, serum estradiol, and HFs were assessed before and 4 weeks after open-label depot GnRHa (leuprolide 3.75-mg) administration.
Academic medical center.
Twenty-nine healthy nondepressed premenopausal volunteers (mean age, 27.3 years).
Serum estradiol was rapidly and uniformly suppressed. HFs developed in 69% of the subjects. On univariate analysis, worsening of mood was predicted by increases in time in light sleep (stage N1), number of transitions to wake, non-REM arousals, subjective sleep quality, and reductions in perceived sleep efficiency (all P < .045), as well as the number of nighttime (P = .006), but not daytime (P = .28), HFs reported. In adjusted models, the number of nighttime HFs reported, increases in non-REM arousals, time in stage N1, transitions to wake, and reduced sleep quality remained significant predictors of mood deterioration (P ≤ .05).
Depressive symptoms emerged after estradiol withdrawal in association with objectively and subjectively measured sleep disturbance and the number of nighttime, but not daytime, HFs reported. Results suggest that sleep disruption and perceived nighttime HFs both contribute to vulnerability to menopause-associated depressive symptoms in hypoestrogenic women.
Women are at increased risk for developing both major depressive episodes and, more commonly, subsyndromal depressive symptoms during the perimenopause (or menopause transition), early postmenopause (1, 2), and immediately after bilateral oophorectomy (3). Depressive symptoms increase when estradiol levels change markedly in association with both natural and surgical menopause. During the menopause transition, greater variability in serum estradiol is associated with an increased likelihood of depressive symptoms (4). This association suggests that central nervous system effects of estradiol may influence mood because of interactions with neurotransmitter and intracellular mechanisms that regulate affect. However, withdrawal of and variability in estradiol are likely not the only menopause-specific factors underlying susceptibility to mood disturbance. The risk of subsyndromal depressive symptoms remains elevated when estradiol levels are static and stably low in the late menopause transition, early postmenopause (5, 6), and after oophorectomy (3).
Hot flashes (HFs) are the hallmark symptom of menopause, occurring in up to 80% of women (7). They are also the primary symptomatic response to bilateral oophorectomy. These episodic events occur during the daytime and also at night, when they disrupt sleep (8). Multiple studies have demonstrated that HFs are associated with a greater likelihood of depressive symptoms (4, 9–14). When HFs precede and/or co-occur with the onset of depressive symptoms (14), the association has been variably attributed to: 1) sleep disruption; 2) moodiness related to daytime discomfort; and 3) a shared central nervous system mechanism among those who are susceptible.
Sleep disturbance is strongly linked with depressive symptoms during the menopause transition (13, 15), but it is less clear whether sleep disturbance is a constituent symptom of depression or a predisposing factor (16). In addition, the independent contributions of sleep disturbance and HFs have not been disentangled in women with both symptoms. Available studies examining the contribution of HFs and sleep disturbance to depression have generally used infrequent assessments of HFs and mood and have not separated daytime from nighttime HFs, limiting their ability to isolate menopause-related factors from each other and dissect mechanistic pathways underlying these commonly co-occurring symptoms. It is important to understand the impact of sleep and HFs on natural and surgical menopause-associated mood disturbance to assist clinicians in prioritizing which specific symptom should be prioritized when treating mood disturbance in these women.
In the current study, we used the GnRH agonist (GnRHa) leuprolide in healthy premenopausal women to dissect the specific impact of nighttime HFs from sleep disturbance and daytime HFs on mood. This model has been used previously to demonstrate the impact of ovarian suppression on menopause- and menstrual-related mood disturbance (17, 18), but not to examine the contribution of HFs and sleep to depressive symptoms. The GnRHa model provides a valuable experimental approach to isolate the specific effect of these factors because HFs are induced rapidly and occur at variable frequency in two-thirds of women (19–23), permitting measurement of within-subject changes in sleep patterns and mood in the temporal relation to the onset of HFs (8). Because ovarian suppression is uniformly induced and sustained, the impact of HFs and sleep on mood can be examined in the absence of estradiol fluctuations. We hypothesized that sleep disruption would explain changes in mood seen in women experiencing new-onset HFs, but that neither nighttime nor daytime HFs would contribute to the emergence of depressive symptoms.
Subjects and Methods
Twenty-nine healthy premenopausal women who were 18–45 years old and had no HFs, sleep disorders, or psychiatric illnesses were enrolled in this experimental protocol. All received one open-label dose of leuprolide to rapidly induce hypoestrogenism and maintain ovarian suppression for the study period (19, 24). Depressive symptoms were measured before and 4 weeks after GnRHa administration, concurrent with ambulatory polysomnographic studies, and after continuous monitoring of subjective HFs and sleep patterns. All subjects provided written informed consent for study procedures, which were approved by the Partners HealthCare Institutional Review Board and conducted at Massachusetts General Hospital.
Study subjects
Subjects were screened to select healthy 18- to 45-year-old women with regular menstrual cycles, evidence of ovulatory cycles (midluteal serum progesterone > 3 ng/mL), and no HFs. Those with primary sleep disorders were excluded by routine screening polysomnography (PSG). The clinician-rated Montgomery-Åsberg Depression Rating Scale (MADRS) (25, 26) was used to exclude women with significant depressive symptoms (MADRS ≥ 10) at baseline. Other psychiatric exclusion criteria (current and previous major depressive disorder, bipolar disorder, psychosis, anorexia nervosa, substance-use disorders, and suicide attempts) were determined using the Mini-International Neuropsychiatric Interview. Medical exclusions were pregnancy, lactation, abnormal laboratory studies, and use of systemic hormones, antidepressants, and other medications that are centrally active or known to suppress HFs. Mood symptoms occurring premenstrually, postpartum, or on hormonal birth control were reported.
Procedures
After completing the screening procedures, baseline mood (MADRS and Beck Depression Inventory [BDI]), sleep (sleep diary, questionnaires, two ambulatory PSG studies), and reproductive hormone levels were obtained before one dose of im leuprolide 3.75-mg/d was administered in the midluteal phase. Serum estradiol, LH, and FSH were measured to confirm ovarian suppression. After GnRHa administration, subjects reported the number of HFs experienced twice each day using daily diaries, in the morning to reflect the night and in the evening to reflect the daytime.
Four weeks after GnRHa administration, depressive symptoms were reassessed using the MADRS and BDI, as were sleep parameters using two ambulatory PSG studies. Physiological HFs were recorded objectively during the post-GnRHa PSG studies using the Bahr skin-conductance monitor (Simplex Scientific) (27).
Sleep measures
Ambulatory PSG studies (Safiro; Compumedics Limited) were obtained using electroencephalography (EEG; C3-A2, C4-A1, O1-A2 O2-A1), bilateral electro-oculography, and submental electromyography, as previously described (8). Standard American Academy of Sleep Medicine (AASM) scoring methods were used to define the amount of time spent in each sleep stage, including light sleep (stages N1 and N2), deep sleep (stage N3), and rapid eye movement (REM) (28). Awakenings were defined as alpha EEG, movement, or eye blinking comprising > 15 seconds of a 30-second epoch. Arousals (total, during REM, and non-REM) were defined as an abrupt increase in EEG frequency, not meeting spindle criteria, lasting 3–15 seconds. Lights-out and lights-on times were recorded using event markers on time-synched actigraphic watches.
Using manually scored 30-second epochs, sleep stages were processed via custom MATLAB scripts to extract the start and stop times of each sleep stage bout to determine the number of transitions to stage N1 and to wake. A stage transition refers to entry into a bout of that stage, such that if a subject had 10 transitions to stage N1 in one night, it means that we observed 10 episodes of stage N1 sleep lasting ≥ 30 seconds.
Subjective sleep measures included sleep diaries (measuring bedtime, final wake-up time, time to fall asleep, number of awakenings, wake time after sleep onset [WASO]) obtained throughout the study, as well as the Pittsburgh Sleep Quality Index (PSQI; range, 0–21), which was administered before and 4 weeks after treatment (29).
Hormone assays
Before GnRHa administration and 1, 2, and 4 weeks afterward, estradiol was measured using liquid chromatography, tandem mass spectrometry (Mayo Clinic) (30, 31). The interassay coefficient of variation for estradiol in this range is 8.6% (30). Serum LH and FSH methods and coefficient of variation were measured as reported previously (8).
Analysis
The primary outcome was within-subject change in depressive symptoms from pre-GnRHa to 4-week post-GnRHa levels, using the MADRS (range, 0–60; the higher score being worse). The primary HF predictors (subjectively reported nighttime and daytime HFs) and all sleep parameters were modeled continuously. The total number of nighttime and daytime HFs reported to occur on GnRHa through the second post-treatment PSG study was calculated as a daily average. Parallel analyses were conducted using the average number of HFs recorded objectively during the two post-GnRHa PSG studies. All analyses were repeated after excluding the sleep item on the MADRS score and separately, using the BDI score, as dependent measures.
Objective and subjective sleep parameters were modeled as change from baseline to the post-treatment assessment. For each PSG-defined parameter (number of awakenings, WASO, sleep efficiency, sleep-onset latency, percentage time in each sleep stage, arousals, and number of transitions per hour to wake or stage N1), results of the two pre-GnRHa PSG studies were averaged, as were results of the two post-GnRHa PSG studies, to calculate within-subject change from baseline. A similar approach was used for sleep diary measures (number of awakenings, WASO, sleep efficiency, sleep-onset latency), with baseline and 4-week follow-up measures calculated as daily averages from that 7-day diary.
Linear regression models were used to examine the association of HF frequency and each sleep parameter on changes in depressive symptoms. Univariate models were built using within-subject change in MADRS scores as the dependent measure and HFs (night or day) and each sleep parameter as the independent measure. Bivariate linear models were constructed by adding each sleep parameter associated with change in depressive symptoms (P < .10 threshold) to a model with HFs (night or day) if HFs were significantly associated with change in depressive symptoms. Beta coefficients and corresponding 95% confidence intervals (CIs) were estimated for each predictor. Similar approaches were used to model the MADRS score after eliminating the sleep item as well as the BDI score as dependent measures and to substitute the number of objectively measured nighttime HFs for the subjective HF count. Variables were transformed using winsorization if Cook’s D values for a model exceeded 1 to reduce the impact of extreme values on model estimates (32).
Results
Subjects
Table 1 shows baseline characteristics for the 29 study subjects who were 27.3 ± 7.2 years old, predominately Caucasian, never married, employed, and college graduates. Premenstrual mood changes were reported by 52%, hormonal contraceptive-associated mood disturbance by 22%, and postpartum depression by one of four women who had children. By design, subjects had minimal mood symptoms at baseline, reflected by a mean pretreatment MADRS score of 1.0 (SD, 1.1) and a mean pretreatment BDI score of 0.9 (SD, 1.5). PSG studies and perceived sleep quality measures revealed normal sleep at baseline (Table 2).
Baseline Demographic Characteristics (n = 29)
| Mean ± SD or number (%) | |
|---|---|
| Age, y | 27.3 ± 7.2 (range, 18–44) |
| Race/ethnicity | |
| Caucasian | 19 (65.5) |
| African American | 7 (24.1) |
| Other | 3 (10.3) |
| Body mass index, kg/m2 | 25.4 ± 4.9 (range 18.4–34.9) |
| Current smoker | 3 (10.3) |
| Marital status | |
| Never married | 19 (65.5) |
| Married/partnered | 7 (24.1) |
| Divorced | 3 (10.3) |
| College graduate | 20 (70.0) |
| Full- or part-time employment | 19 (65.5) |
| Prior pregnancy | 6 (21.4) |
Polysomnography Parameters and Sleep Diary Measures at Baseline and Within-Subject Change After GnRHa (n = 29)
| Baseline Mean ± SD | Within-Subject Change | ||
|---|---|---|---|
| Mean ± SD | Range | ||
| Polysomnography parameters | |||
| Total sleep time, min | 413.3 ± 84.3 | −20.4 ± 70.0 | −148.5 to 123.0 |
| Sleep efficiency, % | 90.8 ± 5.2 | −0.02 ± 0.07 | −0.29 to 0.14 |
| Sleep-onset latency, min | 17.2 ± 14.6 | −0.49 ± 11.9 | −24.8 to 33.3 |
| Wake time after sleep onset, min | 21.2 ± 17.9 | 10.2 ± 27.7 | −22.8 to 140.3 |
| No. of awakenings | 16.2 ± 7.5 | 1.6 ± 6.3 | −8 to 14.5 |
| No. of arousals | 40.0 ± 11.3 | −2.7 ± 13.0 | −27 to 35.5 |
| No. of non-REM arousals | 29.0 ± 9.5 | −3.5 ± 11.1 | −24.5 to 36.5 |
| No. of REM arousals | 11.0 ± 6.3 | 0.79 ± 5.4 | −15.5 to 12 |
| Stage N1, % | 6.2 ± 2.9 | 1.4 ± 3.4 | −3.3 to 14.9 |
| Stage N2, % | 50.4 ± 7.3 | −2.1 ± 6.6 | −15.6 to 9.3 |
| Stage N3, % | 19.8 ± 7.4 | 0.9 ± 6.6 | −14.3 to 11.4 |
| Stage REM, % | 23.3 ± 4.7 | 0.2 ± 3.8 | −9.1 to 6.7 |
| No. of transitions per hour to | |||
| Wake | 2.8 ± 1.2 | 0.2 ± 0.9 | −2.2 to 2.0 |
| N1 sleep | 3.4 ± 1.2 | 0.6 ± 1.8 | −2.1 to 5.6 |
| Sleep diary and questionnaire measures | |||
| Sleep efficiency, %a | 97.0 ± 2.4 | −0.02 ± 0.07 | −0.32 to 0.04 |
| Sleep-onset latency, mina | 12.5 ± 13.5 | −1.5 ± 9.9 | −30.0 to 20.0 |
| WASO, mina | 1.0 ± 2.0 | 11.6 ± 29.4 | −5.0 to 150.0 |
| No. of awakenings per nighta | 0.4 ± 0.6 | 1.1 ± 1.6 | −1.0 to 5.0 |
| PSQI score | 2.1 ± 1.5 | 1.2 ± 2.6 | −3.0 to 13.0 |
Seven-day average from sleep diary.
Change in depressive symptoms
For the group overall, the mean MADRS score after 4 weeks on GnRHa was 4.1 (SD, 5.4). Only one subject (3%) had a post-GnRHa MADRS score > 15, suggesting clinically significant depression. MADRS scores increased by 3.1 ± 5.4 (P = .005) in the group overall. MADRS scores increased by ≥ 5 points from baseline in 24% of subjects and remained unchanged (±1 point) in 38%, reflecting between-subject variability in the impact of GnRHa on depressive symptoms. On average, the sleep item on the MADRS accounted for 27% of each person’s total MADRS score. Demographic characteristics, including a history of mood disturbance manifesting during the postpartum, premenstruum, and on contraceptive hormones, were not associated with depressive symptom emergence.
Impact of GnRHa on reproductive hormones
Expected changes in reproductive hormones were observed in all subjects. Serum estradiol was universally suppressed to postmenopausal levels (<20 pg/mL) by 2 weeks on GnRHa and sustained throughout the duration of the study, as reported previously (8). Changes in LH and FSH were consistent with an expected initial agonist effect followed by desensitization and suppression of gonadotropins.
Impact of ovarian suppression on HFs
Twenty (69%) subjects reported developing HFs, beginning after 11.1 ± 5.5 days on leuprolide. The median number of HFs reported was 3.8 (interquartile range [IQR], 2.1–7.5) each night and 3.6 (IQR, 2.3–16.8) each day. Although the numbers of nighttime and daytime HFs were correlated (rs = 0.74; P < .001), the proportion of HFs occurring during the night vs day varied, with some women reporting the majority during the daytime and others a disproportionate number at night. The median number of objectively measured HFs per night was 3 (IQR, 1.5–4.0).
Change in sleep parameters
Administration of GnRHa resulted in variability between women in the within-subject change in sleep parameters (Table 2), reflecting an adverse effect of the ovarian suppression on objective and subjective sleep parameters among some but not all study subjects. For example, after treatment, the within-subject change in PSG-defined WASO ranged from an additional 140.3 minutes to 22.8 fewer minutes spent awake. The number of subjectively reported nighttime HFs correlated with increases in sleep fragmentation on the PSG, indicated by the number of non-REM arousals and transitions per hour of sleep to wake and to stage N1 (all rs > 0.37; P ≤ .04).
Impact of sleep and HFs on depressive symptoms
Univariate analyses revealed that the number of nighttime HFs reported was associated with an increase in depressive symptoms proportionate to the number of nighttime HFs reported (P = .006) (Table 3 and Figure 1A), with an increase of 3.2 points (95% CI, 1.0–5.4) on the MADRS from before to after GnRHa for every additional nighttime HF reported. In contrast, the number of daytime HFs reported was not associated with a change in mood (P = .28) (Table 3 and Figure 1B), nor were objectively measured nighttime HFs (P = .11) or demographic characteristics. Results were consistent when parallel analyses were run using the MADRS subscore without the sleep item or the total BDI score as the dependent measure regardless of whether the HF predictor was reported subjectively at night (P = .02, P = .02), measured objectively at night (P = .09, P = .07), or subjectively during the daytime (P = .48, P = .44).
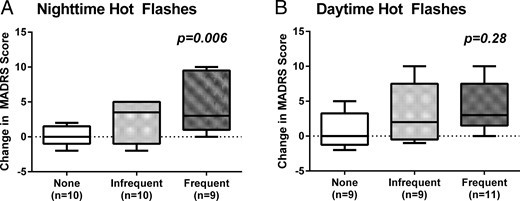
Box plots showing the increase in depressive symptoms from before to after GnRHa treatment as measured by within-subject change in MADRS score in relation to the number of subjectively reported nighttime (A) and daytime (B) HFs. Box plots show the distribution of the data within each group from the 25th to 75th percentile, with the median line and the whiskers representing the winsorized extreme values. Data are presented by HF frequency groupings for visual purposes using a median split to define those with more or less frequent symptoms at night and those with none (< five HFs during the entire follow-up period). P values reflect results from univariate linear regression models.
Unadjusted and Adjusted Regression Models Showing the Effect of Nighttime and Daytime HFs and Sleep Parameters on Worsening of Depressive Symptoms on the MADRS From Before to After Treatment With GnRHa
| Univariate Model | Bivariate Model | ||||||||
|---|---|---|---|---|---|---|---|---|---|
| Parameter Estimate | Sleep Parameter Estimate | Nighttime HF Estimate | |||||||
| β | 95% CI | P Value | β | 95% CI | P Value | β | 95% CI | P Value | |
| HFs | |||||||||
| No. reported per night | 3.2 | 1.0, 5.4 | .006 | N/A | N/A | ||||
| No. reported per day | 0.8 | −0.7, 2.3 | .28 | N/A | N/A | ||||
| Objective sleep measures | |||||||||
| Change in no. of awakenings | 0.2 | −0.1, 0.6 | .15 | N/A | |||||
| Change in WASO, min | 0.1 | −0.1, 0.2 | .30 | N/A | |||||
| Change in sleep efficiency | −21.9 | −42.8, −0.9 | .04 | −15.8 | −36.5, 5.0 | .13 | 2.0 | 0.001, 4.1 | .05 |
| Change in sleep-onset latency | 0.01 | −0.1, 0.2 | .62 | N/A | |||||
| Change in stage N1 | 0.7 | 0.1, 1.2 | .02 | 0.3 | 0.001, 0.7 | .05 | 2.4 | 0.1, 4.6 | .04 |
| Change in stage N2 | 0.01 | −0.3, 0.3 | .95 | N/A | N/A | ||||
| Change in stage N3 | −0.1 | −0.4, 0.2 | .46 | N/A | N/A | ||||
| Change in stage REM | −0.3 | −0.8, 0.3 | .29 | N/A | N/A | ||||
| Objective sleep fragmentation | |||||||||
| Change in no. of arousals | 0.1 | −0.03, 0.3 | .12 | N/A | N/A | ||||
| Change in no. of non-REM arousals | 0.2 | 0.1, 0.3 | .004 | 0.1 | 0.0, 0.2 | .03 | 2.2 | 0.01, 4.5 | .049 |
| Change in no. of REM arousals | −0.01 | −0.4, 0.4 | .94 | N/A | N/A | ||||
| Change in no. of transitions/hour to wake | 2.0 | 0.7, 3.3 | .004 | 1.5 | 0.10, 2.8 | .04 | 2.2 | −0.03, 4.5 | .05 |
| Change in no. of transitions/hour to N1 | 1.0 | −0.10, 2.1 | .08 | 0.4 | −0.3, 1.1 | .22 | 2.1 | −0.002, 4.2 | .05 |
| Subjective sleep measures | |||||||||
| Change in sleep efficiency | −44.9 | −84.4, −5.5 | .03 | −23.7 | −64.7, 17.3 | .24 | 2.8 | 0.3, 5.3 | .03 |
| Change in WASO, min | 0.10 | −0.01, 0.2 | .08 | 0.03 | −0.1, 0.1 | .52 | 3.1 | 0.6, 5.6 | .02 |
| Change in no. of awakenings | 0.6 | −0.3, 1.4 | .18 | N/A | N/A | ||||
| Change in sleep-onset latency | 0.1 | 0.003, 0.3 | .045 | 0.1 | −0.04, 0.2 | .15 | 3.0 | 0.7, 5.2 | .01 |
| Change in PSQI | 1.2 | 0.30, 2.1 | .01 | 1.1 | 0.2, 1.9 | .02 | 2.2 | 0.4, 4.1 | .02 |
Abbreviation: N/A, not available. Variables were selectively winsorized based on Cook’s D for individual univariate and multivariate models. All sleep variables reflect a within-subject change after GnRHa treatment (calculated as post-treatment minus pretreatment). For each univariate and bivariate model separately, variables were winsorized if one or more observations had a large (>1) Cook’s D value. Bivariate model columns show the estimate for each sleep parameter adjusted for nighttime HF frequency in the middle column and nighttime HF frequency estimate adjusted for the corresponding sleep parameter in the same row. Values in boldface font are P values <.05.
In univariate analyses, PSG measures associated (P < .10) with an increase in depressive symptoms on the MADRS (Table 3) included a reduction in sleep efficiency and an increase in stage N1 percentage, the number of arousals during non-REM sleep, and the rate of transitions to wake and to stage N1. Increased MADRS scores were also associated with subjective sleep measures of increased WASO time, sleep-onset latency, and PSQI scores and a reduction in sleep efficiency (Table 3; P < .10). Results were consistent in parallel analyses when the dependent measure was either change in the MADRS score without the sleep item or change in the BDI score. Both an increase in PSG-measured WASO and a decrease in PSG-measured sleep efficiency were associated with an increase in the MADRS score without the sleep item (P < .001) and the BDI (P ≤ .002), respectively.
In bivariate analyses (Table 3), the number of nighttime HFs reported remained significantly associated (P ≤ .05) with mood deterioration in models adjusted for changes in objectively measured sleep efficiency, the proportion of time spent in stage N1, the number of non-REM arousals, and the number of transitions per hour to wake or stage N1. Nighttime HF frequency similarly remained a significant predictor (P ≤ .03) of depressive symptom worsening after adjusting for changes in self-reported sleep efficiency, WASO time, sleep-onset latency, and PSQI scores. In contrast, after adjusting for nighttime HF frequency, only an increase in the proportion of time spent in stage N1 (Figure 2A; P = .05), number of non-REM arousals (Figure 2B; P = .03), change in the transition rate to wake (Figure 2C; P = .04), and worsening of PSQI scores (Figure 2D; P = .02) remained significant predictors of mood worsening. Objectively measured nighttime HFs and other sleep variables were no longer associated with changes in mood in bivariate models adjusting simultaneously for subjectively or objectively measured nighttime HFs and each of the sleep parameters. In parallel analyses adjusted for PSG-measured WASO or sleep efficiency, subjectively reported nighttime HFs remained associated with the change in the MADRS subscore without the sleep item (P = .048) and marginally associated with the change in the BDI score (P = .057).
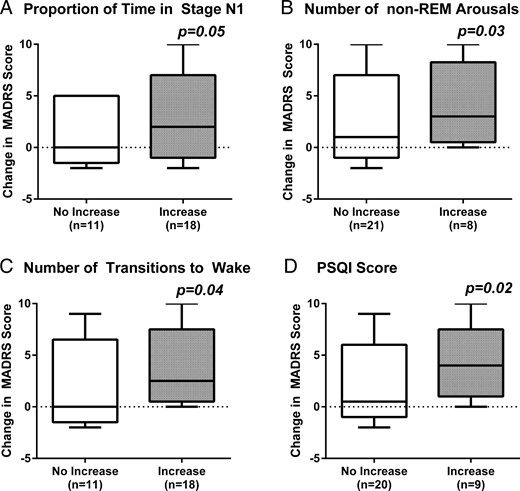
Box plots showing the increase in depressive symptoms from before to after GnRHa treatment as measured by within-subject change in MADRS score in relation to changes in the proportion of time spent in stage N1 (A), the number of non-REM arousals (B), the number of transitions to wake per hour (C), and sleep quality on the PSQI (D). P values reflect results from bivariate linear regression models, adjusting for nighttime HF frequency. Box plots show the distribution of the data within each group from the 25th to 75th percentile, with the median line and the whiskers representing the winsorized extreme values. Data are presented according to whether the PSG sleep parameter increased or did not increase after GnRHa therapy (A–C) and whether PSQI scores increased by ≥ 2 points or less after GnRHa therapy (D).
Discussion
Results of this experimental model show that mild depressive symptoms emerge in the context of estradiol withdrawal proportionate to the number of nighttime HFs that are subjectively perceived and to the extent of objective and perceived sleep disruption. These findings indicate that there is an independent association of perceived nighttime HFs with mood disturbance, suggesting that disturbed sleep does not fully explain the association of nighttime HFs with mood disturbance in women undergoing surgical or natural menopause. Results were consistent when the BDI was used to measure depressive symptoms and when the sleep item was removed from the MADRS score. Our results also indicate that the number of daytime HFs and the number of objectively detected nighttime HFs are not associated with depressive symptoms, suggesting that the perception of daytime symptoms and physiological changes accompanying nighttime HFs do not correlate with mood disturbance in these women. Taken together, these observations highlight the importance of both sleep disruption and perceived nighttime HFs in the emergence of affective symptoms in estrogen-deprived women.
Epidemiological studies show that subthreshold depressive symptoms are much more common than major depressive episodes during the menopause transition and early postmenopause (1, 2). The development of subthreshold depressive symptoms in a subgroup of women was observed in both our study and prior leuprolide studies (33), whereas clinically significant depressive symptoms were induced rarely (n = 1; 3%). Importantly, our findings indicate that specific menopause-related factors are associated with the emergence of depressive symptoms when ovarian steroids are suppressed, reflecting a heterogeneous effect of estradiol withdrawal on mood, similar to the variable response to estrogen withdrawal observed in both natural and surgical menopause (1).
We had hypothesized that sleep disruption alone would explain the widely observed association between HFs and mild mood disturbance in surgical and natural menopause (4, 10–12, 14). However, we observed a strong independent effect of subjectively reported nighttime HFs on the development of depressive symptoms. Because objectively measured nighttime HFs were not linked with mood changes, our data suggest that the extent of alertness and/or awakening for long enough to consciously experience and recall these nocturnal symptoms may be integral to this observation. For an objectively measured HF to be reported, an awakening must be long enough for memory to be consolidated. Because not all HFs are linked with an awakening and the duration of a wake episode occurring in association with a nocturnal HF varies widely (34), recall for nocturnal HFs is expected to vary. However, it is also plausible that nighttime HFs are linked with mood disturbance because those who develop depressive symptoms tend to be more likely to recall and report nighttime HFs. Because increases in sleep fragmentation and time spent in light sleep were independently associated with depressive symptoms, women whose sleep was more disrupted by ovarian suppression may have greater awareness of and memory for nighttime HFs. An alternate interpretation is that those with worsening of sleep may be more likely to attribute their sleep interruption to HF events. Mechanisms underlying the association between sleep disruption and mood disturbance are poorly understood but may involve perturbation of immune function (35), circadian temperature decline (36), or the sympathetic nervous system (37).
In contrast to the number of perceived nighttime HFs, we found that the number of daytime HFs reported was not linked with the emergence of depressive symptoms. To our knowledge, daytime and nighttime HFs have not been analyzed separately in prior studies of menopause-associated mood disturbance. Our study results may be reflected by the extent to which women with HFs are bothered by and seek treatment for associated sleep disturbance (38) and highlight the importance of distinguishing the time of day when HFs occur. Successful treatment of mild mood disturbances may rely less on improving daytime symptoms, whereas targeting nighttime HFs and sleep disturbance may be central to improving mood. Previous clinical trials have in fact shown that depressive symptoms in peri-/postmenopausal women are improved in concert with a reduction of insomnia and subjectively reported nighttime, but not daytime, HFs (39). In contrast, suppression of HFs does not correlate with mood improvement in the presence of a clinical depression disorder (40). Such studies, however, have not distinguished daytime from nighttime HFs. Moreover, HFs are strongly associated with subsyndromal depressive symptoms (4, 10–12, 14), whereas HFs are rarely linked with major depression episodes in midlife women (9).
Our experimental ovarian suppression approach has important advantages over a naturalistic study in several respects. Depressive symptoms, HFs, and sleep parameters are examined before and after GnRHa and within-person changes are calculated. Induced hypoestrogenism allows the impact of the commonly covarying symptoms of HFs and sleep disturbance on mood to be disentangled from that of fluctuating estradiol levels. Furthermore, confounding effects of age-related sleep changes are eliminated, permitting sleep changes related to estrogen withdrawal and HFs to be isolated. Perhaps because age-related sleep changes were not present, our study population had a better sleep profile than that observed in midlife women who also completed ambulatory PSG studies (41, 42). However, age-related sleep changes may compound the impact of HF-associated sleep fragmentation on mood, resulting in greater susceptibility to mood changes.
Although our model most closely mimics surgical menopause in young women undergoing a rapid and marked estrogen withdrawal and can be readily translated to women in the late menopause transition and early postmenopause who have recently become hypoestrogenic, generalizability to women in the menopause transition whose estradiol levels fluctuate widely and who become hypoestrogenic more gradually may be limited. It is important to note that this study is a model for menopause-associated subthreshold depressive symptoms rather than major depressive episodes, which is widely (1, 2), but not uniformly (43), linked with the menopause transition. In addition, the magnitude of change in MADRS scores was small because the study was designed to examine mechanistic pathways rather than to induce significant levels of depression. The extent of the mood changes we observed may have been stronger had women with a history of major depression been included (17).
The design advantage of this study stems from the quantification of within-person changes, but the study is limited by the small sample size typical of experimental studies. The winsorizing transformation of the endpoints used in the analysis limits the impact of outliers. Finally, this study was limited to the evaluation of short-term effects of ovarian suppression because of the increased risk of osteoporosis associated with repeated dosing of GnRHa.
In summary, this experimental investigation of estradiol suppression and induced HFs provides strong evidence indicating that the development of mild depressive symptoms varies in relation to both the number of perceived nighttime HFs and the amount of objective and subjective sleep disruption that develops. These results suggest that both sleep disruption and perceived nighttime HFs play a role in the generation of depressive symptoms related to surgical and natural menopause. Women reporting nighttime HFs and sleep interruption should be screened for mood disturbance, and treatment of those with menopause-related depressive symptoms should encompass therapies that improve sleep interruption as well as nocturnal HFs. Future study directions include a focused approach on women with histories of mood disorders to determine the impact of these findings on women at particular risk for menopause-related mood disturbance.
Acknowledgments
This work was supported by National Institute of Mental Health Grant 5R01MH082922 (to H.J.).
Clinical trial registration: Identifier NCT01116401. http://clinicaltrials.gov/ct2/show/NCT01116401.
Disclosure Summary: H.J., S.L.C., and L.S.C. receive grant support from the National Institutes of Health. H.J. receives grant support from Merck and serves as a consultant/advisor for Noven, Merck, Mitsubishi Tanabe, and NeRRe Therapeutics. M.P.F. receives grant support from Takeda and Jaymac Pharmaceuticals and a medical editing stipend from DSM Nutritionals and the GOED newsletter; consults for Takeda, Otsuka, Lundbeck, Genentech, JDS Therapeutics, Sage, and Sunovion; and serves on the Independent Data and Safety Committee for Janssen/Johnson and Johnson. D.P.W. is the Chief Medical Officer for Apnicure Inc. and consults for Philips Respironics and NightBalance. M.T.B. receives grant support from the Center for Integration of Medicine and Innovative Technology, the Department of Defense, the Milton Family Foundation, and the American Sleep Medicine Foundation; has a patent pending on a home sleep monitoring device; has received travel funding from Servier; serves on the advisory board of Foramis; consults for GrandRounds; and has provided expert testimony in sleep medicine. J.E.H. receives a stipend as a member of the American Board of Internal Medicine Writing Committee for Endocrinology and as Associate Editor for Endocrine Reviews and has investments in Marathon Pharmaceuticals. L.S.C. receives research support from Alkermes, Inc., AstraZeneca, Bristol-Myers Squibb/Otsuka, Ortho-McNeil Janssen, Sunovion Pharmaceuticals, Inc., Cephalon, Inc., and Takeda/Lundbeck and consults for Noven and JDS Therapeutics LLC. S.K., N.E., and J.C. have nothing to disclose.
Abbreviations
- BDI
Beck Depression Inventory
- CI
confidence interval
- EEG
electroencephalography
- GnRHa
GnRH agonist
- HF
hot flash
- IQR
interquartile range
- MADRS
Montgomery Åsberg Depression Rating Scale
- PSG
polysomnography
- PSQI
Pittsburgh Sleep Quality Index
- REM
rapid eye movement
- WASO
wake time after sleep onset.
References
Author notes
J.E.H. and L.S.C. contributed equally to this work.
