


Type 2 Wolfram syndrome (T2-WFS) is a neuronal and β-cell degenerative disorder caused by mutations in the CISD2 gene. The mechanisms underlying β-cell dysfunction in T2-WFS are not known, and treatments that effectively improve diabetes in this context are lacking.
Unraveling the mechanisms of β-cell dysfunction in T2-WFS and the effects of treatment with GLP-1 receptor agonist (GLP-1-RA).
A case report and in vitro mechanistic studies.
We treated an insulin-dependent T2-WFS patient with the GLP-1-RA exenatide for 9 weeks. An iv glucose/glucagon/arginine stimulation test was performed off-drug before and after intervention. We generated a cellular model of T2-WFS by shRNA knockdown of CISD2 (nutrient-deprivation autophagy factor-1 [NAF-1]) in rat insulinoma cells and studied the mechanisms of β-cell dysfunction and the effects of GLP-1-RA.
Treatment with exenatide resulted in a 70% reduction in daily insulin dose with improved glycemic control, as well as an off-drug 7-fold increase in maximal insulin secretion. NAF-1 repression in INS-1 cells decreased insulin content and glucose-stimulated insulin secretion, while maintaining the response to cAMP, and enhanced the accumulation of labile iron and reactive oxygen species in mitochondria. Remarkably, treatment with GLP-1-RA and/or the iron chelator deferiprone reversed these defects.
NAF-1 deficiency leads to mitochondrial labile iron accumulation and oxidative stress, which may contribute to β-cell dysfunction in T2-WFS. Treatment with GLP-1-RA and/or iron chelation improves mitochondrial function and restores β-cell function. Treatment with GLP-1-RA, probably aided by iron chelation, should be considered in WFS and other forms of diabetes associated with iron dysregulation.
Wolfram syndrome (WFS), also known as DIDMOAD (diabetes insipidus, diabetes mellitus, optic atrophy, and deafness), is a multisystem, neuronal, and β-cell degenerative disorder of autosomal recessive inheritance (1). The β-cell degeneration resulting from cellular stress and apoptosis leads to severe insulin deficiency mimicking type 1 diabetes.
Type 1 WFS results from mutations in the WFS1 gene, which encodes Wolframin, a transmembrane protein localized to the endoplasmic reticulum (ER); its deficiency induces ER stress and apoptosis (2). Type 2 WFS (T2-WFS; OMIM no. 604928) was originally described in a Jordanian descent and results from a single missense CISD2 (CDGSH iron-sulfur domain-containing protein 2) gene mutation that truncates 75% of the protein in affected patients (3). A novel homozygous intragenic deletion of CISD2 has been recently reported in an Italian girl presenting with diabetes mellitus, optic neuropathy, bleeding intestinal ulcers, and sensorineural hearing loss (4). T2-WFS is characterized by severe peptic ulcer disease and impairment in platelet aggregation that are uncommon in type 1 WFS. CISD2 encodes a small protein, NAF-1 (nutrient-deprivation autophagy factor-1), localized to the mitochondrial outer membrane and the ER (5). Cisd2 knockout mice exhibit muscle weakness along with distorted mitochondrial morphology, growth retardation, and premature aging with shortened lifespan (5, 6).
NAF-1 belongs to a conserved family of 2Fe-2S proteins called the NEET family. In man, three NEET members were identified: CISD1 (mitoNEET; mNT), CISD2 (NAF-1), and CISD3 (Miner 2) (7). These proteins contain a CDGSH iron-sulfur domain involved in 2Fe-2S cluster transfer to apo-acceptor proteins (8). NEET proteins have recently been shown to affect cellular iron management and reactive oxygen species (ROS) generation (9, 10). Suppression of NAF-1 in tumor cells resulted in uncontrolled mitochondrial accumulation of iron, increased generation of ROS, mitochondrial dysfunction, and reduced tumor growth (11). Suppression of mNT in adipose tissue induced oxidative stress and glucose intolerance, whereas adipocyte-specific overexpression of mNT reduced mitochondrial membrane potential and ROS damage (12).
Glucagon-like peptide 1 (GLP-1) is an incretin hormone secreted from the gut in response to a meal, amplifying insulin secretion (13). GLP-1-stimulated insulin secretion is mediated via increased generation of cAMP by adenylyl cyclase and consequently stimulation of protein kinase A and guanine nucleotide exchange factor pathways. The GLP-1 receptor is expressed in various tissues, including β-cells and neurons, and its activation has been shown to alleviate ER and oxidative stress (14, 15); however, the mechanisms involved are not well understood.
Based on these findings, we treated a patient with T2-WFS with the GLP-1 receptor agonist (GLP-1-RA) exenatide and found that this treatment markedly improved β-cell function. We further studied the mechanisms underlying β-cell dysfunction in T2-WFS and their modification by GLP-1-RA.
Subject and Methods
Subject and research outline
A 31-year-old woman of Palestinian origin was diagnosed with WFS based on hearing loss, optic atrophy, neurogenic bladder, and insulin-treated diabetes mellitus. Her medical history included peptic ulcers with recurrent episodes of upper gastrointestinal bleeding. Her diabetes, which debuted at age 24 years, required 45 U of insulin daily in multiple injections (0.6 U/kg/d). Sequencing of the CISD2 gene identified the homozygous IVS1+6G>C, p.E37Q mutation, previously described in T2-WFS (3); no mutations were found in the WFS1 gene. The patient had fluctuations of blood glucose with recurrent episodes of hypoglycemia. She was treated by sc injections of exenatide 5 μg twice daily for 4 weeks and then 10 μg twice daily for an additional 5 weeks. She was hospitalized before and after intervention, and β-cell function was assessed by iv glucose tolerance test (IVGTT) together with glucagon and arginine injection and mixed meal tests with and without injection of exenatide before the meal. The study protocol was approved by the Hadassah Helsinki Committee (clinical trial registration nos. HM-0438-10 and NCT01302327), and appropriate informed consent was obtained. We further performed in vitro studies testing the effects of NAF-1 knockdown in insulinoma β-cells and of treatment with exenatide on mitochondrial iron accumulation and function, oxidative stress and β-cell function.
In vivo studies
Dynamic tests
A standard meal test was performed to assess insulin and glucagon secretion. At time 0, the patient received a 500-kcal mixed meal, and blood was drawn at 0, 30, 60, 120, and 180 minutes for glucose, C-peptide, and glucagon. The acute response to exenatide was studied by repeating the test the next day with sc injection of 5 μg exenatide 60 minutes before a meal. β-Cell function was assessed by IVGTT together with glucagon and arginine injection. At time 0, glucose (0.3 g/kg) was injected within 1–2 minutes, and then 0.5 mg glucagon and 5 g arginine were added at 30 minutes. Blood samples were drawn for glucose and C-peptide at the following time points: 0, 1, 3, 5, 10, 20, 30, 45, and 60 minutes. The IVGTT/glucagon/arginine test was repeated after 9 weeks of exenatide treatment following a 4-day washout. The patient was treated with a continuous insulin infusion pump to achieve near-normoglycemia for 48 hours before testing, both before and after the intervention. Insulin infusion was discontinued 30 minutes before the test and renewed at the end of the test until the next day.
Hormone measurements
Serum samples were kept at −20°C until analysis. Serum C-peptide was analyzed using the ADVIA Centaur ELISA assay (Siemens Healthcare Diagnostics Inc.). The assay is standardized against World Health Organization IS84/510 and does not cross-react with proinsulin. The minimum detectable concentration was 17 pmol/L. Glucagon and GLP-1 measurements were performed in the Holst laboratory at the University of Copenhagen, Denmark. Frozen samples were shipped on dry ice and analyzed by glucagon RIA directed against the C terminus of the molecule.
In vitro studies
Materials
TMRE (tetramethylrhodamine, ethyl ester) was purchased from Molecular Probes. The red fluorescent mitochondrial metal sensor RPA (rhodamine B-[(1,10-phenanthroline-5-yl)-aminocarbonyl]benzyl ester) was from Squarix Biotechnology. Exendin-4, forskolin, IBMX (3-isobutyl-1-methylxanthine), and the adenylyl cyclase inhibitor ddA (2′,3′-dideoxyadenosine) were purchased from Sigma-Aldrich. Deferiprone (ferriprox; 1,2-dimethyl-3-hydroxypyridin-4-one; DFP) was obtained from Apo Pharma.
Cell culture
INS-1E β-cells were grown in RPMI 1640 with 11.1 mmol/L D-glucose supplemented with 10% heat-inactivated fetal bovine serum, 100 U/mL penicillin, 100 μg/mL streptomycin, 10 mmol/L HEPES, 2 mmol/L L-glutamine, 1 mmol/L sodium pyruvate, and 50 μmol/L β-mercaptoethanol. INS-1E-NAF-1 knockdown cell lines were generated using short hairpin RNA (shRNA) transfections as described previously (11) and maintained in the same medium as control cells. Puromycin (1 μg/mL) was added to the culture medium of INS-1E-NAF-1 knockdown and control cell lines to allow selective expansion of transfected cells. Cells were plated 1 day before experimentation onto 96-well plates in puromycin-free medium or onto microscope slides glued to perforated 3-cm-diameter tissue culture plates for cell viability or microscopic measurements.
Insulin secretion
Insulin secretion of shNAF-1 and control INS-1E β-cells was evaluated by static incubation. Cells were preincubated for 30 minutes in modified Krebs-Ringer bicarbonate buffer containing 20 mmol/L HEPES and 0.25% BSA at 1.7 mmol/L glucose and then consecutively incubated at 1.7 and 16.7 mmol/L glucose with or without 100 nmol/L exenatide, 0.5 mmol/L IBMX, 5 μmol/L forskolin, or 60 mmol/L KCl for 1 hour at 37°C. Medium was collected at the end of the basal (1.7 mmol/L glucose) and stimulatory incubations and centrifuged, and supernatants were frozen at −20°C pending insulin assay. Cells were then extracted and subjected to repeated freeze-thaw cycles in 1.5-mL microfuge tubes containing 0.1% BSA in glycine buffer supplemented with 0.5% NP-40. Insulin immunoreactivity in the extracts and medium was determined using a rat insulin ELISA Kit (Mercodia).
cAMP measurement
INS-1E cells were preincubated at 1.7 mmol/L glucose for 30 minutes, followed by incubation at 16.7 mmol/L glucose with and without 100 nmol/L exenatide, 0.5 mmol/L IBMX, or 5 μmol/L forskolin for 5 minutes. cAMP was measured in cell extracts using the cyclic AMP EIA Kit (Cayman Chemical) according to the manufacturer’s instructions.
Mitochondrial membrane potential (MMP) measurement
Control INS-1E cells transfected with plasmid containing scrambled RNA and NAF-1 knockdown cells were plated at a density of 600 000 per well in glass-bottomed Petri dishes. Cells were incubated with or without 100 nmol/L exenatide for 48 hours and then washed with DMEM-Hepes pH 7.3 for measurement of MMP with TMRE (excitation, 543 nm; emission, 633 nm). After incubation with TMRE for 15 minutes at 37°C, cells were washed with DMEM-Hepes pH 7.3 and analyzed by a Nikon TE 2000 microscope equipped with an opti-grid device and a Hamamatsu Orca-Era CCD camera. Images were acquired and analyzed with Velocity or Image-J software programs for image processing.
Mitochondrial labile iron measurement
Control and NAF-1 knockdown INS-1E cells were plated at a density of 600 000 per well in glass-bottomed Petri dishes. Cells were incubated with or without 100 nmol/L exenatide for 48 hours. The iron status in the mitochondria of these cells was evaluated using RPA (16). Cells were incubated with RPA (1 μmol/L) for 15 minutes at 37°C and then washed with DMEM-Hepes. Images were captured by epi-fluorescence microscopy (equipped with opti-grid device) and analyzed with the image-J software program. Cells were pretreated with the chelator DFP (50–100 μmol/L) to assess whether the mitochondrial labile iron accumulation can be abolished.
ROS formation assay
ROS formation was determined by incubating cells at 37°C with 10 μmol/L dihydroethidium, which displays blue fluorescence in cell cytoplasm, whereas its oxidized form (ethidium) is obtained by reaction with ROS. This turns the fluorescence to red, which can be analyzed microscopically (excitation, 518 nm; emission, 605 nm) (17). Pretreatment of cells with the chelator DFP (50–100 μmol/L) was performed at the indicated times.
Protein blots
Protein expression was studied by standard Western blotting using antibodies against NAF-1, mNT, and thioredoxin-interacting protein (TXNIP) (MBL International Co.), and glyceraldehyde-3-phosphate dehydrogenase (Abcam). Peroxidase-conjugated AffiniPure goat antirabbit and antimouse IgGs from Jackson ImmunoResearch Laboratories were used as secondary antibodies. Protein expression was calculated as the percentage of controls from three different experiments. Glyceraldehyde-3-phosphate dehydrogenase was used as a loading control.
Statistical analysis
Data shown are means ± SE. Statistical significance of differences between groups was determined by one-way ANOVA followed by Newman-Keuls test using the Prism 6.01 statistical program from GraphPad Software Inc. A paired-sample t test was used when the difference between a reference and a test was analyzed. A P value <.05 was considered significant.
Results
The patient was treated with exenatide for 9 weeks; this enabled the gradual reduction of the insulin dose by approximately 70%, with improved glycemic control, evident by fasting blood glucose in the range of 6.5–7.5 mmol/L, and a decrease in glycosylated hemoglobin from 6.2% before intervention to 5.0% thereafter along with a lower incidence of hypoglycemia.
β-Cell function was evaluated by IVGTT at baseline and after 9-week exenatide treatment followed by drug washout. Before intervention, basal and glucose/glucagon/arginine-stimulated C-peptide levels were very low (Figure 1, A and B). Nine weeks after initiation of exenatide treatment, the IVGTT showed a higher basal C-peptide and markedly increased C-peptide secretion in response to glucagon and arginine stimulation, whereas the response to glucose remained minor. In the post-intervention period, the C-peptide area under the curve and the maximal insulin response (glucose, glucagon, and arginine together) were 6.2- and 7-fold higher, respectively (Figure 1, A and B). A standard mixed meal test preceded by exenatide injection showed reduction of postprandial blood glucose, whereas the C-peptide/glucose ratio was higher throughout the test (Figure 1, C–E). As expected, GLP-1 and glucagon levels were increased in response to a meal, whereas premeal exenatide administration inhibited both endogenous GLP-1 and glucagon secretion (Figure 1, F and G).
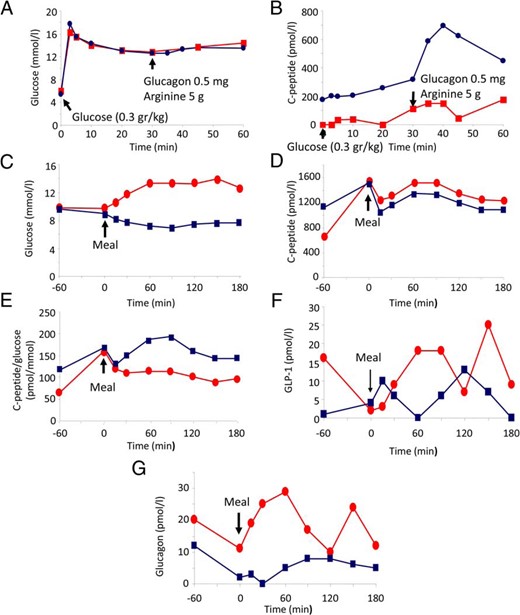
Treatment of a T2-WFS patient with GLP-1-RA. A–F, Improved postmeal hyperglycemia and markedly increased insulin response to stimulation after treatment with GLP-1-RA. A and B, C-peptide response to glucose, arginine, and glucagon. The patient was treated with exenatide for 9 weeks, and C-peptide secretion was assessed by IVGTT (0.3 g/kg), followed by injection of arginine (5 g) and glucagon (0.5 mg) at 30 minutes, before (red) and after (blue) intervention. A, Glucose concentrations; B, plasma C-peptide levels. C–G, C-peptide, GLP-1, and glucagon secretion in response to a standard mixed meal. Mixed meal test was performed without (red) or with injection of 10 μg exenatide 1 hour before meal ingestion (blue).
Altogether, we found that treatment of the T2-WFS patient with GLP-1-RA improved glycemia and markedly increased the insulin response to stimulation. Such an effect on β-cell function was unexpected, considering the long-standing insulin requirement and the severe hypoinsulinemia before initiation of GLP-1-RA treatment. This suggested to us that treatment with GLP-1-RA may correct a fundamental defect that led to β-cell dysfunction. To better understand β-cell dysfunction in NAF-1-deficient cells, we knocked down NAF-1 in a rat β-cell line (INS-1E) by shRNA, resulting in an approximately 50% decrease of NAF-1, without affecting the mNT protein level (Supplemental Figure 1). The insulin response of shNAF-1 β-cells to glucose and to plasma membrane depolarization by KCl was decreased by approximately 30% (Figure 2, A and B), indicating impairment of β-cell function. By contrast, IBMX-, forskolin-, and exenatide-stimulated insulin secretion of shNAF-1 cells was similar to that of control cells (Figure 2A). The relative amplifying effect of cAMP on glucose-induced insulin secretion was therefore higher in NAF-1-deficient β-cells. Thus, in shNAF-1 cells, exenatide, forskolin, and IBMX increased insulin secretion by 1.9-, 2.8-, and 2.4- fold, respectively, compared to only 1.5-, 2.2-, and 1.9-fold in control cells (Figure 2C). Transient transfections with NAF-1 small interfering RNA oligos also sensitized the cells to secrete more insulin in response to IBMX and forskolin (Supplemental Figure 2); thus, NAF-1 may be implicated in the regulation of cAMP-stimulated insulin secretion. This effect was not via augmented cAMP generation because a similar increase in cAMP levels was observed in control and shNAF-1 β-cells after treatment with exenatide and forskolin, which increase cAMP generation by adenylyl cyclase, or with IBMX, which inhibits cAMP degradation (Figure 2D). Exenatide-stimulated insulin secretion was inhibited by the adenylyl cyclase inhibitor ddA (Figure 2E), further indicating that exenatide stimulation of insulin secretion is mediated via cAMP. Collectively, NAF-1 deficiency impaired insulin secretion in response to glucose and plasma membrane depolarization, whereas the amplification by cAMP was preserved, thus partially mimicking the β-cell dysfunction in the T2-WFS patient. Prolonged treatment of the patient with exenatide augmented the maximal insulin secretion off-drug, suggesting that in addition to its acute amplification of insulin secretion, exenatide may also alleviate β-cell stress. TXNIP is a key mediator of β-cell dysfunction in diabetes and may lead to oxidative stress by inhibiting the antioxidant protein thioredoxin (18). Treatment with exenatide has been previously shown to inhibit TXNIP (19). In NAF-1 shRNA cells, the TXNIP protein was indeed increased, whereas treatment with exenatide decreased TXNIP in both control and shNAF-1 cells (Figure 2F).
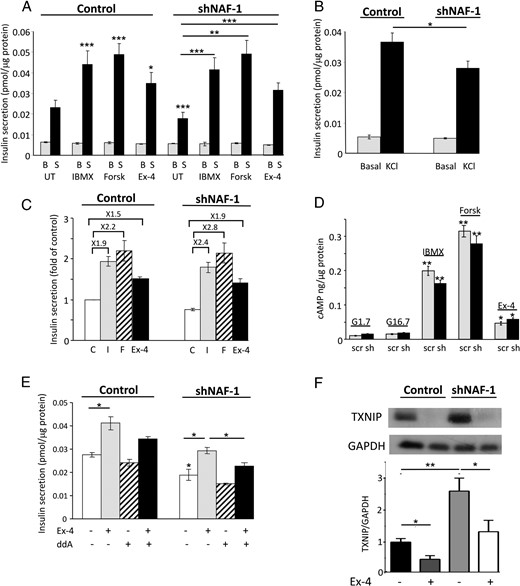
shRNA knockdown of NAF-1 decreases glucose- and KCl-stimulated insulin secretion while preserving the response to cAMP. A, Insulin secretion of shNAF-1 and control β-cells was assessed by static incubations at 1.7 mmol/L glucose (basal; B) and after stimulation with 16.7 mmol/L glucose (stimulated; S) without (untreated; UT) and with 0.5 mmol/L IBMX, 5 μmol/L forskolin (Forsk), or 100 nmol/L exenatide (Ex-4). B, Insulin secretion of control and shNAF-1 cells at 1.7 mmol/L glucose (basal) and after stimulation with 60 mmol/L KCl for 1 hour. Results in A and B are expressed as means ± SEM of three independent experiments in triplicates. C, Data shown in A are expressed as fold of insulin secretion in control cells at 16.7 mmol/L glucose (control, C; IBMX, I; forskolin, F; exenatide, Ex-4). D, cAMP levels in control (scr) and shNAF-1 (sh) cells incubated at 1.7 and 16.7 mmol/L glucose (G) without and with 0.5 mmol/L IBMX, 5 μmol/L forskolin (Forsk), or 100 nmol/L exenatide (Ex-4) for 5 minutes. E, Effect of 30 μmol/L ddA on exenatide (Ex-4)-stimulated insulin secretion in control and shNF-1 cells. F, TXNIP expression in control and shNAF-1 cells treated with and without exenatide (Ex-4) for 48 hours. A representative blot and quantifications are shown (n = 5). *, P < .05; **, P < .01; ***, P < .001 compared to controls (INS-1E cells transfected with scrambled or NAF-1 shRNA at 16.7 mmol/L glucose) or between the indicated groups.
Dysregulation of intracellular iron transport has been associated with oxidative stress and dysfunction of β-cells in diabetes (20). NAF-1 has been implicated in the regulation of intracellular iron balance (7, 11); hence, we hypothesized that iron dysregulation may play a role in the pathophysiology of T2-WFS. The patient had recurrent hospitalizations due to a bleeding peptic ulcer, which eventually required performance of subtotal gastrectomy. Staining of nonulcerative regions of the patient’s stomach for iron with Perls’ (Prussian blue) stain revealed the presence of hemosiderin deposits appearing as fine granular puncta in the cytoplasm of glandular epithelial cells in the fundus and the antrum. No iron deposits were found in the stomachs of subjects undergoing sleeve gastrectomy (Figure 3A). Iron deposition appeared in the deep gastric glands and not in the foveolar cells lining the gastric mucosa, and there was no extracellular deposition. Based on these findings, we surmised that gastric siderosis in the T2-WFS patient might represent a form of iron dysregulation, which is not secondary to gastric ulceration and bleeding or blood transfusions.
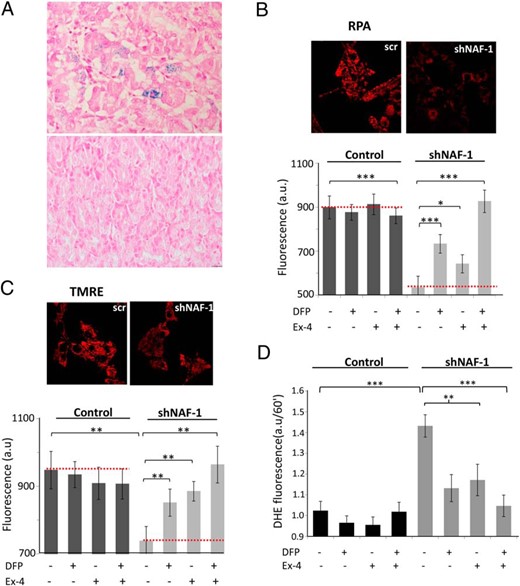
A, Iron deposition in T2-WFS in vivo. B–D, Treatment with exenatide (Ex-4) and the iron chelator DFP reverses mitochondrial iron accumulation, mitochondrial dysfunction, and oxidative stress induced by shRNA knockdown of NAF-1 in INS-1E β-cells. A, Gastric sections of control patients undergoing sleeve gastrectomy (lower panel) and of the T2-WFS patient (upper panel) stained for iron with Prussian blue. Representative images are shown. Magnification, ×400. B–D, shNAF-1 and control β-cells were treated for 48 hours with or without Ex-4 (100 nmol/L) and/or the iron chelator DFP (25 μmol/L). B, Mitochondrial iron accumulation assessed by RPA fluorescence. Semiconfocal microscopy images (left) and bar graph quantifications shown as percentage of mitochondrial iron reduction (right), or as arbitrary units (a.u.) at bottom; scr, scrambled. C, Mitochondrial membrane potential assessed by TMRE fluorescence. Semiconfocal microscopy images (left), and bar graph quantifications shown as percentage of recovery (mitochondrial membrane potential) (right), or as arbitrary units (a.u.) (bottom). D, Bar graph showing quantification of dihydroethidium mean fluorescence at 60 minutes. Ex-4, exenatide. *, P < .05; **, P < .01; ***, P < .001, compared to controls (scrINS-1E and shNAF-1 INS-1 cells) or between the indicated groups.
We studied the effects of NAF-1 deficiency and exenatide treatment on mitochondrial labile iron levels and oxidative stress in INS-1E cells. NAF-1 repression resulted in mitochondrial iron accumulation (Figure 3B), a decrease in MMP (Figure 3C), and an increase in mitochondrial ROS production (Figure 3D). Interestingly, treatment with the iron chelator DFP reversed these NAF-1 deficiency-induced outcomes (Figure 3, B–D), indicating that in NAF-1-deficient β-cells, mitochondrial dysfunction and increased ROS production were associated with aberrant cellular iron distribution. Strikingly, treatment with exenatide similarly reduced mitochondrial iron accumulation and the ensuing ROS production, as well as partially restored MMP (Figure 3, B–D). Moreover, treatment with exenatide and DFP together completely abolished mitochondrial dysfunction and ROS generation.
Chronic β-cell stress may lead to a reduction in insulin reserves. In agreement, insulin content in shNAF-1 cells was decreased by 33% compared to control cells (Figure 4A). Despite oxidative stress in shNAF-1 cells, apoptosis was not increased compared to control cells (Supplemental Figure 3), indicating that the reduction of insulin content was not secondary to β-cell loss. The 48-hour treatment of shNAF-1 cells with exenatide alone only partially increased the insulin content, whereas DFP had no effect. Importantly, combined treatment with exenatide and DFP increased β-cell insulin content in a synergistic manner and completely prevented the reduction in insulin reserves in NAF-1-deficient β-cells (Figure 4A).
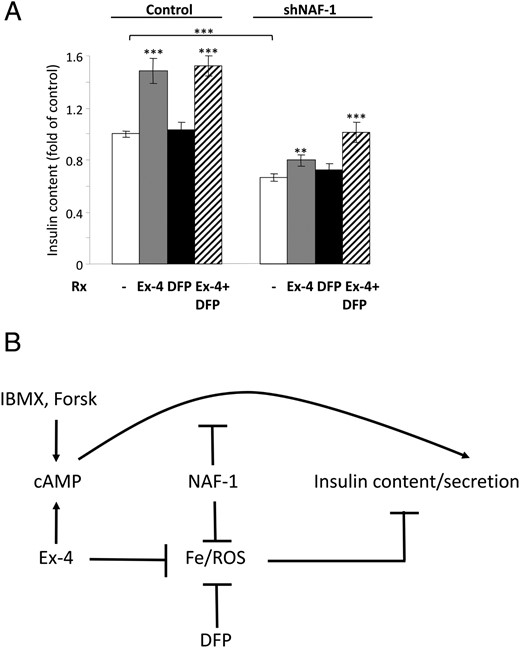
Effects of NAF-1 deficiency and treatment with GLP-1-RA (Ex-4) and iron chelation on β-cell function. A, Insulin content of control and shNAF-1 cells treated without (−) or with Ex-4 (100 nmol/L) and the iron chelator DFP (25 μmol/L) alone or together (three independent experiments in three and six replicates). Results were normalized to protein content and are expressed as fold of control. B, A model of β-cell dysfunction in T2-WFS and rationale for treatment with GLP-1-RA and iron chelators such as DFP. **, P < .01; ***, P < .001 compared to controls (scrINS-1E and shNAF-1 INS-1 cells) or between the indicated groups.
Discussion
Herein we show that treatment of T2-WFS with GLP-1-RA could improve β-cell function. Although NAF-1 deficiency impaired glucose-stimulated insulin secretion, it preserved and even increased cAMP-stimulated insulin secretion, possibly explaining the patient’s rapid response to treatment with exenatide. In addition, in INS-1E cells, GLP-1-RA prevented mitochondrial labile iron accumulation associated with NAF-1 deficiency, thereby alleviating the oxidative stress and preserving mitochondrial functional integrity, as reflected in the MMP. Thus, our study sheds new light on the mechanisms of β-cell and, by extent, probably neuronal cell stress in T2-WFS. Despite cellular stress, apoptosis was not increased in shNAF-1 β-cells. We assume that shNAF-1 cells were adapted to chronic oxidative stress through yet unknown antiapoptotic mechanisms, which may promote cell growth under stressful conditions. The fact that the cells did not undergo apoptosis enabled us to clarify the impact of NAF-1 deficiency on β-cell function and the effects of treatment with GLP-1-RA, irrespective of its antiapoptotic effects. It is likely that chronic oxidative stress in vivo eventually leads to β-cell loss and consequently decreased β-cell mass; however, our findings suggest that NAF-1 deficiency might impair β-cell function even without causing apoptosis.
Accumulation of labile iron in mitochondria can induce cellular damage through hydroxyl radical-induced oxidation of proteins, lipids, and DNA, intracellular organelle dysfunction, and eventually apoptosis (21). Strikingly, treatment with GLP-1-RA partially prevented mitochondrial iron overload and its deleterious consequences on mitochondrial function and oxidative stress. To our knowledge, this is the first demonstration that a hormone not directly associated with iron homeostasis may affect cellular iron management and prevent the accumulation of labile iron in the mitochondria of NAF-1-deficient cells.
The finding that GLP-1-RA prevented mitochondrial labile iron accumulation may have major implications for the mechanisms of GLP-1-RA action in diabetes and, more important, for the treatment of other β-cell and neurodegenerative disorders, such as Parkinson’s disease, Alzheimer’s disease, and Friedreich’s ataxia, in which iron toxicity plays a pathophysiological role (22) that might be corrected by the chelator DFP (23). In support of this hypothesis, it has been recently shown that GLP-1-RA treatment of diabetes associated with Friedreich’s ataxia may reduce β-cell stress, although the role of iron and ROS in this process was not examined (24). Based on the finding that in NAF-1-deficient β-cells treatment with GLP-1-RA and iron chelation completely prevented mitochondrial labile iron accumulation, oxidative stress, and the reduction of β-cell insulin level, we suggest that this combination therapy might provide a means to attenuate the progression of diabetes and neuronal degeneration in patients with WFS (Figure 4B). These findings may have important clinical implications because there is no effective treatment to prevent β-cell and neuronal cell degeneration in WFS. Detailed clinical studies are required to assess the effects of GLP-1-RA and iron chelation on the natural history and grave prognosis of WFS and other irremediable β-cell and neuronal degenerative disorders.
Acknowledgments
This work was supported by grants from the Israel Science Foundation-Legacy Biomedical Science Partnership (ISF-156/14; to G.L.), the Binational Science Foundation (BSF-2013026; to G.L.), the Israel Science Foundation (ISF-865/13; to R.N.), and the National Science Foundation (MCB-1613462; to R.M. and R.N.), and by funds from the University of North Texas College of Arts and Sciences (to R.M.).
Clinical Trial Registration No.: HM-0438-10; NCT01302327.
Authors’ Contributions: G.L. and R.N. designed the study, drafted the manuscript, and approved its final version. L.D., Y.-S.S., O.K., C.F., A.Z., A.A.-L., T.I., Y.R., and O.P. acquired data. R.B. and D.H.Z. contributed to the acquirement of data and revised the article’s intellectual content. R.M., Z.-I.C., and E.C. contributed to the study design, interpretation of data, and drafting the manuscript. G.L. and R.N. are responsible for the integrity of this work.
Disclosure Summary: The authors have nothing to disclose.
Abbreviations
- ddA
2′,3′-dideoxyadenosine
- DFP
deferiprone (ferriprox; 1,2-dimethyl-3-hydroxypyridin-4-one)
- ER
endoplasmic reticulum
- GLP-1
glucagon-like peptide 1
- GLP-1-RA
GLP-1 receptor agonist
- IBMX
3-isobutyl-1-methylxanthine
- IVGTT
iv glucose tolerance test
- MMP
mitochondrial membrane potential
- mNT
mitoNEET
- NAF-1
nutrient-deprivation autophagy factor-1
- ROS
reactive oxygen species
- RPA
rhodamine B-[(1,10-phenanthroline-5-yl)-aminocarbonyl]benzyl ester
- shRNA
short hairpin RNA
- TMRE
tetramethylrhodamine, ethyl ester
- T2-WFS
type 2 WFS
- TXNIP
thioredoxin-interacting protein
- WFS
Wolfram syndrome.
References
Author notes
L.D. and Y.-S.S. contributed equally to the experimental work of the paper.
