


Previous studies have attempted to elucidate the potential role of various cytokines and chemokines in human type 1 diabetes (T1D); however, the precise role of these serum proteins in T1D is still controversial and undetermined primarily due to the small sample sizes of the previous studies. We profiled a panel of serum cytokines and chemokines using a large-scale, two-stage study design for the discovery and validation of the serum proteins associated with T1D.
The participants were patients with T1D and islet autoantibody–negative control subjects from the Phenome and Genome of Diabetes Autoimmunity study.
Thirteen cytokines and chemokines were measured in serum of 4424 subjects using multiplex immunoassays.
Using 1378 samples in Stage 1, we found that four of the 13 proteins are significantly lower in patients with T1D than controls (IL8: odds ratio [OR] = 0.40; P = 5.7 × 10⁻¹⁹; IL-1Ra: OR = 0.42; P = 1.1 × 10⁻¹³; MCP-1: OR = 0.60; P = 6.7 × 10⁻⁹; and MIP-1β: OR = 0.63; P = 4.2 × 10⁻⁷). Our confirmation data with 3046 samples in Stage 2 further confirmed the significant negative associations of these four proteins with T1D (IL8: OR = 0.43; P = 8.9 × 10⁻³²; IL-1Ra: OR = 0.56, P = 3.7 × 10⁻²⁷; MCP-1: OR = 0.61, P = 4.3 × 10⁻¹⁷; and MIP-1β: OR = 0.69, P = 2.4 × 10⁻¹³). Quartile analyses also suggested that significantly more T1D cases have protein levels in the bottom quartile than in the top quartile for all four proteins: IL8 (OR = 0.09), IL-1Ra (OR = 0.18), MCP-1 (OR = 0.38), and MIP-1β (OR = 0.44). Furthermore, the negative associations between T1D and serum levels of all four proteins are stronger in genetically high-risk groups compared with the moderate and low-risk groups.
IL8, IL-1Ra, MCP-1, and MIP-1β are significantly lower in patients with T1D than controls.
Type 1 diabetes (T1D) is an autoimmune disease resulting from selective destruction of the insulin-producing β-cells of the pancreatic islets (1). The destruction of the β-cells is mediated through complex interactions between various types of immune cells and immunoregulatory cytokines and chemokines (1), which are dynamically involved in the development and progression of T1D by altering the immunoregulatory milieu within the pancreas. IL-1β and TNF-α are directly toxic to pancreatic β-cells (2, 3), whereas other cytokines and chemokines such as IL-1Ra (4), MIP-1β (5), MCP-1 (6), and IP-10 (7) regulate the inflammatory action in β-cells. Peripheral blood mononuclear cells obtained from newly diagnosed patients with T1D are shown to produce reduced levels of some cytokines/chemokines with lower expression of chemokine receptors on the cell surface (8, 9). Adiponectin, IL-1Ra, IP-10, and IL-6 have also been reported to be associated with recent-onset T1D (10, 11).
Several cytokines and chemokines including IL-1β (2, 3), TNF-α (2, 3), MIP-1β (5, 12), IL-1Ra (10, 11), MCP-1 (13, 14), and IP-10 (15, 16) were measured in the serum of patients with T1D, with little or no consensus among the studies. This may be due to small sample size, large population variation, and lack of validation studies. These studies also lack comparisons of different disease risk groups that can be stratified based on status of family history of T1D and HLA genotypes.
To minimize false-positive and false-negative results, we performed multiplex assays in two large sample sets: a large discovery sample set (1378 samples) followed by a larger confirmation sample set (3046 samples). We profiled a panel of thirteen serum cytokines and chemokines (IL8, IL-1Ra, MCP-1, MIP-1β, IP-10, MIG, RANTES, IL5, IL7, IL10, MCP-3, TNF-β, and TGF-α). This extensive study suggests that four proteins IL-1Ra, IL8, MCP-1, and MIP-1β are significantly lower in the serum of patients with T1D. A negative association of IL-1Ra, IL8, MCP-1, and MIP-1β with T1D was observed in all the genetic risk groups. Even in the genetically high-risk group, a lower proportion of T1D was observed in the top percentiles of these proteins, indicating that high levels of these cytokines may be dominantly protective.
Subjects and Materials
Subjects
The first dataset (discovery) consists of 681 autoantibody-negative (AbN) controls and 697 patients with T1D, whereas the second dataset (confirmation) includes 1493 AbN controls and 1553 patients with T1D. All study subjects were Caucasians living in the state of Georgia and randomly selected from the participants of the Phenome and Genome of Diabetes Autoimmunity (PAGODA) study (17). Blood samples from these participants were collected during the subject's visit to the endocrine clinic. No dietary restrictions were imposed for participation in the study and blood collection. The AbN controls were further separated into two subsets: first-degree relatives (FDR) of patients with T1D and subjects from the general population (GP) without an FDR with T1D. The patients with T1D were also divided into two subsets: those with no complications (T1DNC) and those with diabetic complications (T1DC). Presence of diabetic complications were determined by the attending physician/endocrinologist, based on eye exams, spot urinary albumin tests, and other clinical tests according to the American Diabetes Association/Kidney Disease Outcomes Quality Initiative guidelines. The demographic characteristics for all study subjects are summarized in Supplemental Table 1. The study was approved by the at Georgia Regents University Institutional Review Board written informed consent was obtained from adult subjects and legal guardians for minors, in accordance with the guidelines of the Declaration of Helsinki.
Laboratory assays
Blood samples were collected in serum separator tubes (BD Biosciences) and allowed to clot for 30 minutes at room temperature. Aliquots of plasma and serum were prepared immediately after phlebotomy into 96-well plates (150 μL/well) to create master plates. Daughter plates were then created by pipetting 5–25 μL of serum per well to avoid repeated freeze/thaw for all samples.
Serum levels of IL8, IL-1Ra, MCP-1, MIP-1β, IP-10, MIG, RANTES, IL5, IL7, IL10, MCP-3, TNF-β, and TGF-α were measured using multiplex fluorescent immunoassays (Millipore) according to the manufacturer's recommendations. The coefficients of variation (CVs) and the minimum detectable dose (MDD) for the assays were provided by the manufacturer with the assay kits. The MDD for these proteins are IL8, 0.2; IL-1Ra, 2.9; MCP-1, 0.9; MIP-1 β, 4.5; IP-10, 1.2; MIG, 10.3; RANTES, 1; IL5, 0.1; IL7, 1.8; IL10, 0.3; MCP-3, 2; TNF-β, 1.9; and TGF-α, 0.4 pg/mL. Serum samples were incubated with capture antibodies immobilized on polystyrene beads for 1 hour. The beads were then washed and further incubated with biotinylated detection antibody cocktail for 1 hour. Beads were washed twice to remove unbound detection antibody and then incubated with phycoerythrin-labeled streptavidin for 30 minutes. Finally, beads were washed and suspended in 60 μL wash buffer. The median fluorescence intensities were measured on a FlexMAP 3D array reader (Millipore) using the following instrument settings: events/bead, 50; minimum events, 0; flow rate, 60 μL/min; sample size, 50 μL; and discriminator gate, 8000–13 500. Before profiling the serum dilutions were optimized by performing the assays at different serum dilutions to ensure that most of the data falls within the linear range of the standard curve.
Statistical analysis
All statistical analyses were performed using the R language and environment for statistical computing (R version 2.15.1; R Foundation for Statistical Computing; www.r-project.org). All P values were two-tailed and P < .05 after adjusting for multiple testing was considered statistically significant.
Protein concentrations were estimated using a regression fit to the standard curve with known concentration included on each plate using a serial dilution series. To achieve normal distribution, the median fluorescence intensities and concentrations were log2 transformed prior to all statistical analyses. The data were subjected to several quality control (QC) steps before further analysis. Individual wells with low bead counts (<30), or high bead CV (>200) were flagged for exclusion. The CV of replicate wells was also checked and wells with CV greater than 25% were not included in further analyses. Two pooled QC samples, representative of controls and patients with T1D, were included on each plate in triplicate and data from these wells were used for plate-to-plate normalization. The limits of detection were determined using the MDD data and limits of quantitation were determined using the lower saturation end of standard curves. Wells below the limit of detection or limit of quantitation were flagged for exclusion. If any of the wells failed QC steps, the subject's data was excluded from further analysis.
ANOVA with Tukey's post-hoc correction was used for testing the differences. The pairwise correlations between individual protein levels was computed using Pearson correlation coefficient. Clustering and visualization of correlation matrix was performed using hierarchical clustering method and heat map. The effect of age on serum levels of each candidate molecule was determined using a linear regression on data stratified by sex and disease status. To assess associations between protein and disease, odds ratios (ORs) and their 95% confidence intervals (CIs) were computed by using logistic regression models including sex, age, and HLA genotype risk as covariates. For analysis using quartiles, case-control matching was performed with respect to age and sex using the “matching” R package (18). Each case was paired with a closest control to create matched datasets (Supplemental Table 2). Conditional logistic regression was performed using protein concentration as categorical variables, values 1, 2, 3, and 4, were assigned using the quartile values in controls as cutoff points.
Results
Discovery of serum proteins altered in T1D
In the discovery phase, we measured 13 chemokines and cytokines in the sera from 697 patients with T1D and 681 islet-AbN control subjects from the PAGODA study (17) using multiplex Luminex assays. We checked the distribution of serum levels of proteins in the three phenotypic groups in the discovery and confirmation data sets (Figure 1A). Serum levels of IL8 (T1D vs GP, P = 7.22 × 10⁻¹¹; T1D vs FDR, P = 1.0 × 10⁻²²), IL-1Ra (T1D vs GP, P = 5.14 × 10⁻¹²; T1D vs FDR, P = 3.67 × 10⁻¹³), MCP-1 (T1D vs GP, P = 8.70 × 10⁻⁶; T1D vs FDR, P = 1.0 × 10⁻²²), and MIP-1β (T1D vs GP, P = 3.61 × 10⁻⁵; T1D vs FDR, P = 1.0 × 10⁻²²) were significantly reduced in the patients with T1D compared with the GP and FDR subjects. Only IL8 was found to be moderately elevated in the FDR samples (P = 4.15 × 10⁻⁴), other proteins did not show any differences between GP and FDR groups. Next, we determined the effect of sex and age on protein levels in T1D and control groups separately. We observed that subject sex and age had a small but significant influence on the levels of 11 of 13 proteins. Most significantly, sex effect was observed for IL7, TNF-β, IL5, IL10, and MCP-3 (Supplemental Table 3), whereas age was significantly correlated with the serum levels of MIG, IL10, IL5, TNF-β, MCP-3, and MIP-1β (Supplemental Table 4). Logistic regression models including sex, age, and HLA genotype risk as covariates revealed significant reduction in serum levels of IL8 (P < 10−16), IL-1Ra (P < 10−12), MCP-1(P < 10−6), and MIP-1β (P < 10−6) in patients with T1D even after adjusting for the confounding variables (Supplemental Table 5).
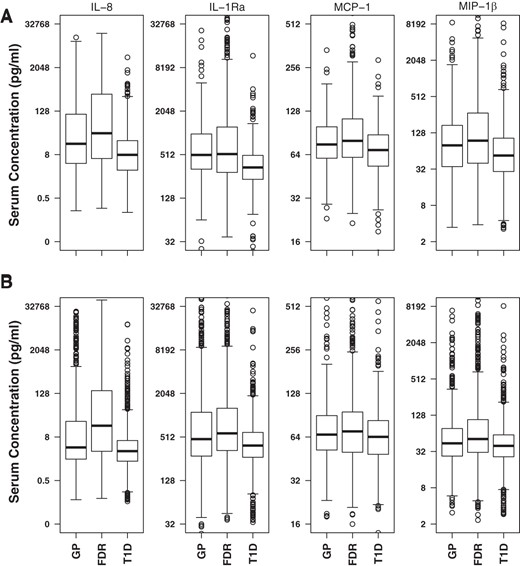
Distribution of serum protein levels in three study groups.
Distribution of serum values for IL8, IL-1Ra, MCP-1, and MIP-1β in discovery (A) and confirmation (B) datasets. Serum concentration values are plotted using log2 scale, and back-transformed concentration values (pg/mL) are shown as labels on y-axis. In the discovery dataset, the percentage of individuals below the limit of detection in GP, FDR, T1D, and Total groups were: IL-8 (14.5, 14.5, 12.9, and 13.7), IL-1Ra (10.6, 8.3, 12.2, and 10.7), MCP-1 (1.3, 1.6, 1.0, and 1.2), and MIP-1β (19.6, 17.0, 23.7, and 20.8). In the confirmation dataset the percentage of individuals below detection in GP, FDR, T1D, and Total groups were: IL-8 (17.5, 9.4, 17.1, and 15.2), IL-1Ra (4.8, 4.6, 5.8, and 5.3), MCP-1 (9.5, 4.9, 6.2, and 6.7), and MIP-1β (11.0, 7.8, 12.8, and 11.1). The total group contains all the study subjects. The box represents the interquartile range (IQR; 25th–75th percentile), the middle thick line represents median. The whiskers extend to 1.5× the IQR above and below from the box.
In addition, conditional logistic regression analysis was performed on case-control paired data to assess association between protein levels and T1D. We found that four proteins have a negative association with T1D (IL8, OR = 0.40; IL-1Ra, OR = 0.42; MCP-1, OR = 0.60; and MIP-1β, OR = 0.63; P < 10−6–10−18), whereas TNF-β has a positive association (OR = 1.24; P = .02) (Table 1). We also performed conditional logistic regression analyses to compare subjects in the upper three quartiles with subjects in the bottom quartile. The fourth quartile of these four proteins have lower proportions of T1D cases and more controls compared with the first quartile (IL8, OR = 0.04; IL-1Ra, OR = 0.08; MCP-1, OR = 0.32; MIP-1β, OR = 0.22; P < 10−6–10−12), whereas subjects in the fourth quartile of TNF-β showed increased proportion of T1D cases (OR = 1.72; P = .03) (Table 1).
Association of Serum Cytokines/Chemokines With T1D in the Discovery Dataset (697 T1D Patients and 681 Control Subjects)
| Protein Levels as Continuous Variable | Protein Levels as Categorical Variable | |||||||
|---|---|---|---|---|---|---|---|---|
| Quartile 2 | Quartile 3 | Quartile 4 | ||||||
| Protein | OR (95% CI) | Adj P | OR (95% CI) | Adj P | OR (95% CI) | Adj P | OR (95% CI) | Adj P |
| IL8 | 0.40 (0.33–0.48) | 5.69 × 10⁻¹⁹ | 1.04 (0.72–1.50) | NS | 0.41 (0.27–0.62) | .00026 | 0.04 (0.02–0.1) | 2 × 10⁻¹⁰ |
| IL-1Ra | 0.42 (0.34–0.52) | 1.14 × 10⁻¹³ | 0.80 (0.57–1.13) | NS | 0.42 (0.28–0.61) | .0002 | 0.08 (0.04–0.15) | 4 × 10⁻¹³ |
| MCP-1 | 0.60 (0.50–0.70) | 6.73 × 10⁻⁹ | 0.74 (0.54–1.01) | NS | 0.68 (0.49–0.93) | NS | 0.32 (0.22–0.47) | 4 × 10⁻⁸ |
| MIP-1β | 0.63 (0.53–0.75) | 4.17 × 10⁻⁷ | 1.35 (0.91–1.98) | NS | 0.83 (0.54–1.28) | NS | 0.22 (0.13–0.38) | 6 × 10⁻⁷ |
| TNF-β | 1.24 (1.06–1.46) | .018 | 0.88 (0.57–1.38) | NS | 1.13 (0.75–1.72) | NS | 1.72 (1.13–2.63) | .03 |
| IL-5 | 1.18 (1.02–1.38) | NS | 1.11 (0.73–1.71) | NS | 1.45 (0.93–2.25) | NS | 1.56 (1.02–2.40) | NS |
| IP-10 | 0.89 (0.79–1.00) | NS | 0.99 (0.72–1.37) | NS | 0.98 (0.70–1.35) | NS | 0.80 (0.58–1.11) | NS |
| MCP-3 | 1.11 (0.98–1.26) | NS | 1.47 (1.03–2.10) | NS | 1.33 (0.93–1.92) | NS | 1.48 (1.03–2.13) | NS |
| IL-7 | 1.09 (0.93–1.29) | NS | 2.02 (1.23–3.34) | NS | 1.61 (0.96–2.70) | NS | 1.81 (1.09–2.99) | NS |
| TGF-α | 0.96 (0.82–1.12) | NS | 0.80 (0.53–1.22) | NS | 0.73 (0.48–1.10) | NS | 0.92 (0.60–1.41) | NS |
| IL-10 | 0.98 (0.87–1.10) | NS | 1.25 (0.90–1.75) | NS | 1.17 (0.83–1.65) | NS | 0.99 (0.70–1.40) | NS |
| RANTES | 0.99 (0.88–1.12) | NS | 0.99 (0.71–1.36) | NS | 1.00 (0.73–1.37) | NS | 0.94 (0.67–1.30) | NS |
| MIG | 1.00 (0.88–1.12) | NS | 1.03 (0.75–1.42) | NS | 0.75 (0.54–1.05) | NS | 1.05 (0.76–1.47) | NS |
Abbreviation: NS, Not significant.
First quartile was used as a reference.
Validation of four serum proteins decreased in patients with T1D
Serum levels of four proteins (IL8, IL-1Ra, MCP-1, and MIP-1β) with highly significant findings in the discovery data set were further measured in a larger set of samples consisting of 1493 AbN controls and 1553 patients with T1D. In the confirmation dataset the levels of IL8 (T1D vs GP, P = 1.0 × 10⁻²²; T1D vs FDR, P = 1.0 × 10⁻²²), IL-1Ra (T1D vs GP, P = 1.0 × 10⁻²²; T1D vs FDR, P = 1.0 × 10⁻²²), MCP-1 (T1D vs GP, P = 2.7 × 10⁻⁶; T1D vs FDR, P = 1.0 × 10⁻²²), and MIP-1β (T1D vs GP, P = 4.6 × 10⁻⁶; T1D vs FDR, P = 1.0 × 10⁻²²) were also found to be reduced in the patients with T1D compared with GP or FDR subjects (Figure 1B). In this large dataset we noticed that levels of IL8 (P = 1.0 × 10⁻²²), IL-1Ra (P = .009), MCP-1 (P = .0067), and MIP-1β (P = 3.4 × 10⁻⁷) were significantly elevated in the FDR subjects compared with the GP subjects. Similar to the discovery data, logistic regression models revealed a significant reduction in serum levels of four proteins in T1D after adjusting for age, sex, FDR status, and HLA genotype risk (Supplemental Table 5). Conditional logistic regression confirmed significant negative associations of these proteins with T1D: IL8 (OR = 0.43; P < 10−31), IL-1Ra (OR = 0.56; P < 10−26), MCP-1 (OR = 0.61; P < 10−16), and MIP-1β (OR = 0.69; P < 10−12) (Table 2). Analysis using quartiles also confirmed that lower proportion of T1D cases in the top quartiles: IL8 (OR = 0.09; P < 10−26), IL-1Ra (OR = 0.18; P < 10−25), MCP-1 (OR = 0.38; P < 10−12) and MIP-1β (OR = 0.44; P < 10−8). This large data set provided unambiguous evidence that serum levels of IL8, IL-1Ra, MCP-1, and MIP-1β are negatively associated with T1D.
Association of Serum Cytokines/Chemokines With T1D in the Confirmation Dataset (1553 T1D Patients and 1493 Control Subjects)
| Protein Levels as Continuous Variable | Protein Levels as Categorical Variable | |||||||
|---|---|---|---|---|---|---|---|---|
| Quartile 2 | Quartile 3 | Quartile 4 | ||||||
| Protein | OR (95% CI) | Adj P | OR (95% CI) | Adj P | OR (95% CI) | Adj P | OR (95% CI) | Adj P |
| IL8 | 0.43 (0.37–0.49) | 8.86 × 10⁻³² | 0.92 (0.72–1.18) | NS | 0.44 (0.33–0.57) | 7 × 10⁻⁹ | 0.09 (0.06–0.14) | 2 × 10⁻²⁷ |
| IL-1Ra | 0.56 (0.51–0.62) | 3.78 × 10⁻²⁷ | 0.92 (0.74–1.15) | NS | 0.84 (0.67–1.05) | NS | 0.18 (0.14–0.25) | 1 × 10⁻²⁶ |
| MCP-1 | 0.61 (0.55–0.69) | 4.33 × 10⁻¹⁷ | 0.88 (0.71–1.10) | NS | 0.83 (0.66–1.05) | NS | 0.38 (0.29–0.49) | 8 × 10⁻¹³ |
| MIP-1β | 0.69 (0.62–0.76) | 2.43 × 10⁻¹³ | 1.06 (0.83–1.34) | NS | 0.92 (0.72–1.17) | NS | 0.44 (0.33–0.58) | 3 × 10⁻⁹ |
Abbreviation: NS, Not significant.
First quartile was used as a reference.
Altered pair-wise correlations between proteins in patients with T1D
Pair-wise Pearson's correlations between individual proteins were examined in four groups (GP, FDR, T1DNC, and T1DC) separately. Hierarchical clustering and heat-map visualization of the correlation matrix revealed two major clusters of correlated proteins (Figure 2A). The first cluster consisted of four proteins (IL8, IL-1Ra, MCP-1, and MIP-1β), which showed high degrees of correlations with each other in GP (r = 0.42–0.56) and FDR (r = 0.33–0.62) control groups, but no correlations in T1DNC or T1DC groups. The remaining eight proteins (IP-10, MIG, IL-7, MCP-3, TGF-α, IL-10, TNF-β, and IL-5) were grouped into a second cluster with similar correlation values in the four population groups. These results were confirmed in the larger confirmation dataset as higher correlations among four proteins (IL-1Ra, IL8, MCP-1, and MIP-1β) were observed in control groups (GP, r = 0.23–0.46; FDR, r = 0.32–0.46), but these correlations were not observed in T1DNC or T1DC (Figure 2B). The reduced correlations in both T1D patient groups may be due to altered expression of these four proteins in different patients.
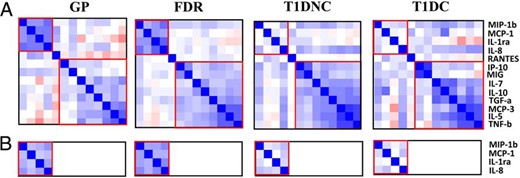
Pairwise correlations between serum protein levels.
The pairwise correlation values are represented using heat map and hierarchical clustering in discovery (A) and confirmation (B) datasets.
Reduced serum protein levels in patients cannot be accounted for by complications
To determine the effect of various diabetic complications on the serum levels of these proteins, we performed conditional logistic regression analysis by comparing patients with T1D without complication and patients with T1D with complication (Supplemental Table 6). No significant changes for the four proteins were observed in both discovery and confirmation datasets, suggesting that decrease in serum levels of these four proteins cannot be explained by T1D-related complications. Combining data for 2, 3, and 4 proteins also did not show any significant difference between the complications and no complication subjects (Supplemental Table 7). However, it remains to be determined whether the proteins analyzed only in the discovery sample set are associated with diabetic complications.
IL8 protein levels are higher in FDR than GP
Protein levels were also compared between the two control groups (GP and FDR). IL8 was significantly increased in FDR compared with GP in both discovery (OR = 1.40; P = .004) and confirmation (OR = 1.33; P < 10−4) datasets (Table 3). Conditional logistic regression analyses using quartiles also revealed that the fourth quartile of IL8 protein has higher proportions of FDR and fewer GP controls compared with the first quartile (discovery, OR = 2.25; P = .014; confirmation, OR = 2.51, P < 10−5). A weak positive association with FDR was also observed for MIP-1β (OR, 1.17, P = .015), whereas no significant differences were observed for IL-1Ra and MCP-1 in FDR vs GP comparison. These results raised the possibility that higher serum levels of IL8 protein might be partially responsible for the protection against T1D in some genetically at risk FDR control subjects. In multimarker analyses, all combinations containing IL8 were significantly different, whereas other protein combinations did not show any significant difference. Furthermore, odds ratios of combinations could not be improved compared with IL8 alone (Supplemental Table 8).
Comparison of Serum Cytokines/Chemokines Between FDRs and GP
| Protein Levels as Continuous Variable | Protein Levels as Categorical Variable | |||||||
|---|---|---|---|---|---|---|---|---|
| Quartile 2 | Quartile 3 | Quartile 4 | ||||||
| Protein | OR (95% CI) | Adj P | OR (95% CI) | Adj P | OR (95% CI) | Adj P | OR (95% CI) | Adj P |
| Discovery dataset | ||||||||
| IL8 | 1.40 (1.18–1.67) | .002 | 1.17 (0.70–1.96) | NS | 1.07 (0.62–1.83) | NS | 2.25 (1.40–3.61) | .01 |
| IL-1Ra | 1.12 (0.96–1.31) | NS | 0.63 (0.40–1.02) | NS | 0.77 (0.49–1.22) | NS | 1.09 (0.72–1.66) | NS |
| MCP-1 | 1.10 (0.96–1.28) | NS | 0.83 (0.53–1.29) | NS | 0.85 (0.55–1.30) | NS | 1.15 (0.78–1.71) | NS |
| MIP-1β | 1.19 (1.00–1.43) | NS | 0.75 (0.45–1.22) | NS | 0.94 (0.56–1.58) | NS | 1.42 (0.88–2.28) | NS |
| Confirmation dataset | ||||||||
| IL8 | 1.33 (1.17–1.5) | 3.23 × 10−05 | 1.23 (0.83–1.82) | NS | 2.29 (1.59–3.30) | 3.13 × 10−05 | 2.51 (1.75–3.61) | 2.45 × 10−06 |
| IL-1Ra | 1.02 (0.92–1.14) | NS | 1.39 (1.02–1.88) | NS | 1.87 (1.39–2.52) | 6.52 × 10−05 | 1.21 (0.89–1.66) | NS |
| MCP-1 | 1.08 (0.96–1.21) | NS | 0.76 (0.54–1.06) | NS | 1.20 (0.89–1.62) | NS | 1.10 (0.80–1.50) | NS |
| MIP-1β | 1.17 (1.04–1.31) | .015 | 1.18 (0.86–1.61) | NS | 1.23 (0.90–1.69) | NS | 1.45 (1.05–1.99) | .046 |
Abbreviation: NS, Not significant.
First quartile was used as a reference.
High levels of cytokines may be dominantly protective
Next, we examined these four proteins (IL-1Ra, IL8, MCP-1, and MIP-1β) in subject groups with different levels of genetic risks. The subjects were divided into three risk groups, high-risk group (H) with three HLA-DQ genotypes (0201/0201, 0302/0302, or 0201/00302), medium-risk group (M) with HLA genotype 0302/x (x ≠ 0201, 0302 or 0602), and low-risk group (L) with all other HLA genotypes (x/x). The subjects were categorized based genetic risk (H, M, and L), disease state (T1D, GP, or FDR) as well as protein levels. ORs associated with sliding protein levels (using cutoffs at every two percentiles: fourth, eighth, 12th, 14th, 16th …. 82nd, 84th, 86th, 88th, 92nd, and 96th percentile) were computed and graphically presented for the discovery dataset in Figure 3. Similar results were observed for all four proteins in the confirmation dataset (Supplemental Figure 1). These data reflect the risks for different subject groups categorized based on their genetic risk and protein risk. These results suggest that increasing levels of each protein are associated with decreasing ORs for T1D irrespective of the genetic risk levels or FDR status of the control groups. The differences in ORs between high and low protein levels are smaller in the low-risk group but higher in the high-risk group. Indeed, subjects with the high-risk genes and high serum protein levels are less likely to have T1D, suggesting that these proteins may provide dominant protection against T1D even in the genetically high-risk group.
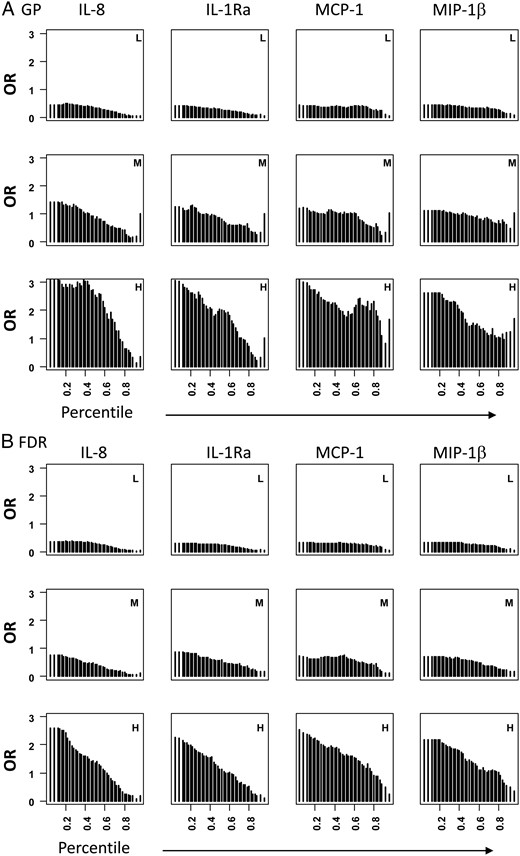
Graphic representation of ORs associated with sliding protein levels in different genetic risk groups in the discovery dataset.
All patients with T1D were compared with GP (A) or FDR (B). Subjects in each disease group (T1D, GP, or FDR) were divided into three risk groups (H, high risk; M, medium risk; and L, low risk). In each group, the numbers of subjects having different protein levels were counted using a sliding cutoffs (every two percentiles) and ORs were computed by comparing number of subjects below and above the cutoffs in T1D vs control groups in each of the three genetic risk groups.
Discussion
Several studies have assessed the potential role of serum cytokines, chemokines, and their soluble receptors in the development and progression of T1D; however, the findings are generally difficult to replicate. The inconsistency in reports could result from many sources including large variation between individuals as well as influence of covariates such as sex, age, environmental exposures, and disease state (19, 20). Most importantly, the sample sizes used in the previous studies were small to have sufficient statistical power. In this large, cross-sectional study, we used a two-stage study design for the discovery and validation of the serum proteins. Our discovery dataset represents the largest survey of serum proteins in terms of the sample size compared with all previous studies. We discovered that serum levels of IL-1Ra, IL8, MCP-1, and MIP-1β are significantly lower in the sera of patients with T1D compared with controls. The second stage of the study with 3046 subjects provided unambiguous evidence that serum levels of IL-1Ra, IL8, MCP-1, and MIP-1β are negatively associated with T1D. Interestingly, these four proteins belong to the innate immune system and both Th1 (IL-β and TNF-α) (21) and Th2 cytokines (IL-4 and IL-13) (5, 22, 23) are known to regulate the biosynthesis of IL-1Ra, IL8, MCP-1, and MIP-1β.
IL-1Ra is a natural antagonist of IL-1β, mainly secreted by monocytes and lymphocytes and is crucial for the homeostasis of the immune system. It is an anti-inflammatory mediator and the balance between IL-1Ra and IL-1β plays a decisive role in the β-cell apoptosis (24). Inhibition of IL-1β-mediated immune response are also shown to have a role in the protection against development of T1D autoimmunity (24, 25). It has been argued that elevated IL-1β/IL-1Ra ratio in the newly diagnosed patients with T1D promotes β-cell lysis and this proinflammatory status is reversed with cessation of inflammatory disease in patients with long-standing T1D (15). The reduced levels of serum IL-1Ra observed in patients with T1D in our study are in agreement with these findings. A recent report has also shown that newly diagnosed patients with T1D who underwent remission had higher serum levels of IL-1Ra than nonremitters (25).
MCP-1 stimulates the production of IL-4, a primary Th-2 cytokine with anti-inflammatory properties (26). In contrast, IL-4 increases production of MIP-1β in the pancreas of the NOD mouse (27), suggesting a positive relationship between these two chemokines. MIP-1β signaling via CCR5 is known to suppress inflammation by recruiting regulatory T-cells (12, 28), whereas MCP-1 signaling via CCR2 has been shown to suppress autoimmune diabetes via recruitment of tolerogenic CD11c+ CD11b+ dendritic cells (6). The protective role of MCP-1 has also been demonstrated in animal models of experimental autoimmune encephalomyelitis (29, 31) and T1D (6, 31), whereas protective role of MIP-1β has been shown in NOD mouse models of the disease (5). MIP-1β has been shown to be negatively associated with the β-cell stress marker proinsulin (11) in patients with T1D.
IL8 is a multifunctional protein and is secreted by several cell types with toll-like receptors in response to an inflammatory stimulus. Its primary known function is to induce chemotaxis in neutrophils and other granulocytes, causing them to migrate toward the site of infection. In contrast, IL8 has also been linked to angiogenesis, cell survival, proliferation, and inhibition of bcl2-dependent apoptosis (32, 33). IL8 is well known to play a role in the pathogenesis of bronchiolitis but its role in T1D pathogenesis is unclear. Recombinant IL8 has been shown to inhibit adhesion of leukocytes to activated endothelial cells (34) and attenuate inflammatory events at the vessel wall. Recently, IL8 has been shown to have neuroprotective properties, given that plasma and cerebrospinal fluid levels of IL-8 were significantly lower in suicide attempters with anxiety than in healthy controls (35). IL8 reduces expression of CD11b on monocytes expressing CXCR1 and their migration to islets (36). Previous small-scale studies have tied the elevated levels of IL8 to poor metabolic control and ketosis in patients with T1D (36). In our study we present a novel protective role of IL8 in T1D but additional studies will be required to understand the mechanism of protective role of IL8 in β-cell physiology and T1D autoimmunity.
One potential limitation of this study is that variables related to metabolic status and glucose control such as sample collection time of day, fasting state, glucose at time of draw, and glycosylated hemoglobin (HbA1c) were not measured in this study. These variables may be important in the levels of chemokines and cytokines in the serum. Also, no dietary restrictions were imposed for participation in the study and for blood collection. However, we collected blood samples from both patients and controls at random times during the day. Given that patients and controls are treated the same way, the effect of these covariables on study results was minimized. There are contradictory reports on cytokine production by cells obtained from patients with T1D (9, 38); however, in a study of Egyptian children with T1D, serum levels were unaffected with serum glucose level, duration of disease, and insulin dose (39). Serum cytokines are found to peak in early morning, whereas the levels tend to be consistent during the period of 0500–1600 h in healthy individuals (40), therefore sample collection during any time of the day may not affect the results. Another potential issue is the definition of diabetic complications via chart review. However, this should not be a serious concern for the proteins studied here because no difference was found between patients with and without complications.
This study suggests that FDR subjects have higher serum protein levels for IL8 than both patients with T1D and GP controls. The results lead us to hypothesize that higher levels of this cytokine may be partly responsible for the protection in the FDRs. For all four proteins, we also found that control subjects (both GP and FDR) having high-risk HLA genotypes are more likely to have higher serum protein levels, suggesting that these proteins are dominantly protective against T1D.
Acknowledgments
We thank physicians Andy Muir, David Brown, N. Spencer Welch, Paul Davidson, Joseph Johnson, David Robertson, Constance Baldwin, Melissa Carlucci, Mark Rappaport, Robert Schultz, Vijayasudha Gunna and staff members Kim English, Jessica Leggett, Katherine Guthrie, Melanie Brown, Deana McFeely, Nellie Jenkins, JoAnn Higdon, Debbie Ellison, Tami Kinnersley, and Ann Simmonds for their contribution in sample collection. We are very grateful to all patients and other volunteers who participated in this study.
This work was supported by grants from the National Institutes of Health (4R33HD050196, 4R33-DK069878, and 2RO1HD37800) and Juvenile Diabetes Research Foundation (JDRF) (1-2004-661) to J.-X.S. Sharad Purohit was supported by a JDRF senior postdoctoral fellowship (JDRF 10-2006-792) and career development award (2-2011-153) from JDRF. J.-X.S. is an eminent scholar supported by the Georgia Research Alliance.
Disclosure Summary: The authors have nothing to disclose.
Abbreviations
- AbN
autoantibody negative
- CI
confidence interval
- CV
coefficients of variation
- FDR
first-degree relative
- GP
general population
- HbA1c
glycosylated hemoglobin
- MDD
minimum detectable dose
- OR
odds ratio
- PAGODA
Phenome and Genome of Diabetes Autoimmunity
- QC
quality control
- T1D
type 1 diabetes
- T1DC
diabetic complications
- T1DNC
diabetic with no complications.
References
Author notes
S.P. and A.S. contributed equally to the study.
