


Regional fat distribution rather than overall obesity has been recognized as important to understanding the link between obesity and cardiovascular disease.
We examined the associations of abdominal visceral adipose tissue (VAT) and abdominal subcutaneous adipose tissue (SAT) with cardiovascular risk factors in a Caucasian population of men and women with normal glucose tolerance, prediabetes, or screen-detected diabetes.
The study was based on cross-sectional analysis of data from 1412 adults age 45–80 years. VAT and SAT were assessed by ultrasound. The associations of VAT and SAT with blood pressure and lipids were examined by linear regression analysis adjusted for age, sex, smoking, alcohol, physical activity, glucose tolerance status (GTS), medication use, and body mass index. Effect modification by GTS and sex was examined, and stratified analyses performed.
Independent of SAT and overall obesity, VAT was associated with higher triglyceride and lower high-density lipoprotein (HDL) cholesterol levels in both men and women and additionally associated with higher total cholesterol in men. SAT was independently associated with higher total cholesterol and low-density lipoprotein cholesterol levels in both sexes, and SAT was additionally associated with higher triglyceride and lower HDL cholesterol levels in women and with higher blood pressure in participants with diabetes.
Both abdominal VAT and SAT are independent of overall obesity associated with cardiovascular risk in a population of men and women at low to high risk of diabetes or with screen-detected diabetes.
Obesity has reached epidemic proportions worldwide and is now characterized by the World Health Organization (WHO) as one of the most serious public health challenges of the twenty-first century (1). Although obesity is clearly associated with higher risk of mortality and morbidity, obesity remains a complex and heterogenic disorder. Some obese individuals exhibit a relatively normal cardiometabolic risk profile, whereas others with a similar degree of obesity have clearly increased risk of cardiovascular complications and diabetes (2, 3). A better understanding of the link between obesity, type 2 diabetes, and cardiovascular risk will enable a better identification of individuals at high risk of cardiovascular disease (CVD) and thus provide basis for offering lifestyle modification to those who will benefit most.
Regional fat distribution rather than overall obesity has been recognized as important to understanding the link between obesity and CVD. In particular, findings show that central abdominal obesity is a better predictor of CVD than overall obesity (4). Studies have also suggested that different abdominal fat compartments and distributions may be differently associated with cardiovascular risk (5, 6) and that the associations differ by sex (7). Only a few studies have assessed the independent associations of VAT and SAT with cardiovascular risk, generally showing that high levels of VAT are associated with higher cardiovascular risk compared with SAT (2, 4, 6–8). It has been suggested that these associations are independent of the presence of type 2 diabetes (9), but this finding must be confirmed in larger study populations.
The increased focus on VAT and SAT emphasizes the importance of accurate measurements of these fat compartments in large-scale studies. Ultrasound is a noninvasive, inexpensive, validated, and accessible method for measuring abdominal fat compartments in epidemiological studies (10–13). Ultrasound was successfully used to assess VAT and SAT in a Greenlandic and a multiethnic population (14, 15), but these studies did not assess whether the associations with cardiovascular risk differed in individuals with normal glucose tolerance (NGT), prediabetes, or diabetes. Therefore, the aim of the present study was to assess the association of VAT and SAT, measured by ultrasound, with cardiovascular risk factors, and to study whether the associations differed in men and women and in individuals with NGT, prediabetes, and screen-detected type 2 diabetes.
Materials and Methods
Design and study population
The present cross-sectional study consists of data from the ADDITION-PRO study (16), which is a follow up health examination of individuals identified at the baseline screening program of the ADDITION-DK study (17). This stepwise screening program for diabetes was carried out in general practices in Denmark in 2001–2006. In 2009–2011 a detailed health examination of a subset of individuals with low to high risk of diabetes at screening was carried out. Participants invited were individuals with impaired glucose regulation at screening, individuals who developed diabetes following screening, and a random subsample of individuals with NGT. A total of 2082 of the 4188 invited attended (49.7%). The health examination consisted of clinical and biochemical measurements, all performed by trained staff, and completion of validated questionnaires. Data was collected at four centers. The present study is a subgroup analysis of participants from two of the four centers, where ultrasound measurements were performed (1506 of 2082 participants). After exclusion of participants with missing values, 1412 were available for complete case analysis.
Ethical approval was obtained from the scientific ethics committee in the Central Denmark Region (No. 20000183) and informed consent was obtained from all participants. The study was performed in accordance with the Helsinki Declaration.
Obesity measures
After an overnight fast, assessment of VAT and SAT by ultrasound (Logiq9 ultrasound machine, GE Healthcare) was performed by trained sonographers following a strict protocol (12). The transducer was placed on the abdomen where the xiphoid line meets the waistline, with the participants in a supine position. Both SAT and VAT were recorded at this position. Measurements were performed at the end of a normal expiration with minimal pressure on the transducer. SAT was measured as the vertical distance from the skin to the linea alba with a 9L transducer (2.5–8.0 MHz) in the transverse position. VAT was recorded as the vertical distance from the peritoneum to the front edge of the vertebra with a 5C transducer (1.5–4.5 MHz) placed longitudinally. Both SAT and VAT were assessed twice and calculated as the average of the two measurements.
Cardiovascular risk measures
We analyzed six different markers of cardiovascular risk: 1) systolic blood pressure (BP), 2) diastolic BP, 3) triglycerides, 4) total cholesterol, 5) high-density lipoprotein (HDL) cholesterol, and 6) low-density lipoprotein (LDL) cholesterol.
Brachial systolic and diastolic BP was measured with an automated oscillometric BP recorder (Omron M6 comfort, Omron Healthcare). BP was measured three times at the health examination after a 10-minute rest with the participants sitting down and calculated as the average of the three measurements.
To assess plasma lipid levels, venous blood samples were collected after an overnight fast. Plasma for analysis of total cholesterol, triglycerides, and HDL cholesterol levels was prepared and analyzed at the Clinical Chemistry Department at Steno Diabetes Center in Gentofte, Denmark. LDL cholesterol was calculated based on total cholesterol, HDL cholesterol, and very low-density lipoprotein using the Friedewald equation (18).
Covariate measures
All participants without known diabetes received a standard 75-g oral glucose tolerance test after an overnight fast. Type 2 diabetes and prediabetes was classified according to the WHO criteria (2005); and thus, screen-detected diabetes was defined as fasting plasma glucose at least 7.0 mmol/L and/or post-oral glucose tolerance test 2-hour plasma glucose at least 11.1 mmol/L, and prediabetes included people with impaired fasting glucose (6.1 ≤ fasting plasma glucose < 7.0 mmol/L) and/or impaired glucose tolerance (7.8 ≤ 2-hour plasma glucose < 11.1 mmol/L) (19). Participants with known diabetes were identified based on information from the participants' general practitioners and self reports and excluded from the present analysis, because they were not fasting for an ultrasound assessment of VAT and SAT.
Body mass index (BMI) was calculated as weight divided by height squared (kg/m2). Weight was assessed with the participants not wearing shoes or coat, and height was measured to the nearest millimeter using a fixed rigid stadiometer. Information on physical activity energy expenditure (PAEE) was assessed using a modified version of the Recent Physical Activity Questionnaire (RPAQ) (20). The RPAQ contains questions regarding physical activity performed in the last 4 weeks in four domains: activity at home, during work, during leisure time, and during transportation (20). From information in the questionnaire PAEE was calculated by means of the 2005 Oxford model (21). Smoking status, alcohol consumption, and current use of antihypertensive and lipid-lowering medication were obtained from a general questionnaire. Information on age and sex were derived from the Danish personal identification number.
Statistical analysis
Multiple linear regression analyses were used to assess the associations of VAT and SAT with the continuous cardiovascular risk factors. VAT and SAT were standardized to a mean of 0 and a SD of 1 to facilitate comparison between the beta coefficients. For analyses stratified by sex, the VAT and SAT standardization was sex specific.
The residuals of plasma triglycerides and HDL cholesterol tended to be nonnormally distributed; and therefore, analyses of these variables were performed both with and without log transformation. The results from the analyses with log-transformed variables did not differ substantially from those using variables on the normal scale, and therefore only the results using variables on the normal scale are presented.
VAT and SAT were included simultaneously in the statistical models to assess the independent associations of the two obesity measures. Adjustments were made for sex, age, smoking, alcohol consumption, PAEE, glucose tolerance status (GTS), medication use, and BMI.
Interactions of VAT and SAT with sex and GTS (normal glucose tolerance [NGT], prediabetes [impaired fasting glucose and/or impaired glucose tolerance] or diabetes) were tested and results were stratified by both sex and GTS.
All statistical analyses were conducted using the statistical software SAS, version 9.3 (SAS Institute Inc.). P < .05 was considered statistically significant in all the analyses.
Results
The study population consisted of 1412 individuals (53.7% men), of whom 797 had NGT, 479 had prediabetes, and 136 had screen-detected diabetes. The characteristics of the study population are presented in Table 1 stratified by GTS. The mean depths of VAT and SAT were 9.0 (±2.7) cm and 2.3 (±0.9) cm in men and 8.5 (±2.7) cm and 2.6 (±1.0) cm in women.
Characteristics of the Study Population by Glucose Tolerance Status
| Characterisitic | N | NGT (n = 797) | Prediabetes (n = 479) | Diabetes (n = 136) |
|---|---|---|---|---|
| Age, y | 1412 | 65.7 ± 7.3 | 67.0 ± 6.4 | 66.2 ± 6.3 |
| BMI, kg/m2 | 1412 | 25.9 ± 4.0 | 27.7 ± 4.3 | 29.2 ± 4.7 |
| VAT, cm | 1412 | 7.3 ± 2.3 | 8.5 ± 2.7 | 10.0 ± 3.1 |
| SAT, cm | 1412 | 2.5 ± 1.1 | 2.6 ± 1.0 | 2.5 ± 1.0 |
| PAEE, kJ/kg/d | 1412 | 51.0 ± 22.2 | 51.2 ± 25.8 | 55.1 ± 24.3 |
| Systolic BP, mm Hg | 1410 | 130.8 ± 17.6 | 136.3 ± 17.9 | 138.0 ± 17.5 |
| Diastolic BP, mm Hg | 1410 | 80.0 ± 9.9 | 82.3 ± 10.6 | 83.5 ± 10.6 |
| Triglycerides, mg/dL | 1412 | 19.8 ± 10.7 | 23.4 ± 12.1 | 28.4 ± 18.9 |
| Total cholesterol, mg/dL | 1412 | 99.6 ± 18.7 | 97.2 ± 19.1 | 98.1 ± 18.7 |
| HDL cholesterol, mg/dL | 1412 | 29.3 ± 7.9 | 27.9 ± 7.6 | 26.2 ± 8.6 |
| LDL cholesterol, mg/dL | 1407 | 61.3 ± 17.1 | 58.8 ± 17.1 | 59.5 ± 17.7 |
| Men, n (%) | 385 (48.3) | 281 (58.7) | 92 (67.7) | |
| Smoking | ||||
| Current smoker | 234 | 133 (16.7) | 75 (15.7) | 26 (19.1) |
| Ex-smoker | 666 | 334 (43.1) | 246 (51.4) | 76 (55.8) |
| Nonsmoker | 512 | 320 (40.2) | 158 (33.0) | 34 (25.0) |
| High alcohol consumptiona | 490 | 237 (29.7) | 201 (42.0) | 52 (38.2) |
| Antihypertensive medication | 563 | 259 (32.5) | 234 (48.9) | 70 (51.5) |
| Lipid-lowering medication | 354 | 161 (20.2) | 146 (30.5) | 47 (34.6) |
Data are presented as either mean ± sdor n (%).
Defined as >14 U/wk (men) or >7 U/wk (women).
Results from the overall and sex-stratified linear regression analyses are presented in Table 2, whereas the GTS-stratified results are presented in Table 3. In the entire population, higher SAT was associated with higher total cholesterol levels and LDL cholesterol levels, and lower HDL cholesterol levels. Higher VAT was associated with higher triglyceride levels and lower HDL cholesterol levels. Stratification by sex brought more detail to the overall findings by showing that the VAT-triglyceride association was significantly stronger for men than for women, whereas the SAT-triglyceride association was found only in women (Figure 1). A similar finding was seen for the SAT-HDL cholesterol associations with only women having lower HDL cholesterol for higher SAT levels (Table 2). Furthermore, neither VAT nor SAT was associated with BP in the entire population. However, when stratifying by GTS higher SAT was associated with higher BP in participants with diabetes but not in participants with NGT or prediabetes.
Overall and Sex-Stratified Associations of VAT and SAT (1 sdas the Unit) With Cardiovascular Risk Factors Adjusted for Age, Sex, Smoking, Alcohol, GTS, PAEE, BMI, Medication Use, and VAT Adjusted for SAT and Vice Versa
| Overall | Men | Women | P Value | |
|---|---|---|---|---|
| Systolic BP, mm Hg | ||||
| VAT | 0.48 (−0.87; 1.82) | 0.39 (−1.3; 2.07) | 0.64 (−1.2; 2.47) | .76 |
| SAT | 0.66 (−0.45; 1.77) | 1.03 (−0.27; 2.34) | 0.20 (−1.6; 1.97) | .37 |
| Diastolic BP, mm Hg | ||||
| VAT | 0.57 (−0.21; 1.36) | 0.82 (−0.19; 1.83) | 0.27 (−0.77; 1.3) | .87 |
| SAT | 0.59 (−0.06; 1.24) | 0.75 (−0.03; 1.53) | 0.28 (−0.71; 1.28) | .71 |
| Triglycerides, mg/dL | ||||
| VAT | 2.87 (1.95; 3.8) | 3.29 (1.92; 4.66) | 1.69 (0.75; 2.63) | .02 |
| SAT | 0.23 (−0.54; 0.99) | −0.56 (−1.62; 0.51) | 1.36 (0.46; 2.26) | .03 |
| Total cholesterol, mg/dL | ||||
| VAT | 1.27 (−0.04; 2.58) | 1.72 (0.08; 3.36) | 0.63 (−1.13; 2.4) | .29 |
| SAT | 1.91 (0.83; 3.00) | 1.33 (0.05; 2.61) | 2.49 (0.79; 4.18) | .26 |
| HDL cholesterol, mg/dL | ||||
| VAT | −1.1 (−1.63; −0.57) | −0.63 (−1.25; −0.001) | −1.35 (−2.12; −0.59) | .54 |
| SAT | −0.73 (−1.17; −0.29) | −0.08 (−0.57; 0.4) | −1.48 (−2.22; −0.75) | .02 |
| LDL cholesterol, mg/dL | ||||
| VAT | 1.16 (−0.03; 2.34) | 1.01 (−0.47; 2.49) | 1.21 (−0.4; 2.82) | .81 |
| SAT | 2.51 (1.53; 3.49) | 1.63 (0.48; 2.77) | 3.34 (1.79; 4.88) | .10 |
Data are change per 1 sdchange in VAT or SAT (95% confidence interval). P values are tests for interaction term sex × VAT or sex × SAT. Bold text illustrates significant association.
All: 1 sdVAT = 2.67 cm; 1 sdSAT = 1.05 cm.
Men: 1 sdVAT = 2.69 cm; 1 sdSAT = 0.91 cm. Women: 1 sdVAT = 2.15 cm; 1 sdSAT = 1.12 cm.
GTS Stratified Associations of VAT and SAT (1 sdas the unit) With Cardiovascular Risk Factors Adjusted for Age, Sex, Smoking, Alcohol, PAEE, BMI, Medication Use and VAT Adjusted for SAT and Vice Versa
| NGT | Prediabetes | Diabetes | P Value | |
|---|---|---|---|---|
| Systolic BP, mm Hg | ||||
| VAT | 0.54 (−1.36; 2.45) | −0.08 (−2.31; 2.16) | 2.54 (−0.88; 5.96) | .02 |
| SAT | −0.46 (−1.88; 0.97) | 1.52 (−0.53; 3.58) | 3.32 (0.01; 6.64) | .43 |
| Diastolic BP, mm Hg | ||||
| VAT | 0.63 (−0.48; 1.73) | 0.20 (−1.1; 1.49) | 1.80 (−0.31; 3.91) | .05 |
| SAT | 0.01 (−0.81; 0.84) | 0.92 (−0.27; 2.1) | 2.69 (0.65; 4.74) | .16 |
| Triglycerides, mg/dL | ||||
| VAT | 2.07 (0.9; 3.23) | 3.50 (2.05; 4.95) | 3.81 (−0.1; 7.72) | .56 |
| SAT | −0.41 (−1.28; 0.46) | 0.96 (−0.38; 2.29) | −0.38 (−4.16; 3.4) | .62 |
| Total cholesterol, mg/dL | ||||
| VAT | 1.92 (−0.03; 3.87) | 1.20 (−0.8; 3.21) | −1.15 (−4.56; 2.27) | .33 |
| SAT | 1.51 (0.05; 2.98) | 2.51 (0.66; 4.36) | 1.22 (−2.08; 4.51) | .83 |
| HDL cholesterol, mg/dL | ||||
| VAT | −0.20 (−0.96; 0.57) | −1.79 (−2.61; −0.97) | −2.34 (−3.96; −0.71) | .65 |
| SAT | −0.59 (−1.16; −0.01) | −0.65 (−1.4; 0.1) | −1.45 (−3.01; 0.12) | .72 |
| LDL cholesterol, mg/dL | ||||
| VAT | 1.11 (−0.65; 2.87) | 1.66 (−0.15; 3.47) | −0.27 (−3.37; 2.83) | .34 |
| SAT | 2.22 (0.9; 3.54) | 2.67 (1.02; 4.32) | 2.83 (−0.16; 5.83) | .50 |
Data are change per 1 sdchange in VAT or SAT (95% confidence interval). P values are tests for interaction term GTS × VAT or GTS × SAT. Bold text illustrates significant association.
All: 1 sdVAT = 2.67 cm; 1 sdSAT = 1.05 cm.
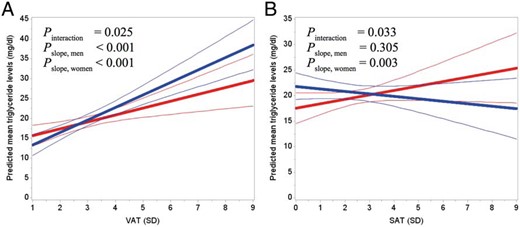
A, Predicted mean triglyceride levels as a function of VAT for men (blue) and women (red). B, Predicted mean triglyceride levels as a function of SAT for men (blue) and women (red). Thin lines show the 95% confidence interval. Predictions were made for persons with the following characteristics: 66 years, nonsmoker, low alcohol consumption, no medication use, NGT, PAEE of 52 kJ/kg/d, BMI of 27 kg/m2, and SAT of 3 SD or VAT of 3 SD. Pslope indicates whether the slope is different from 0.
Discussion
In a large Danish population of men and women at low to high risk of diabetes or with screen-detected diabetes, we found that both VAT and SAT were associated with increased cardiovascular risk independent of each other and of overall obesity. Moreover, we found slightly different associations for men and women, as SAT was associated with more cardiovascular risk factors in women than in men, whereas VAT was associated with more cardiovascular risk factors in men than in women. The associations for participants with NGT, prediabetes, and screen-detected type 2 diabetes also differed slightly.
Blood pressure and plasma lipids
Previous studies have found that higher VAT was associated with increased BP (8, 22, 23). Yet, some studies have also reported no association between VAT and BP (6, 7, 9). In the present study, VAT was not associated with higher BP, which may be attributable to the high antihypertensive medication use in the study population (39.9%) (9, 23). This was attempted eliminated by adjusting for antihypertensive medication use; however, this adjustment may have been insufficient. Another possible explanation for the inconsistencies in the findings relates to the different levels of disease progression in the study populations. The participants in the studies reporting no association between VAT and BP were characterized by being obese and having diabetes (6, 7, 9). Conversely, the participants in the studies reporting an association were healthier as they were untreated and free of clinical CVD (8, 23, 25). This is consistent with the present study, as a large part of the population was characterized by having prediabetes or diabetes. Furthermore, we found a modifying effect of GTS on the relationship between VAT and diastolic BP, but given that the associations were not significant in either of the groups, our results do not support that the association between VAT and BP differs between individuals with and without diabetes. Of interest, we found a significant association between higher SAT levels and higher BP in participants with diabetes, which could suggest that SAT may exert more detrimental effects on cardiovascular risk when glucose tolerance worsens.
In accordance with previous studies (6–9, 23–25), we found that higher VAT was associated with higher triglyceride levels and lower HDL cholesterol levels in the entire population. One potential mechanism responsible for this finding could be that VAT is characterized by high rates of lipolysis leading to an overflow of free fatty acids. Given that most VAT depots are drained by the hepatic portal vein, the liver is exposed to high amounts of free fatty acids, which may directly modify the liver's production and removal of plasma lipoproteins leading to hypertriglyceridemia (26).
Of interest, higher SAT was also associated with a dyslipidemic profile independent of VAT and overall obesity. A possible explanation for this may relate to the regional distribution of SAT. It has been suggested that peripheral SAT on the hips and thigh confer a more favorable phenotype compared with abdominal SAT (6, 27), but we only measured abdominal SAT in our study. In addition, it has been reported that abdominal SAT has both superficial and deep components, which may have opposite effects (28). Thus, different results might have been found if SAT had been divided into these two components.
Effect modification by sex and glucose tolerance status
Sex differences in fat distribution are well documented. Women are generally characterized by having more SAT, whereas men are more prone to high amounts of VAT (24), which is consistent with our findings. Furthermore, previous studies found stronger associations of VAT and SAT with cardiovascular risk factors in women compared with men (4, 7, 8, 23). In accordance with these findings, we found that the associations of SAT with triglycerides and HDL cholesterol were only present in women. On the contrary, we found that the association between VAT and total cholesterol were only present in men and that the association between VAT and triglycerides were stronger in men compared with women. Surprisingly however, the associations of VAT and SAT with all other cardiovascular risk factors were more or less similar in men and women. The discrepancy between our results and previous findings could be related to ethnic differences, because previous studies have reported that the association between VAT and cardiovascular risk depends on ethnicity (29, 30). The ethnicity of the participants in the studies reporting stronger associations in women were African-American, Asian, or multiethnic, whereas the ADDITION-PRO study population in the present study was primarily Caucasian (97%). Thus, one explanation for the inconsistent findings could be that effect modification by sex might be more apparent in non-Caucasian populations.
It has previously been shown that the associations of VAT with cardiovascular risk factors do not differ by GTS (9). Our findings to some extent support this notion. The association of VAT with systolic BP observed in our study were modified by GTS, but no significant associations were found for either of the groups.
Adjustment for obesity measures
To examine the independent associations of VAT and SAT with the cardiovascular risk factors, VAT and SAT were included simultaneously in the statistical models. Some studies include VAT and SAT simultaneously in the models (6, 8, 23), whereas others include them in separate models (7, 22, 25). In a review from 2011, Tchernof et al (24) stressed the importance of adjusting for SAT when examining associations of VAT with cardiovascular risk factors, and vice versa when examining SAT. Tchernof et al (24) argue that because all adiposity measures are related to cardiovascular risk factors, SAT will most likely show correlations of the same magnitude as VAT if this procedure is not followed. Thus, the methodological approach put forward by Tchernof et al (24) was chosen in our study.
We additionally adjusted for BMI in the analyses because we wanted to study whether VAT and SAT explained variation in cardiovascular risk above and beyond overall obesity. Other easily obtainable measures of obesity or body size such as waist circumference or height could have been included in the statistical models instead of BMI. However, due to the indirect, one-dimensional estimate of VAT and SAT, these measures were closely related and potentially correlated with waist circumference, increasing the risk of spurious findings if waist circumference was included in the models (31, 32). Although BMI seems to be the most commonly used approach to adjust for overall body size in other abdominal fat distribution studies (4–9, 23, 25), some studies have adjusted for waist circumference either alone or in combination with BMI (8, 23). Therefore, we also performed the statistical analyses adjusted for waist circumference and height instead of BMI, but this did not alter any of our findings.
Strengths and limitations
The ADDITION-PRO study provides a unique cohort of men and women at low to high risk of diabetes or with screen-detected diabetes who underwent objective and detailed measurements of fat distribution and cardiovascular risk. Furthermore, collection of information on relevant confounders enabled adjustment for a sufficient set of confounders.
Few studies have examined the relationship between fat distribution assessed by ultrasound and cardiovascular risk (14, 15). Ultrasound has been validated against the gold standard techniques (magnetic resonance imaging [MRI] and computed tomography [CT]) for assessing fat distribution and it was found to be a valid and reliable technique (10, 12, 13). Furthermore, the reproducibility of the ultrasound technique used in the present study was recently examined and reported to be adequate (11). Comparison of findings obtained with different methods should be performed with caution, but the present study extends current literature by finding consistent results with previous studies using the highly accessible ultrasound technique instead of the more expensive and time-consuming MRI or CT techniques. MRI and CT techniques may still be the method of choice for smaller hospital– or laboratory-based clinical studies, and does allow detailed assessment of visceral fat deposits around the organs, which could have implications for cardiovascular risk. However, the present study strengthens the assumption that ultrasound is a feasible and applicable technique, which should be considered as means of assessing fat distribution in large-scale epidemiological studies.
In our study, there was a higher fraction of individuals with prediabetes or screen-detected diabetes than in the general population. This ensured that reliable estimates could be generated for these subgroups. Furthermore, the relative large sample size provided adequate power to detect potentially small but significant associations of VAT and SAT with cardiovascular risk. It should be noted, however, that we performed a relatively large number of statistical analyses and therefore some of the borderline significant findings should be interpreted with caution.
Due to the cross-sectional design of the analysis it was not possible to address the issue of causality. Furthermore, as the association between fat distribution and cardiovascular risk may be different at younger ages than at the ones examined (24), the results should only be generalized to populations within the same age range. In addition, as previous research has shown that the association between VAT and cardiovascular risk depends on ethnicity (29, 30), generalization beyond Caucasian populations may be questionable.
In conclusion, this study showed that both VAT and SAT are associated with cardiovascular risk in a population of men and women at low to high risk of diabetes or with screen-detected diabetes. In particular, SAT is associated with cardiovascular risk in women. Prospective studies examining whether changes in VAT and SAT are related to concomitant changes in cardiovascular risk are needed to determine whether abdominal fat loss should be recommended as part of a preventive strategy.
Acknowledgments
We acknowledge all the ADDITION-PRO participants and the participating general practitioners for their contribution to the study. We also thank all the teams of the different clinical research centers and Anneli Sandbæk and Knut Borch-Johnsen.
The ADDITION-Denmark study was supported by the National Health Services in the counties of Copenhagen, Aarhus, Ringkøbing, Ribe, and Southern Jutland in Denmark; the Danish Council for Strategic Research; the Danish Research Foundation for General Practice; Novo Nordisk Foundation; the Danish Centre for Evaluation and Health Technology Assessment; the Diabetes Fund of the National Board of Health; the Danish Medical Research Council; and the Aarhus University Research Foundation. In addition, the ADDITION-PRO study was funded by an unrestricted grant from the European Foundation for the Study of Diabetes/Pfizer for Research into Cardiovascular Disease Risk Reduction in Patients with Diabetes (74550801), the Danish Council for Strategic Research, and internal research and equipment funds from Steno Diabetes Center. N.B.J. and D.R.W. are funded by the Danish Diabetes Academy supported by the Novo Nordisk Foundation.
Author Contributions: S.H.S., K.F., and G.S.A. conceived the idea, analyzed and interpreted the data, and drafted the manuscript. A.P., N.B.J., and D.R.W. designed the study, contributed to the discussion, and reviewed and edited the manuscript. M.E.J., T.L., I.A., and B.C. contributed to the discussion and reviewed and edited the manuscript. D.R.W., M.E.J., and T.L. are principal investigators of the ADDITION-PRO study. All authors approved the final manuscript.
Disclosure Summary: K.F., M.E.J., N.B.J., B.C., and G.S.A. are employed by Steno Diabetes Center A/S, which is a research and teaching hospital collaborating with the Danish National Health Service and owned by Novo Nordisk A/S. Steno Diabetes Center receives part of its core funding from unrestricted grants from the Novo Foundation and Novo Nordisk A/S. K.F., N.B.J., D.R.W., and M.E.J. own shares in Novo Nordisk A/S. S.H.S., A.P., I.A., and T.L. declare no conflicts of interests associated with this manuscript.
Abbreviations
- BMI
body mass index
- BP
blood pressure
- CT
computed tomography
- CVD
cardiovascular disease
- GTS
glucose tolerance status
- HDL
high-density lipoprotein
- MRI
magnetic resonance imaging
- NGT
normal glucose tolerance
- PAEE
physical activity energy expenditure
- RPAQ
Recent Physical Activity Questionnaire
- SAT
subcutaneous adipose tissue
- VAT
visceral adipose tissue
- WHO
World Health Organization.
