


Tight glucose control (TGC) reduces morbidity and mortality in patients undergoing elective cardiac surgery, but only limited data about its optimal timing are available to date.
The purpose of this article was to compare the effects of perioperative vs postoperative initiation of TGC on postoperative adverse events in cardiac surgery patients.
This was a single center, single-blind, parallel-group, randomized controlled trial.
The setting was an academic tertiary hospital.
Participants were 2383 hemodynamically stable patients undergoing major cardiac surgery with expected postoperative intensive care unit treatment for at least 2 consecutive days.
Intensive insulin therapy was initiated perioperatively or postoperatively with a target glucose range of 4.4 to 6.1 mmol/L.
Adverse events from any cause during postoperative hospital stay were compared.
In the whole cohort, perioperatively initiated TGC markedly reduced the number of postoperative complications (23.2% vs 34.1%, 95% confidence interval [CI], 0.60–0.78) despite only minimal improvement in glucose control (blood glucose, 6.6 ± 0.7 vs 6.7 ± 0.8 mmol/L, P < .001; time in target range, 39.3% ± 13.7% vs 37.3% ± 13.8%, P < .001). The positive effects of TGC on postoperative complications were driven by nondiabetic subjects (21.3% vs 33.7%, 95% CI, 0.54–0.74; blood glucose 6.5 ± 0.6 vs 6.6 ± 0.8 mmol/L, not significant; time in target range, 40.8% ± 13.6% vs 39.7% ± 13.8%, not significant), whereas no significant effect was seen in diabetic patients (29.4% vs 35.1%, 95% CI, 0.66–1.06) despite significantly better glucose control in the perioperative group (blood glucose, 6.9 ± 1.0 vs 7.1 ± 0.8 mmol/L, P < .001; time in target range, 34.3% ± 12.7% vs 30.8% ± 11.5%, P < .001).
Perioperative initiation of intensive insulin therapy during cardiac surgery reduces postoperative morbidity in nondiabetic patients while having a minimal effect in diabetic subjects.
Elevated blood glucose is strongly associated with increased morbidity and mortality of patients with a critical illness or undergoing a major surgical procedure (1–4). In 2001, the landmark Leuven trial performed in a surgical intensive care unit (ICU) demonstrated that tight glucose control (TGC) using intravenous intensive insulin therapy (IIT) aimed to maintain euglycemia (4.4–6.1 mmol/L) substantially reduced in-hospital mortality and the number of postoperative complications (5). Several other studies confirmed the positive effects of TGC on selected postoperative outcomes (6–8), whereas other trials on more heterogeneous ICU populations did not show significant benefits (9, 10). The largest multicenter NICE-SUGAR trial even demonstrated increased mortality in patients with TGC, most likely attributable to increased incidence of hypoglycemia (11). A recent meta-analysis including all major randomized trials in ICUs showed a significant benefit of TGC in surgical but not nonsurgical ICU patients (12). Despite these rather inconsistent findings, the need to control elevated glucose levels in critically ill patients is generally accepted, although target ranges are mostly set higher than those in the original Leuven trial.
Although the concept of TGC has been studied intensively, the optimal timing of TGC initiation in surgical patients remains elusive despite the fact that excessive hyperglycemia during surgery was shown to be an independent predictor of perioperative morbidity and mortality (13, 14). Only a few small studies comparing intraoperative vs postoperative TGC initiation were published with rather inconsistent results (15, 16). A recent meta-analysis of 5 randomized controlled trials comparing intensive and conventional insulin therapy during cardiac surgery did not show any benefit of the former except of reduced infection rates (17). It is thus currently unclear whether perioperative initiation of TGC affects patients' outcomes.
To this end, we performed a randomized controlled trial (RCT) comparing the effects of perioperative vs postoperative initiation of TGC on postoperative adverse events in cardiac surgery patients.
Subjects and Methods
Trial design and population
We conducted a single-center, single-blind, parallel-group, RCT involving adult cardiac surgery patients (aged 18–90 years) in an academic tertiary hospital in Prague, Czech Republic, between January 2007 and June 2012. The study was registered at Clinicaltrials.gov (registration number NCT01548963). Eligible participants were all hemodynamically stable patients undergoing major cardiac surgery with expected postoperative ICU treatment for at least 2 consecutive days. Exclusion criteria included allergy to insulin, mental incapacity, language barrier, and refusal to participate in the study. Severe hemodynamic instability during the surgery, patient's rejection of further participation, or loss to follow-up were set as study discontinuation criteria. Informed consent was obtained from all participants before being enrolled into the trial. The study was approved by the Human Ethics Review Board of General University Hospital in Prague, Czech Republic, and was performed in accordance with the guidelines proposed in the Declaration of Helsinki.
Study interventions
Study participants were randomly assigned to 2 treatment groups: the perioperative (PERI) group with intraoperative and postoperative TGC and the postoperative (POST) group with only postoperative TGC. In the PERI group, IIT was initiated at any time from the beginning of cardiac surgery if blood glucose levels exceeded 6.1 mmol/L, whereas in the POST group, IIT was started after the admission to the postoperative ICU, and every time blood glucose during the operation exceeded 10 mmol/L an iv bolus of 1 to 2 IU of rapid-acting insulin was administered to keep glucose values under this threshold. In both groups, TGC lasted until the end of the ICU stay or until oral intake was restored. The target blood glucose range was set at 4.4 to 6.1 mmol/L. For post hoc result analysis and to better reflect the current, more moderate, glucose control approach a second range of less stringent glucose control was defined as 4.4 to 8.3 mmol/L. For allocation of participants to one of the study groups, a simple randomization procedure according to a computer-generated list of random numbers was used. Only the study coordinator and the operation staff were aware of the treatment assignment; the patients themselves and the postoperative ICU staff and outcome assessors and data analysts were kept blinded to the treatment allocation.
IIT protocols
Two protocols for TGC were used during the trial: the primarily used Matias protocol, which is essentially a modified Leuven protocol with the addition of insulin boluses, was later replaced by the computer-based eMPC (enhanced model predictive control) protocol with variable sampling rates, which in previous trials proved to be superior in terms of efficacy as well as safety (18, 19). Both protocols were described in detail elsewhere (18). Human rapid-acting insulin (Actrapid HM; Novo Nordisk) was given via a central venous line as a continuous infusion alone or in combination with insulin boluses (when the Matias protocol was applied). A standard concentration of 50 IU of insulin in 50 mL of 0.9% NaCl was used.
Blood glucose measurement and glucose infusion
Blood glucose samples were obtained from an arterial line whenever possible; otherwise, a central venous line was used. Capillary samples were not used during the ICU stay but became acceptable after the patient was discharged to a standard ward. Blood glucose levels were assessed by a blood gas analyzer (86.9% of samples, ABL 700; Radiometer Medical–) or a standard point-of-care glucometer (13.1% of samples, ACCU-CHEK Inform system; F. Hoffmann La-Roche AG–). The blood sampling rate was guided by the protocol applied. During operations, blood glucose was measured every 1 hour with the frequency increasing to every 30 minutes in the on-pump period. In all patients, infusion of a 10% glucose solution with a glucose dose of 6.7 g/h was initiated upon the admission to the postoperative ICU and was continued for approximately 18 hours, when oral food intake was reestablished. In patients receiving mechanical ventilation, the glucose infusion lasted for 48 hours and was then replaced by standard enteral nutrition.
Data collection
Patient history and clinical parameters including age, sex, race, height, weight, body mass index (BMI), EuroSCORE (the European System for Cardiac Operative Risk Evaluation), history of diabetes mellitus, and type of surgery were collected prospectively. Blood glucose levels were recorded from the beginning of the operation until the end of the postoperative hospital stay. Perioperative and postoperative adverse events, medication, and nutrition were continuously monitored and documented.
Outcome measures
The primary study endpoint was defined as the number of adverse events from any cause during the postoperative hospital stay and included following newly developed organ dysfunctions: cardiovascular (low cardiac output syndrome, postoperatively initiated inotropic support or intraaortic balloon counterpulsation, acute myocardial ischemia, moderate to severe arrhythmias, and cardiopulmonary resuscitation); respiratory (acute pneumonia, fluidothorax of >300 ml, reintubation, and acute respiratory distress syndrome/acute lung injury), neurological (stroke and transient ischemic attack), gastrointestinal (GI) (ileus, gastric ulcer, GI bleeding, hepatopathy, acute pancreatitis, and need for parenteral nutrition), renal (acute kidney injury defined by RIFLE criteria–stage injury and above), and infections defined by the clinical picture and the need for systemic antibiotic therapy (detailed criteria for all selected adverse events are listed in the Supplemental Material). All events were evaluated according to the prespecified criteria by attending ICU physicians who were blinded to the treatment assignment. Parameters of glucose control (average blood glucose, time in, above, and below the target range, time in hyperglycemia of >8.3 mmol/L, and number of hypoglycemic episodes) and postoperative hospital stay length were set up as secondary endpoints. Severe hypoglycemia was defined as blood glucose of <2.2 mmol/L.
Statistical analysis
To detect an overall difference of 10% in postoperative complications between the treatment groups with a two-sided 0.1% significance level and a power of 99%, a sample size of 2400 patients in the whole cohort was necessary, assuming a baseline postoperative morbidity of 30%. To include this number of patients, a 3-year inclusion period with 800 patients per year was anticipated. One interim analysis was performed after 1400 patients had been enrolled with the P value maintained at 0.1%, confirming the formerly calculated sample size. Numerical data from both groups were compared using the Student t test or the Mann-Whitney rank sum test as appropriate. Categorical data were analyzed with a 2-sample proportion test using standard approximation. The difference between the primary endpoints was expressed as relative risk reduction with a 95% confidence interval (CI). The significance level was set at P = .05. To correct for baseline bias, an adjustment analysis using logistic regression or negative binomial regression and ANOVA or a likelihood ratio test, as appropriate, was performed.
Results
Baseline characteristics of study subjects
A total of 2383 subjects were randomized into the trial between January 2007 and December 2010, 1134 in the PERI group and 1249 in the POST group. The detailed enrollment process is depicted in the consort diagram (Figure 1). Patients in the POST group were slightly older with a higher prevalence of diabetes mellitus and chronic kidney disease (CKD) together with a higher EuroSCORE. Other baseline parameters including BMI, left ventricular ejection fraction and baseline creatinine were comparable between the two groups (Table 1).
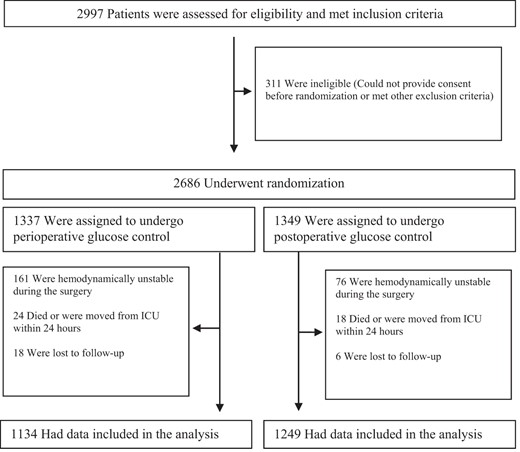
Assessment, randomization and follow-up of study patients.
Baseline Characteristics of Study Subjects
| Whole Cohort | Nondiabetic Subjects | Diabetic Subjects | ||||
|---|---|---|---|---|---|---|
| PERI Group | POST Group | PERI Group | POST Group | PERI Group | POST Group | |
| No. of patients | 1134 | 1249 | 869 | 910 | 265 | 339 |
| Females, n (%) | 323 (28.6) | 372 (29.8) | 243 (28.0) | 263 (28.9) | 80 (30.7) | 109 (32.2) |
| Age, y | 64.7 ± 11.1 | 66.6 ± 9.7a | 64.4 ± 11.5 | 65.8 ± 10.0 | 65.8 ± 9.3 | 68.8 ± 8.3a |
| BMI, kg/m2 | 28.4 ± 5.6 | 28.2 ± 4.3 | 27.8 ± 5.6 | 27.9 ± 4.3 | 30.3 ± 5.4 | 29.0 ± 4.3b |
| Diabetes mellitus, n (%) | 265 (23.4) | 339 (27.1)b | 0 | 0 | 265 | 339 |
| Neurological disease, n (%) | 108 (9.5) | 106 (8.5) | 79 (9.1) | 64 (7.0) | 29 (10.9) | 42 (12.4) |
| COPD, n (%) | 157 (13.8) | 193 (15.5) | 109 (12.5) | 142 (15.6) | 48 (18.1) | 51 (15.0) |
| CKD, n (%) | 43 (3.8) | 78 (6.2)c | 24 (2.8) | 46 (5.1)b | 19 (7.2) | 32 (9.4) |
| Renal replacement therapy, n (%) | 9 (0.8) | 14 (1.1) | 6 (0.7) | 9 (1.0) | 3 (1.1) | 5 (1.5) |
| Smoker, n (%) | 250 (22.0) | 270 (21.6) | 200 (23.0) | 214 (23.5) | 50 (18.9) | 56 (16.5) |
| Baseline creatinine, μmol/L | 99.4 ± 61.9 | 99.3 ± 53.5 | 95.9 ± 52.6 | 97.1 ± 48.3 | 110.9 ± 84.8 | 105.2 ± 65.1 |
| LV EF (%) | 55.8 ± 13.3 | 55.2 ± 13.8 | 55.8 ± 13.2 | 55.8 ± 13.6 | 55.8 ± 13.6 | 53.6 ± 14.4b |
| Additive EuroSCORE | 3.8 ± 2.2 | 4.2 ± 2.3a | 3.8 ± 2.1 | 4.0 ± 2.3 | 3.8 ± 2.2 | 4.7 ± 2.4a |
| Logistic EuroSCORE | 7.2 ± 9.6 | 8.5 ± 12.2b | 7.3 ± 10.0 | 8.0 ± 11.8 | 6.8 ± 8.1 | 9.8 ± 13.1a |
| Elective surgery, n (%) | 1005 (88.6)c | 1048 (83.9) | 758 (87.2)b | 761 (83.6) | 247 (93.2)c | 287 (84.6) |
| CABG, n (%) | 790 (69.7) | 966 (77.3)a | 564 (64.9) | 672 (73.8)a | 226 (85.3) | 294 (86.7) |
| Aortic valve replacement, n (%) | 236 (20.8) | 237 (19.0) | 211 (24.3) | 200 (22.0) | 25 (9.4) | 37 (10.9) |
| Mitral valve replacement, n (%) | 143 (12.6) | 139 (11.1) | 121 (13.9) | 107 (11.8) | 22 (8.3) | 32 (9.4) |
| Other surgery types, n (%) | 106 (9.3)c | 75 (6.0) | 100 (11.5)c | 63 (6.9) | 6 (2.3) | 12 (3.5) |
| Off-pump surgery, n (%) | 412 (36.3) | 506 (40.5)b | 342 (39.4) | 361 (39.7) | 70 (26.4) | 145 (42.8)a |
| Extracorporeal circulation, n (%) | 722 (63.7)b | 743 (59.5) | 527 (60.6) | 549 (60.3) | 195 (73.6)c | 194 (57.2) |
| Extracorporeal circulation duration, min | 127.8 ± 82.4 | 135,1 ± 77.2b | 136.2 ± 75.7 | 137.9 ± 82.2 | 105.0 ± 95.5 | 127.7 ± 60.1a |
Abbreviations: COPD, chronic obstructive pulmonary disease; LV EF, left ventricular effusion fraction. Data are expressed as means ± SD or absolute number with relative percentage.
P < .001.
P < .05.
P < .01.
When divided according to the presence of diabetes mellitus, the baseline profiles of nondiabetic subjects in both the PERI and POST groups reflected the situation in the whole cohort with no difference in most of the baseline parameters except of CKD prevalence. In contrast, subjects with diabetes showed increased age and EuroSCORE, decreased BMI and slightly reduced left ventricular ejection fraction, but there was no difference in the number of patients with CKD in the POST group than in PERI group (Table 1).
Types of surgery
Elective operations dominated the spectrum of surgical procedures, with acute operations being performed in approximately 10% to 15% of all subjects. Coronary artery by-pass grafting (CABG) was the most prevalent type of surgery. Other types included aortic, mitral, and tricuspidal valve repair or replacement, thoracic aortic surgery, and pulmonary endarterectomy (Table 1).
Glucose control
During the ICU stay, only minimal differences in the main parameters of glucose control were observed between the two study cohorts, favoring almost exclusively the PERI group, including average blood glucose and time in hyperglycemia as well as the number of hypoglycemic episodes (Table 2). These differences were even less pronounced in the nondiabetic subgroup with comparable average ICU glycemia and time in the target range and reduced number of hypoglycemic episodes. In contrast, subjects with diabetes mellitus in the PERI group showed slightly tighter glucose control as demonstrated by decreased ICU and intraoperative glycemia and longer time spent in the target range, with no significant difference in the occurrence of hypoglycemia, even though the time under the target range was increased. Episodes of severe hypoglycemia (<2.2 mmol/L) were comparably low in all study subgroups (Table 2). During the operation period intravenous insulin was administered to 95.1% of all subjects in the PERI group (94.1% in the nondiabetic and 98.1% in the diabetic subgroup) and to 22.7% of subjects in the POST group (11.9% in the nondiabetic and 51.6% in the diabetic subgroup), respectively.
ICU Glucose Control (From the Beginning of Operation to the End of ICU Stay)
| Whole Cohort | Nondiabetic Subjects | Diabetic Subjects | ||||
|---|---|---|---|---|---|---|
| PERI Group | POST Group | PERI Group | POST Group | PERI Group | POST Group | |
| No. of patients | 1134 | 1249 | 869 | 910 | 265 | 339 |
| Average blood glucose, mmol/L | ||||||
| Whole period | 6.6 ± 0.7 | 6.7 ± 0.8a | 6.5 ± 0.6 | 6.6 ± 0.8 | 6.9 ± 1.0 | 7.1 ± 0.8a |
| Intraoperative period | 7.0 ± 1.4 | 7.4 ± 1.5a | 6.8 ± 1.1 | 7.0 ± 1.2a | 7.7 ± 1.9 | 8.3 ± 1.8a |
| Time in TGC target range (4.4–6.1 mmol/L), % | 39.3 ± 13.7a | 37.3 ± 13.8 | 40.8 ± 13.6 | 39.7 ± 13.8 | 34.3 ± 12.7a | 30.8 ± 11.5 |
| Time in GC range (4.4–8.3 mmol/L), % | 79.3 ± 13.3a | 75.8 ± 14.4 | 82.5 ± 11.1a | 79.7 ± 12.5 | 68.8 ± 14.6a | 65.2 ± 13.9 |
| Time above target range (>8.3 mmol/L), % | 14.5 ± 12.2 | 17.2 ± 13.5a | 12.5 ± 10.2 | 13.9 ± 11.8b | 21.1 ± 15.6 | 26.1 ± 13.8a |
| Time below target range (<4.4 mmol/L), % | 6.2 ± 5.7 | 7.0 ± 5.8a | 5.0 ± 5.2 | 6.4 ± 5.6a | 10.1 ± 5.7c | 8.7 ± 5.9 |
| Moderate hypoglycemia (2.2–3.2 mmol/L), no. of measurements/all measurements), % | 508/56 319 (0.9) | 703/62 855 (1.1)a | 267/40 766 (0.7) | 419/45 100 (0.9)a | 241/15 553 (1.5) | 266/17 755 (1.5) |
| Severe hypoglycemia <2.2 mmol/L (no. of measurements/all measurements), % | 44/56 319 (0.1) | 61/62 855 (0.1) | 20/40 766 (0.1) | 33/45 100 (0.1) | 24/15 553 (0.2) | 28/17 755 (0.2) |
Abbreviation: GC, glucose control. Data are expressed as means ± SD or absolute number with relative percentage.
P < .001.
P < .05.
P < .01.
Perioperative morbidity and mortality
In the whole cohort, the number of patients with postoperatively developed organ complications was significantly reduced in the PERI group compared with that in the POST group (23.2% vs 34.1%; relative risk [RR], 0.68; 95% CI [CI], 0.60–0.78). This decrease was driven by all types of dysfunctions except respiratory, with neurological and infectious complications showing the maximum reduction (Table 3). The favorable effects of intraoperatively initiated TGC were even more pronounced in nondiabetic subjects, achieving a reduction in risk of developing any kind of postoperative complication of 37% (21.3% of the PERI group vs 33.7% of the POST group; RR, 0.63; 95% CI, 0.54–0.74). Analogous to the whole cohort, only new-onset dysfunctions of the respiratory tract did not differ between the PERI and POST subgroups, whereas cardiovascular, renal, GI, neurological, and infectious complications were decreased to a similar or even greater extent than in the whole group (Table 4). Among subjects with diabetes mellitus, however, no difference could be seen between the PERI and POST groups in the incidence of postoperative complications of all types except cardiovascular (Table 4). With adjustment for baseline differences in age, prevalence of diabetes mellitus and CKD, logistic EUROSCORE, percentage of elective procedures, CABG, off-pump surgery, and extracorporeal circulation between the PERI and POST groups, all the results still retained their significance with the exception of renal complications in the whole cohort and GI adverse events in the nondiabetic group, which both slightly failed to cross the P < .05 threshold (RR, 0.55–1.01, P = .055 for renal complications and RR, 0.34–1.00, P = .05 for GI complications).
Perioperative Morbidity and Mortality: Whole Cohort
| PERI Group | POST Group | AD or RR (95% CI) | |
|---|---|---|---|
| No. of patients | 1134 | 1249 | 115 |
| Hospital stay length, days | 11.7 ± 8.1 | 12.2 ± 9.4 | 0.5 (−0.2 to 1.2) |
| ICU stay length, hours | 117.5 ± 132.1 | 115.5 ± 117.7 | 2.0 (−12.2 to 8.1) |
| Perioperative mortality, no of patients (%) | 37 (3.3) | 48 (3.8) | 0.85 (0.56 to 1.29) |
| Perioperative morbidity, no. of patients (%) | 263 (23.2) | 426 (34.1)a | 0.68 (0.60 to 0.78) |
| Complications, no. of events (%) | |||
| Cardiovascular | 135 (11.9) | 257 (20.6)a | 0.58 (0.48 to 0.70) |
| Respiratory | 72 (6.3) | 94 (7.5) | 0.84 (0.63 to 1.13) |
| Renal | 88 (7.8) | 131 (10.5)b | 0.74 (0.57 to 0.96) |
| Gastrointestinal | 33 (2.9) | 66 (5.3)c | 0.55 (0.37 to 0.83) |
| Neurological | 30 (2.6) | 82 (6.6)a | 0.40 (0.27 to 0.61) |
| Infectious | 36 (3.2) | 89 (7.1)a | 0.45 (0.31 to 0.65) |
Data are expressed as means ± SD or absolute number with relative percentage. The difference between the groups was expressed as absolute difference (AD) for numerical data or relative risk (RR) for categorical data, both with 95% CIs. The AD and RR values are unadjusted.
P < .001.
P < .05.
P < .01.
Perioperative Morbidity and Mortality: Nondiabetic and Diabetic Subjects
| Nondiabetic Subjects | Diabetic Subjects | |||||
|---|---|---|---|---|---|---|
| PERI Group | POST Group | AD or RR (95% CI) | PERI Group | POST Group | AD or RR (95% CI) | |
| No. of patients | 869 | 910 | 41 | 265 | 339 | 74 |
| Hospital stay length, days | 11.6 ± 7.9 | 11.6 ± 8.4 | 0.01 (−0.7 to 0.8) | 12.0 ± 8.7 | 13.6 ± 11.4a | 1.7 (0.1–3.3) |
| ICU stay length, hours | 120.3 ± 133.7 | 115.8 ± 118.9 | 4.5 (−16.4 to 7.3) | 108.4 ± 126.5 | 114.7 ± 114.6b | 6.3 (2.0–19.0) |
| Perioperative mortality, no of patients (%) | 19 (2.2) | 33 (3.6) | 0.60 (0.35 to 1.05) | 18 (6.8) | 15 (4.4) | 1.54 (0.79–2.99) |
| Perioperative morbidity, no. of patients (%) | 185 (21.3) | 307 (33.7)c | 0.63 (0.54 to 0.74) | 78 (29.4) | 119 (35.1) | 0.84 (0.66–1.06) |
| Complications, no. of events (%) | ||||||
| Cardiovascular | 109 (12.5) | 193 (21.2)c | 0.59 (0.48 to 0.73) | 26 (9.8) | 64 (18.9)b | 0.52 (0.34–0.80) |
| Respiratory | 56 (6.4) | 69 (7.6) | 0.85 (0.60 to 1.19) | 16 (6.0) | 25 (7.4) | 0.82 (0.45–1.50) |
| Renal | 54 (6.2) | 92 (10.1)b | 0.61 (0.45 to 0.85) | 34 (12.8) | 39 (11.5) | 1.12 (0.72–1.72) |
| Gastrointestinal | 22 (2.5) | 46 (5.1)b | 0.50 (0.30 to 0.83) | 11 (4.2) | 20 (5.9) | 0.70 (0.34–1.44) |
| Neurological | 8 (0.9) | 60 (6.6)c | 0.14 (0.07 to 0.29) | 22 (8.3) | 22 (6.5) | 1.28 (0.72–2.26) |
| Infectious | 24 (2.7) | 60 (6.6)c | 0.42 (0.26 to 0.67) | 12 (4.5) | 29 (8.6) | 0.53 (0.28–1.02) |
Data are expressed as means ± sd or absolute number with relative percentage. The difference between the groups was expressed as absolute difference (AD) for numerical data or relative risk (RR) for categorical data, both with 95% CI. The AD and RR values are unadjusted.
P < .05.
P < .01.
P < .001.
Intraoperative initiation of TGC showed no effect on the whole postoperative length of stay (LOS) or the duration of the ICU treatment in the whole cohort (Table 3) or in the nondiabetic subgroup (Table 4), whereas it reduced both ICU and total hospital stay in the diabetic group (Table 4). Perioperative mortality did not differ significantly between any of the studied groups (Tables 3 and 4).
Discussion
In the present trial, we show that perioperative initiation of TGC reduces postoperative complications and improves outcomes predominantly in nondiabetic patients undergoing cardiac surgery. Although excessive hyperglycemia during surgery is a well-established and independent predictor of perioperative morbidity and mortality (13, 14, 20), only limited data assessing the effects of its lowering are available to date. Lazar et al (15) demonstrated that the administration of glucose-insulin-potassium infusion aimed to maintain blood glucose levels between 6.7 and 10 mmol/L decreases episodes of recurrent ischemia and wound infections and improves 2-year survival compared with a sliding scale insulin protocol with a target range of <13.9 mmol/L in subjects undergoing CABG. Similarly, glucose-insulin-potassium infusion with target glucose levels of 6.0 to 10.0 mmol/L improved myocardial contractile function and decreased inotropic support in a study by Koskenkari et al (21). However, the first RCT to comprehensively assess the value of intraoperative TGC, which included 400 patients receiving either TGC aiming at blood glucose between 4.4 and 5.5 mmol/L or conventional treatment with a glycemic target of <11.1 mmol/L during CABG implantation, failed to show any significant difference in the composite outcome (death, deep sternal wound infection, prolonged infection, cardiac arrhythmias, stroke, and renal failure) between both groups. In fact, intraoperative TGC significantly increased the number of strokes and tended to increase overall mortality, thus raising concerns about the efficacy and safety of TGC during surgical procedures (16).
In contrast to these data, perioperatively initiated TGC in our study markedly decreased postoperative complications with an overall risk reduction of 32%. In addition to confirming the previously established association between perioperative TGC and the reduction in cardiovascular and infectious complications, our data also show a strong beneficial effect of early TGC initiation on other adverse event types including neurological, renal, and GI. Strikingly, this substantial risk reduction was associated with very little overall glucose control improvement in the PERI group throughout the ICU stay. Obviously, the differences in glucose levels were slightly more pronounced in the intraoperative period, but whether this was the primary mechanism by which postoperative complications in the PERI group were reduced remains questionable (especially considering the fact that the nondiabetic subgroup, which profited the most from perioperative initiation of TGC, showed the least improvement in glucose control and vice versa). The marginally increased incidence of hypoglycemia, a factor associated with higher morbidity and mortality in subjects with TGC, in the POST group might also not fully explain the reduction in postoperative outcomes. It might be speculated that early administration of insulin already during the surgery could have to some extent moderated the developing operation-induced stress response by effects other than glucose lowering, including anti-inflammatory, antioxidant, antithrombotic, and vasodilatory effects (22–24). On the other hand, this would seem to be in contrast with a subanalysis of the Leuven study, which showed that blood glucose, rather than insulin, is responsible for the positive effects of TGC (25). The proposed hypothesis notwithstanding, the exact mechanisms by which intraoperatively initiated IIT reduced the number of postoperative complications remain yet to be fully elucidated. Nevertheless, our data indicate that the intraoperative phase of cardiac surgery might have more significance in postoperative outcomes than previously thought and that the exact timing of insulin infusion might be one of the key elements contributing to the efficacy of the TGC regimen.
Another striking finding of our study was the fact that the reduction in postoperative morbidity connected with intraoperative initiation of TGC was driven predominantly by nondiabetic subjects. These findings are in line with some of the previously published data showing a stronger association of hyperglycemia with increased mortality risk in nondiabetic individuals than in those with diabetes (26, 27) and less benefit of TGC in subjects with diabetes mellitus (6, 28). The reason for this difference might be an adaptive response to hyperglycemia in diabetic patients due to their chronic exposure to higher glucose levels, whereas in nondiabetic individuals such mechanisms are missing (29). Another factor that might have contributed to the different outcomes in individuals with and without diabetes mellitus was the presence of hypoglycemia, as the number of moderately hypoglycemic subjects (2.2–3.2 mmol/L) was significantly reduced in the nondiabetic PERI subgroup compared with that in the POST group, while being conversely increased in diabetic subjects. However, the incidence of severe hypoglycemia was comparable throughout all subgroups. Finally, the fact that >50% of subjects in the diabetic POST subgroup received intravenous insulin during the operation (albeit only in the amount of a single bolus of 1–2 IU and with the target glucose being <10 mmol/L) might have to some extent diluted any positive effects of intraoperative insulin administration in the diabetic PERI group.
Although our study was not powered to assess mortality, this parameter certainly comprises the most important safety signal for any intervention. An increased number of deaths, although statistically nonsignificant (4 vs 0), raised concerns about the safety of intraoperative TGC in the study by Gandhi et al (16). Here we did not find any significant difference in perioperative mortality between any of the PERI and POST subgroups. The length of the postoperative stay as one of the secondary endpoints did not differ between the subgroups either in the whole cohort or in nondiabetic individuals, whereas it was slightly prolonged in the diabetic POST group. These results largely confirm the findings of Gandhi et al (16), who also did not observe any shortening of the LOS in association with intraoperative TGC.
Because TGC per se increases the potential risk of hypoglycemia, safety is one of the primary concerns connected to TGC. Compared with the intensive arms of NICE-SUGAR and the original van den Berghe trial with glucose targets similar to those in our study, both the PERI and POST groups showed lower incidence of severe hypoglycemia (<2.2 mmol/L: 3.2% and 4.2% of subjects in the PERI and POST groups vs 5.1% in van den Berghe et al [5] and 6.8% in NICE-SUGAR [11]) (5, 11). Somehow surprisingly, intraoperative initiation of TGC in our study slightly decreased the number of moderate hypoglycemic episodes (2.2–3.3 mmol/L) and reduced the time spent under the target range compared with results for postoperative initiation in the nondiabetic subgroup, whereas the rates of severe hypoglycemia were comparable across all groups. Our current data do not enable us to unravel the exact mechanisms responsible for this positive effect, although one possible explanation is that in subjects without a previous history of diabetes mellitus, perioperative insulin administration prevented early glycemic rises and stabilized glucose profiles, which resulted in decreased occurrence of hypoglycemia. Nevertheless, the results obtained indicate that intraoperative initiation of TGC is a safe procedure with minimal additional hypoglycemic risk for the patient compared with that for postoperative initiation.
Several limitations might have partially affected the results of the present study and their further applicability. Despite the inclusion efforts, several baseline characteristics differed slightly between the groups including older age, increased prevalence of diabetes mellitus and CKD, lower percentage of elective procedures, higher proportion of CABG and off-pump surgery, and worse prognosis as assessed by the additive and logistic EuroSCORE in the POST group. Nevertheless, the differences between the groups remained valid after statistical adjustment for these baseline inconsistencies. The higher dropout rate due to hemodynamic instability during surgery in the PERI group as well as administration of low corrective bolus insulin doses during the intraoperative period in part of the POST group might constitute another source of potential bias. It also should be mentioned that the subgroup analysis between diabetic vs nondiabetic patients had not been planned in the original protocol and therefore has to be considered exploratory with all potential limitations. The selected target range reflects the original Leuven trial more than the current, less stringent, recommendations, partially owing to the pre-NICE-SUGAR design of the trial and partially owing to the unclear situation regarding optimal target ranges for different ICU subgroups with some meta-analytic data indicating benefits of tighter glucose targets in cardiac surgery subjects (12, 30). As this trial was not designed to compare different target ranges, we are not able to draw any relevant conclusions about this question. Nevertheless, the lower mortality rates in both the PERI and POST groups than in either the Leuven or the NICE-SUGAR trials suggest that our approach was safe. The absence of postdischarge follow-up due to complicated logistics comprises another limitation of the study. In contrast, the use of 2 different protocols for TGC should not have affected the outcomes, as only 1 protocol was used at a given time and the number of patients treated by a particular protocol was comparable in each group.
In summary, we have demonstrated that intraoperative initiation of TGC using IIT substantially reduces the incidence of postoperative complications without affecting mortality or postoperative LOS in nondiabetic patients undergoing cardiac surgery and has little effect in subjects with diabetes mellitus.
Acknowledgments
We thank Tomas Sieger, PhD, from the Department of Cybernetics, Faculty of Electrical Engineering, Czech Technical University, Prague, Czech Republic, for his invaluable help with statistical analysis and adjustment models.
This work was supported by the Grant Agency of Charles University in Prague (GAUK 44407), the Ministry of Health of the Czech Republic (Research Grant RVO-VFN64165), and the Charles University in Prague (Research Grant SVV260145).
This trial was registered at Clinicaltrials.gov under registration number NCT01548963.
Disclosure Summary: The authors have nothing to disclose.
Abbreviations
- BMI
body mass index
- CABG
coronary artery by-pass grafting
- CI
confidence interval
- CKD
chronic kidney disease
- EuroSCORE
European System for Cardiac Operative Risk Evaluation
- GI
gastrointestinal
- ICU
intensive care unit
- IIT
intensive insulin therapy
- LOS
length of stay
- PERI
perioperative
- POST
postoperative
- RCT
randomized controlled trial
- RR
relative risk
- TGC
tight glucose control.
