


Children with Prader-Willi syndrome (PWS) attain high-serum immunoreactive IGF-1 levels during a standard-dose GH treatment, which leads to concern, but lowering the dose deteriorates their body composition.
The objective of the study was to evaluate serum IGF-1, IGF binding protein (IGFBP)-3, and acid-labile subunit (ALS) levels, complex formation, and IGF bioactivity in GH-treated PWS children.
This was a cross-sectional study.
The setting of the study was a Dutch PWS cohort.
Forty GH-treated PWS children compared with 41 age- and sex-matched healthy controls participated in the study.
Interventions included GH treatment (1.0 mg/m2 · d = ∼0.035 mg/kg · d).
Serum IGF-1, IGFBP-3, and ALS levels, complex formation, and IGF bioactivity by IGF-1 receptor kinase activation assay were measured.
Serum IGF-1, IGFBP-3, and ALS levels and IGF-1 to IGFBP-3 ratio were significantly higher in GH-treated PWS children than in healthy controls. The 150-kDa ternary complex formation was, however, also significantly higher than in controls, indicating that most of serum IGF-1 is sequestered in the ternary 150-kDa complex with ALS and IGFBP-3. Young GH-treated PWS children [median (interquartile range) aged 5.2 (4.3–7.2) y] exhibited higher serum IGF bioactivity than controls, but no difference was observed in IGF bioactivity between older GH-treated PWS children, aged 14.9 (13.8–16.2) years, and controls. The proportion of IGF bioactivity of total serum IGF-1 was, however, lower in GH-treated PWS children than in controls. Serum immunoreactive IGF-1 levels did not correlate with IGF bioactivity in GH-treated children with PWS, in contrast to a strong positive correlation in healthy controls.
In GH-treated PWS children, most serum IGF-1 is sequestered in the 150-kDa complex. Higher IGF bioactivity was found only in young GH-treated PWS children and not in the older ones. IGF bioactivity during GH showed a wide variation, and there was a disrupted correlation with immunoreactive IGF-1 levels, which makes immunoreactive IGF-1 levels an inappropriate indicator for GH dosing in PWS children.
Prader-Willi syndrome (PWS) is a complex genetic disorder caused by the lack of expression of the paternally inherited genes on chromosome 15q11-q13 (1, 2). The syndrome is characterized by hypotonia, abnormal body composition, short stature, developmental delay, and a distinctive behavioral phenotype (3, 4). Multiple studies showed that GH treatment results in a significantly improved growth and an improved body composition (5–7). Long-term follow-up studies confirmed the beneficial effects of GH treatment in children with PWS (8, 9). Currently, GH treatment in children with PWS is used in many countries.
High serum IGF-1 levels during GH treatment in children with PWS are a major concern (9–11). This has been interpreted because of increased GH sensitivity (10). However, to maintain an acceptable body composition with a fat mass percentage at maximum 2 SD score (SDS), children with PWS require relatively high IGF-1 levels (9, 12). Despite the high serum IGF-1 levels, several growth parameters, such as height, head circumference, hand length, foot length, tibia length, arm span, and facial growth, significantly improved during GH treatment but did not rise above the 0 SDS (13, 14). Studies showed no signs of acromegaly, indicating no increased IGF bioactivity. There is, however, still debate whether to accept these high immunoreactive IGF-1 levels because of the unknown long-term consequences. Controversial long-term data in GH-treated patients with GH deficiency have been published (15, 16), but there are no long-term data on the mortality and causes of death in adults with PWS treated with GH during childhood because GH treatment has been registered for less than 15 years in most countries (17).
Humans have six IGF binding proteins (IGFBPs), which can bind IGF-1 and form a stable binary complex. Under normal circumstances, the binary complex represents 10%–15% of the total serum IGF-1. Most of the remaining serum IGF-1 is present in ternary complexes with one molecule of IGFBP-3 or IGFBP-5 and one molecule of acid-labile subunit (ALS). Only 1%–5% of IGF-1 is unbound or free (18). Free circulating IGF-1 is able to bind to its receptor, IGF1R, and then initiates a complex signaling cascade (19). Most studies use the immunological determination of total (and rarely also free) serum IGF-1 levels as an estimate of IGF bioactivity. However, by doing so, the modulating effects of the various IGFBPs, IGFBP-proteases, and other interfering compounds in the serum are ignored. Therefore, a cell-based assay, measuring the induction of a cellular response to the serum IGF, is a better approach for the establishment of IGF bioactivity of the serum. Most of the effects of IGFs are exerted through activation, ie, phosphorylation of the IGF-1 receptor as a first step of a cascade of downstream events. Hence, in the IGF-bioassay, the phosphorylation of the IGF-1 receptor by MCF7 cells is used as measure of cellular response. In children with PWS, there are no data on IGF-1 complex formation and the ability of serum IGF1R to phosphorylate its receptor, a measure of IGF bioactivity. It is suggested that IGF-1 bioactivity is more sensitive for monitoring the effects of GH treatment than immunoreactive IGF-1 levels (20).
We hypothesized that GH-treated children with PWS have a normal IGF bioactivity, despite the high serum immunoreactive IGF-1 levels. Hence, we investigated the serum levels of immunoreactive IGF-1, IGFBP-3, ALS, and ternary complex formation. In addition, we studied IGF bioactivity in children with PWS compared with an age- and sex-matched healthy control group and the relation with the serum levels of immunoreactive IGF-1, IGFBP-3, and ALS and anthropometric measurements.
Materials and Methods
Patients
We randomly included a group of 40 children participating in the Dutch PWS Cohort study, consisting of 20 prepubertal children aged 10 years or younger (GH-treated young PWS group) and 20 pubertal children, aged older than 10 years (GH-treated older PWS group).
Control group
The reference group consisted of 41 healthy, normal-statured age- and sex-matched controls, divided into two groups; prepubertal, aged 10 years or younger (young controls) and pubertal, aged older than 10 years (older controls). Fasting blood samples were obtained during minor elective surgery. Children were excluded in case of a birth weight and/or birth length SDS below −2 SDS, systemic disorder, chromosomal disorder, or syndrome.
Design
We investigated serum IGF-1, IGFBP-3, and ALS levels, complex formation, and IGF bioactivity in GH-treated children with PWS, compared with healthy age- and sex-matched controls.
Children with PWS were treated with somatropin 1 mg/m2 · d once daily at bedtime (Genotropin; Pfizer Inc) (17). During the first 4 weeks of GH treatment, children received 0.5 mg/m2 · d to prevent fluid retention. Children were seen every 3 months by the PWS Research Team of the Dutch Growth Research Foundation in collaboration with pediatric endocrinologists and pediatricians. At each visit, the GH dose was adjusted to the calculated body surface area. The GH dose was lowered when serum IGF-1 levels increased above +3 SDS. Annually the children visited the Erasmus University Medical Center-Sophia Children's Hospital (Rotterdam, The Netherlands). The study protocol of the Dutch PWS Cohort study and the control study was approved by the Medical Ethics Committees at Children's Hospital of the Erasmus Medical Center-Sophia Children's Hospital (Rotterdam, The Netherlands) and of the collaborating centers. Written informed consent was obtained from parents and from children older than 12 years; assent was obtained in children younger than 12 years of age.
Anthropometric measurements
Standing height was measured with a Harpenden stadiometer, and supine length with a Harpenden infantometer (Holtain Ltd). Weight was assessed on a calibrated scale (Servo Balance KA-20-150S; Servo Berkel Prior). Height, weight, and body mass index (BMI) SDS were calculated with the Growth Analyzer Research Calculation Tools version 4.0 (available at www.growthanalyser.org) and were adjusted for gender and age according to Dutch reference values (21, 22). δHeight SDS and δBMI SDS were derived from changes in the respective SDS values during the previous year.
Assays
After overnight fasting, blood samples were collected for the assessment of serum levels of IGF-1, IGFBP-3, and ALS. After centrifugation, serum samples were immediately frozen and stored at −80° until assayed. Measurements of serum IGF-1, IGFBP-3, and ALS were performed in one laboratory. Total IGF-1 levels were measured using an immunometric technique on an IMMULITE 1000 analyzer (Siemens Medical Solutions Diagnostics). The lower limit of detection was 12 ng/mL (1.6 nmol/L), and interassay variation was less than 7.5% at concentrations ranging from 46 to 420 ng/mL (6.0–55.0 nmol/L) (n = 31). The IGFBP-3 levels were measured using a specific RIA, as described previously (23). The intra- and interassay coefficients of variation were 4.0% and 6.0%, respectively. Levels of serum IGF-1 and IGFBP-3 were expressed in SDS, adjusting for age and gender (23).
Serum ALS levels were determined using the ELISA kit of Mediagnost. Intraassay variations were 6.6% and 6.8% at mean levels of 911 and 1338 mU/mL (n = 16), respectively. Interassay variations were 9%, 8%, and 8% at mean levels of 931, 1061, and 1926 mU/mL (n = 10), respectively. Smoothed references for ALS levels were constructed by the smooth L curve, mean, and coefficient of variation method (24).
Column chromatography
The different molecular size classes of circulating IGF-IGFBP complexes were determined by gel filtration through a 1.6- × 60-cm Hi-Load Superdex 200 column. Prior to size exclusion chromatography, 250 μL of each sample was incubated with 100 μL 125I-hIGF-1 as previously described (25). The ratio between 125I-hIGF-1 in the ternary 150-kDa and in the binary 40- to 50-kDa peak fractions was calculated and expressed as the percentage of the total radioactivity recovered in the eluate. In addition, we calculated SDS values for the ternary 150-kDa peak, the binary 40- to 50-kDa peak and the 150-kDa to 40- to 50-kDa peak ratio, adjusted for age and gender based on levels of 70 healthy children (40 boys) with an age range of 0.6–18.3 years, determined by the same method in the same laboratory (25).
IGF receptor tyrosine kinase activation assay
To assess serum IGF bioactivity and several pro-IGF2 isoforms, we developed an IGF1R kinase activation assay based on MCF7 cells transfected with the human IGF1R gene (26, 27). In brief, the IGF1R kinase activation assay was performed in 12-well flat-bottom culture plates (Corning), to which was added 1 mL per well of cells suspended in DMEM supplemented with 10% fetal calf serum. The plates were incubated for 48 hours at 37°C in 5% CO2, after which the cells were switched to serum-free DMEM and kept for another 24 hours. After the medium had been discarded, either 1 mL of a series of IGF-1 standards or diluted serum was added (for either 4- or 8-fold dilutions similar results were obtained) and incubated for 30 minutes at 37°C. IGF-1 standards and sera were diluted in serum-free DMEM. After incubation, supernatants were aspirated, the cells rinsed two times with PBS, and the cells lysed (0.5 mL lysis buffer/well) for 1 hour at 5°C on a plate shaker. The lysis buffer consisted of 1% Nonidet P-40 alternative, 20 mM Tris (pH 8.0), 137 mM NaCl, 10% glycerol, 2 mM EDTA, 1 mM activated sodium orthovanadate, and a complete protease inhibitor cocktail (Roche Diagnostics).
Determination of levels of total IGF1R and phosphorylated IGF1R was performed with the human IGF1R ELISA kit and human phospho-IGF1R ELISA kit (R&D Systems Inc), respectively. All determinations were performed in duplicate. The operational range of the phopho-IGF1R assay was between 1.0 and 50 ng/mL (ie, 0.13–6.54 nmol/L) of standard purified human (h) IGF-1 added. The within- and between-assay coefficients of variation at a mean level of 0.29 nmol/L IGF bioactivity were less than 6.5% and less than 11% (n = 5), respectively. In the bioassay, the activity of purified hIGF-2 and insulin were, on a molar base, 20% and less than 1% of that of standard hIGF-1 peptide, respectively. The level of phosphorylated IGF1R in the cell lysates after cell stimulation with either hIGF-1 or various sera was normalized by that of total IGF1R. Bioactive IGF in the various sera was calculated from the hIGF-1 bioactivity standard curves and expressed as nanomoles per liter.
Statistics
Statistical analyses were performed with SPSS 21.0 (SPSS Inc). Data were separately analyzed for young and older children (see Patients). Results were expressed as median [interquartile range (IQR)]. A Mann-Whitney U test was used to calculate differences between groups. Correlations were calculated with nonparametric bivariate correlations and expressed by Spearman's rho to assess relationships between IGF bioactivity and serum levels of total IGF-1, IGFBP-3, ALS, and anthropometric measurements. A multiple linear regression analysis was performed to determine the association of IGF bioactivity with δheight SDS and δBMI SDS in all children with PWS. In all multiple linear regression models, adjustments were made for age and gender. All regression coefficients are presented as a standardized β-value for better interpretation of the results. Values of P < .05 were considered statistically significant.
Results
Baseline
Table 1 shows the baseline characteristics of the children with PWS. GH-treated young children had a median (IQR) age of 5.2 years (4.3–7.2 y) and GH-treated older children 14.9 years (13.8–16.2 y). The median duration of GH treatment was 4.0 years (3.0–5.7 y) and 9.0 years (8.1–10.8 y), respectively. The GH dose in milligrams per square meter per day was lower in the young children than in the older children with PWS [0.7 (0.5–1.0) vs 1.0 (1.0–1.0), P = .002, respectively].
Clinical Characteristics of GH-Treated Children With PWS
| GH-Treated Young PWS Children | GH-Treated Older PWS Children | P Value | |
|---|---|---|---|
| Male/Female | 12/8 | 10/10 | .530 |
| Genotype | .890 | ||
| Deletion | 11 | 11 | |
| mUPD | 8 | 7 | |
| ICD | 1 | 2 | |
| Age at start of GH treatment, y | 1.35 (0.97–1.70) | 6.05 (3.65–7.73) | <.001 |
| Blood sampling | |||
| Age, y | 5.2 (4.3–7.2) | 14.9 (13.8–16.2) | <.001 |
| Duration of GH treatment, y | 4.00 (2.95–5.70) | 9.04 (8.14–10.77) | <.001 |
| Dose GH, mg/m2 · d | 0.67 (0.50–1.00) | 1.00 (1.00–1.00) | .002 |
| Height SDS | −0.07 (−0.61 to 0.63) | −0.32 (−1.48 to 0.16) | .194 |
| BMI SDS | 0.89 (0.25–1.85) | 1.24 (0.23–1.66) | .646 |
Serum IGF-1, IGFBP-3, and ALS levels
All PWS children were treated with 1 mg GH/m2 · d, but the dose was lowered when IGF-1 levels reached +3 SDS or higher. In the young children, we had to adjust the GH dose more frequently than in the older children (50% vs 10%).
All GH-treated PWS children had significantly higher serum SDS values for IGF-1, IGFBP-3, IGF-1 to IGFBP-3 ratio, and ALS than healthy controls (P < .001) (Table 2). Serum IGF-1 SDS and ALS SDS levels were not significantly different between young and older PWS children, but IGFBP-3 SDS was significantly higher in the young ones [1.3 (1.0–1.7) vs 0.9 (0.6–1.0), P = .002]. As a result, the IGF-1 to IGFBP-3 ratio was significantly lower in young children than in older children with PWS [0.38 (0.27–0.44) vs 0.67 (0.59–0.73), P < .001, respectively].
Overview of Serum Levels, Column Chromatography, and IGF Bioactivity
| Young GH-Treated PWS Children | Healthy Young Controls | P Value | Older GH-Treated PWS Children | Healthy Older Controls | P Value | |
|---|---|---|---|---|---|---|
| Male/female | 12/8 | 11/10 | .63 | 10/10 | 11/9 | .755 |
| Age, y | 5.23 (4.31–7.15) | 5.58 (4.02–7.40) | .84 | 14.85 (13.82–16.15) | 14.77 (13.10 to 15.59) | .499 |
| IGF-1, nmol/L | 37.8 (25.2–41.6) | 10.6 (8.3–19.6) | <.001 | 85.2 (70.6–92.4)a | 47.1 (40.1 to 53.8) | <.001 |
| IGF-1 SDS | 2.2 (1.6–2.7) | −0.2 (−1.2 to 0.1) | <.001 | 2.5 (1.9–3.1) | 0.6 (0.1 to 0.8) | <.001 |
| IGFBP-3, nmol/L | 93.8 (85.0–103.7) | 59.7 (51.6–75.2) | <.001 | 126.8 (114.5–133.2)a | 82.0 (70.5 to 91.3) | <.001 |
| IGFBP-3 SDS | 1.3 (1.0–1.7) | −0.3 (−0.9 to 0.2) | <.001 | 0.9 (0.6–1.0)a | −0.6 (−1.1 to −0.2) | <.001 |
| Ratio of IGF-1 to IGFBP-3 | 0.38 (0.27–0.44) | 0.20 (0.15–0.25) | <.001 | 0.67 (0.59–0.73)a | 0.55 (0.49 to 0.63) | <.001 |
| ALS, nmol/L | 290.2 (244.0–338.1) | 145.5 (124.0–199.6) | <.001 | 424.9 (379.5–449.8)a | 287.4 (237.3 to 326.8) | <.001 |
| ALS SDS | 3.9 (2.9–7.2) | −0.0 (−0.7 to 0.9) | <.001 | 4.0 (3.1–5.5) | 2.2 (0.9 to 2.9) | <.001 |
| Column chromatography | ||||||
| 150-kDa peak, % | 5.83 (4.82–6.73) | 4.83 (3.76–6.10) | .060 | 7.51 (6.75–8.96)a | 6.07 (5.48 to 7.31) | .006 |
| 150-kDa peak SDS | 0.99 (0.59–1.43) | 0.46 (−0.17 to 0.93) | .022 | 0.85 (0.31–1.51) | −0.12 (−0.56 to 0.67) | .006 |
| 40- to 50-kDa peak, % | 4.35 (3.58–5.66) | 4.64 (3.70–6.28) | .465 | 2.68 (2.11–3.39)a | 2.71 (1.91 to 2.94) | .933 |
| 40- to 50-kDa peak SDS | −0.88 (−1.74 to 0.42) | −0.35 (−1.47 to 0.67) | .407 | 0.15 (−1.41 to 1.34) | 0.05 (−0.69 to 0.59) | .955 |
| Ratio between peaks | 1.33 (0.97–1.71) | 0.95 (0.60–1.29) | .097 | 2.74 (1.86–4.24)a | 2.42 (1.91 to 2.69) | .238 |
| Ratio between peak SDS | 1.10 (0.55–1.88) | 0.09 (−0.55 to 1.65) | .070 | 0.49 (−0.61 to 1.65) | 0.07 (−0.56 to 0.33) | .222 |
| IGF bioactivity, nmol/L | 1.06 (0.92–1.13) | 0.61 (0.49–0.65) | <.001 | 0.79 (0.42–1.03)a | 0.81 (0.71 to 1.04) | .675 |
| IGF bioactivity, % | 2.74 (2.56–3.31) | 5.08 (3.33–6.04) | <.001 | 1.07 (0.60–1.27)a | 1.87 (1.53 to 2.48) | <.001 |
Column chromatography
In GH-treated young PWS children, the 150-kDa ternary complex formation was significantly higher than in the healthy young controls [0.99 (0.59–1.43) vs 0.46 (−0.17 to 0.93) SDS, P = .022] (Figure 1). The 150-kDa to 40- to 50-kDa peak ratio was also higher, but this did not reach significance [1.10 (0.55–1.88) vs 0.09 (−0.55 to 1.65) SDS, P = .070].
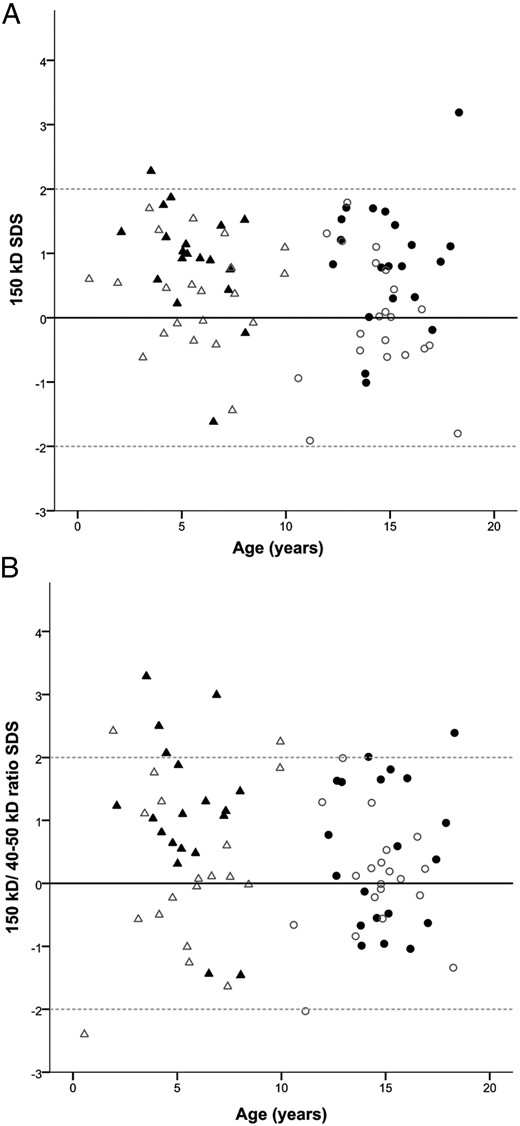
A, The 150-kDa complex SDS in GH-treated children with PWS and controls. B, The 150-kDa to 40 to 50-kDa ratio SDS in GH-treated children with PWS and controls. ▴, Young GH-treated PWS children. Δ, Healthy young controls. ●, Older GH-treated PWS children. ○, Healthy older controls
In GH-treated older PWS children, 150-kDa ternary complex formation was also significantly higher than in the healthy older controls [0.85 (0.31–1.51) vs −0.12 (−0.56 to 0.67) SDS, P = .006]. Again, the 150-kDa to 40- to 50-kDa ratio was not significantly different from healthy older controls [0.49 (−0.61 to 1.65) vs 0.07 (−0.56 to 0.33) SDS, P = .227].
No differences in complex formation were found between the GH-treated young and older PWS children (150 kDa: P = .653 and 150 kDa to 40–50 kDa ratio: P = .222).
IGF bioactivity
GH-treated young PWS children had the highest IGF bioactivity [1.06 (0.92–1.13) nmol/L], which was significantly higher than the healthy young controls [0.61 (0.49–0.65) nmol/L, P < .001] and the GH-treated older PWS children [0.79 (0.42–1.03 nmol/L, P = .012] (Figure 2A). The older PWS children had a similar IGF bioactivity as the healthy older controls [0.81 (0.71–1.04) nmol/L].
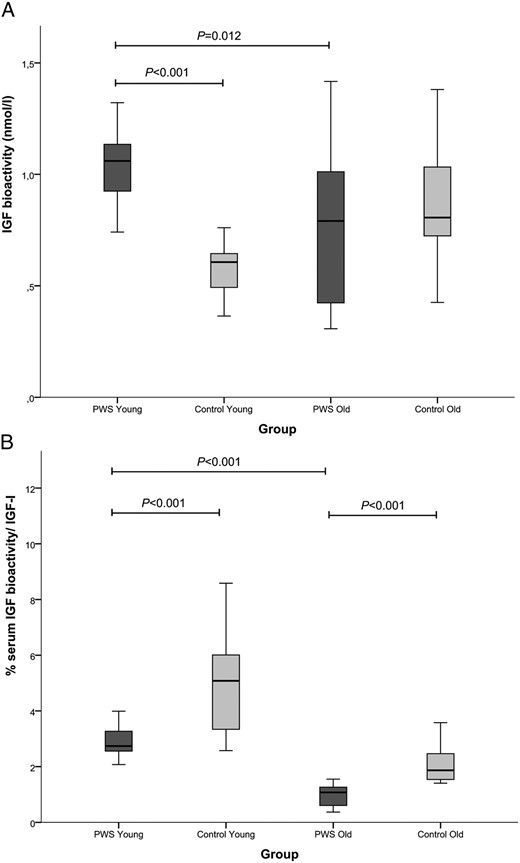
A, IGF-bioactivity in GH-treated PWS children and healthy controls. B, Percentage of bioactive IGF/serum IGF-1 in GH-treated PWS children and healthy controls. ■, PWS children. ■, Controls
The percentage of the IGF bioactivity of the total serum immunoreactive IGF-1 (expressed as percentage IGF bioactivity) was, however, significantly lower in both PWS age groups compared with healthy controls (both P < .001) (Figure 2B). GH-treated young PWS children had a higher percentage IGF bioactivity than the older PWS children [2.74 (2.56–3.31) vs 1.07 (0.60–1.27), P < .001]. Also, in the healthy control group, young children had a significantly higher percentage IGF bioactivity than the older ones [5.08 (3.33–6.04) vs 1.87 (1.53–2.48), P < .001] (Table 2).
Correlations IGF bioactivity
In healthy controls, serum IGF bioactivity was strongly correlated with IGF-1 SDS, IGF-1 to IGFBP3 ratio, and ALS SDS (ρ = 0.745, ρ = 0.836, ρ = 0.741, respectively, all P < .0001) (Figure 3). In contrast, in children with PWS, a lack of correlations was found between these parameters and IGF bioactivity. Age was positively correlated with IGF bioactivity in healthy controls (ρ = 0.770, P < .0001) but not in children with PWS (ρ = −0.282, P = .078). In children with PWS, serum IGF bioactivity did not correlate with the duration of GH treatment and GH dose at the time of blood sampling.
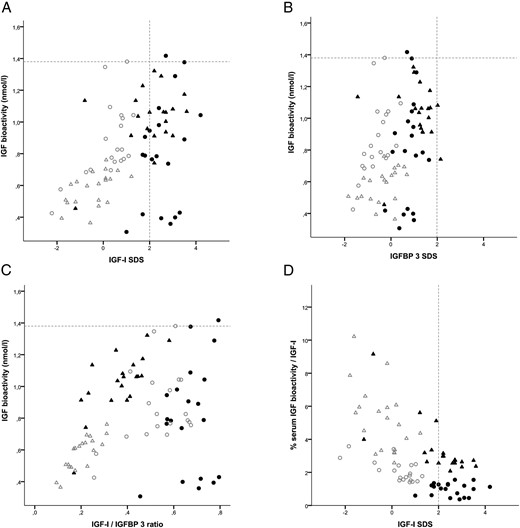
A, Correlation between IGF-bioactivity and IGF-1 SDS. B, Correlation between IGF-bioactivity and IGFBP-3 SDS. C, Correlation between IGF bioactivity and IGF-1 to IGFBP-3 ratio. D, Correlations between percentage serum IGF bioactivity/IGF-1 and IGF-1 SDS. ▴, Young GH-treated PWS children. Δ, Healthy young controls. ●, Older GH-treated PWS children. ○, Healthy older controls
As shown in Figure 3A, children with PWS showed a very wide variation in IGF bioactivity, especially the older PWS children. Almost all children with PWS had a serum IGF-1 SDS level above the +2 SDS, but only one child had a higher IGF bioactivity than the highest level in healthy controls, whereas four children had even a very low IGF bioactivity. This indicates that the serum immunoreactive IGF-1 levels of children with PWS did not discriminate between high and low IGF bioactivity.
Because we observed a higher IGF bioactivity in young PWS compared with both age-matched controls and with the older PWS children, we performed a subanalysis in the young and older PWS children. In young PWS children, IGF bioactivity was positively correlated with IGF-1 to IGFBP3 ratio (ρ = 0.663, P = .001) (Figure 3C), whereas in the older PWS children, there was no correlation.
Despite their high serum IGF-1 SDS values, Figure 3D shows that both young and older children with PWS exhibited lower IGF bioactivity when expressed as proportion of their total serum immunoreactive IGF-1 than healthy controls.
Multiple regression analysis in children with PWS
We performed a multiple regression analysis to determine associations between IGF bioactivity and δheight SDS and δBMI SDS during the previous year in the total group of children with PWS, but no significant associations were found. In the young PWS children, IGF bioactivity was not associated with δheight SDS, but it was positively associated with δBMI SDS (β = .644, P = .005). IGF bioactivity was not associated with height SDS and BMI SDS at the time of blood sampling. In the older PWS children, no associations were found.
Discussion
Our study shows that IGF-1 SDS, IGFBP-3 SDS, IGF-1 to IGFBP-3 ratio, and ALS SDS were significantly higher in GH-treated children with PWS than in healthy controls. GH-treated children with PWS had a higher 150-kDa ternary complex formation than healthy controls, indicating that most of the serum IGF-1 is sequestered in the ternary 150-kDa complex with ALS and IGFBP-3. Young GH-treated PWS children had a higher IGF bioactivity than healthy young controls and older GH-treated PWS children. Despite the higher immunoreactive IGF-1 levels in older PWS children, no difference in IGF bioactivity was observed compared with healthy older controls, which is reassuring. The percentage IGF bioactivity was lower in the GH-treated PWS children than in healthy controls. The most striking finding was the disrupted correlation between serum immunoreactive IGF-1 levels and IGF bioactivity in children with PWS, in contrast to a strong positive correlation in healthy controls.
High serum IGF-1 levels during GH treatment are a major problem in children with PWS. To shed more light on this phenomenon, this is the first study investigating ALS levels, complex formation, and IGF bioactivity in serum of GH-treated children with PWS compared with age- and sex-matched healthy controls. We observed elevated serum IGF-1 levels in GH-treated PWS children in combination with IGFBP-3 levels in the upper normal range. This is in line with previous studies, describing a significant increase in serum IGF-1 levels and relatively less increase in IGFBP-3 levels during GH treatment in children with PWS (10, 12). We additionally found markedly high ALS levels during GH treatment in PWS children. The finding of high ALS levels underlines that children with PWS are very sensitive to GH because the production of ALS is predominantly regulated by GH (28). ALS is essential for the stabilization of both circulating IGF-1 and IGFBP-3 and restrains the ability of IGF-1 to interact with its receptor (18). In animals, it was shown that ALS is also involved in carbohydrate and fat metabolism (29, 30). Patients with PWS might benefit from a high serum ALS level because it may contribute to the improvement of metabolic parameters during GH treatment (31, 32). On the other hand, it could be that the high ALS levels decrease the IGF bioactivity through increased 150-kDa complex formation. Indeed, we observed a higher degree of 150-kDa ternary complex formation in children with PWS than in the controls, indicating that most of the IGF-1 is sequestered by ALS and IGFBP-3. This is in accordance with our finding that the percentage IGF bioactivity was lower in children with PWS than in the healthy controls.
Whereas we found a strong relationship between serum immunoreactive IGF-1 levels and IGF bioactivity in healthy controls, this appeared not to be the case in children with PWS. Thus, serum IGF-1 levels in GH-treated PWS children are an inappropriate indicator of the IGF bioactivity and therefore unreliable for titrating the GH dose. For the young GH-treated PWS children, but not for the older ones, we observed a positive correlation between IGF bioactivity and the IGF-1 to IGFBP3 ratio. In literature, the serum IGF-1 to IGFBP-3 ratio has occasionally been considered as a surrogate marker for the level of free biologically available IGF-1 in the circulation (33, 34). This may indeed be applicable in the young GH-treated PWS children, but further research is needed to confirm the clinical relevance.
Although they received a lower GH dose, young children with PWS showed a higher serum level of IGF bioactivity than the older children. The latter had serum IGF bioactivity levels that were similar to healthy controls. The fact that we observed a higher IGF bioactivity only in the young PWS children might suggest that this is transient because the older PWS children with more years of GH treatment have a normal IGF bioactivity. A recent study observed higher IGFBP-3 proteolytic activity in young children compared with older children (25). IGFBP-3 proteases are capable of cleaving intact IGFBP-3 into smaller fragments with a reduced affinity for IGF-1 (35). This could result in higher IGF-1 bioavailability for target tissue to stimulate growth in young children. One explanation could be that GH-treated young PWS children would need a relatively high level of IGF bioactivity because they grow fast (13, 36). However, we observed no correlation between serum IGF bioactivity and δheight SDS, GH dose, and duration of GH treatment. Another explanation could be that young PWS children undergo great changes in body composition. We observed a positive relation between IGF bioactivity and δBMI SDS in young GH-treated PWS children, whereas there was no relationship with BMI SDS at the time of blood sampling. So the higher the increase in BMI in young PWS children, the higher the IGF bioactivity. This finding is in line with a previous study in anorexia nervosa patients, who had an increase in IGF bioactivity during refeeding, when their BMI increased (37).
In children with PWS, different nutritional phases have been described (38), and in young children, a switch occurs from phase 1b (appropriate feeding with weight increasing at a normal rate) to phase 2a (an increase in body weight without a change in appetite or dietary intake). Miller et al (38) described that the switch to phase 2a was associated with a significant increase in serum IGF-1 levels during GH treatment while on a stable GH dose. In young PWS children, we observed a high IGF bioactivity, whereas we already had lowered the GH dose more frequently due to supranormal IGF-1 levels. It could also be speculated that an increase in IGF bioactivity is a reaction of the body to compensate for the increase in BMI. We observed a very wide variation in IGF bioactivity in the older PWS children, despite high immunoreactive IGF-1 levels. Based on the high immunoreactive IGF-1 levels, physicians might decide to lower the GH dose, whereas some older patients in fact need a higher GH dose.
This first study investigated IGF bioactivity cross-sectionally; thus, we were not able to see after which age or duration of GH treatment the IGF bioactivity changes and which level of IGF bioactivity is needed to improve growth and body composition. Because our control group consisted of healthy children with an appropriate growth and no GH treatment, we could not compare our results with GH-treated, non-PWS patients. The fact that we performed a cross-sectional study with a limited number of healthy controls warrants further research to confirm our findings. Potential confounders in our study are the clinical characteristics of the children with PWS, like the different pubertal progression and abnormal body composition.
Despite high serum IGF-1 in all and high IGF bioactivity levels in young children with PWS, we did not observe side effects or signs of acromegaly. This suggests that other factors, such as tissue-specific IGF1R concentrations, IGF1R signal pathways, or IGFBP-3 protease activity, might be involved. Based on our data, a longitudinal follow-up study is warranted in GH-treated children with PWS, in untreated and GH-treated children with GH deficiency, and in children with sex hormone deficiency with or without hormone replacement therapy, including matching for sex hormone levels.
In conclusion, in GH-treated children with PWS, most of the serum IGF-1 is sequestered in the ternary 150-kDa complex with ALS and IGFBP-3. High serum IGF-1 levels in GH-treated PWS children result only in a higher IGF bioactivity in young children but in a normal IGF bioactivity in older children compared with healthy controls. In young GH-treated PWS children, the high IGF bioactivity is related to the increase in BMI and probably transient, but the long-term clinical consequences need further research. In older GH-treated PWS children, our data are reassuring. IGF bioactivity in GH-treated PWS children show a wide variation and a disrupted of correlation with immunoreactive IGF-1 levels, which makes immunoreactive IGF-1 levels an inappropriate indicator of GH dosing in these children.
Acknowledgments
We thank all the patients and their parents for participating in this study. We greatly acknowledge Mrs P. M. C. C. van Eekelen, research nurse, for her assistance and help with the data collection. We also thank G. H. M. Graat, C. F. M. van der Laak, A. G. M. van de Sande, and I. Maitimu for their help with the column chromatography and acid-labile subunit measurements.
The study has the Clinical Trial registration number of ISRCTN 49726762/NTR 628.
This study was an investigator-initiated study, supported by an independent research grant from Pfizer.
Disclosure Summary: The authors have nothing to declare.
Abbreviations
- ALS
acid-labile subunit
- BMI
body mass index
- h
human
- IGFBP
IGF binding protein
- IGF1R
IGF-1 receptor
- IQR
interquartile range
- PWS
Prader-Willi syndrome
- SDS
SD score.
