


Diabetes is a risk factor for dementia, but the effects of diabetic severity on dementia are unclear.
The purpose of this study was to investigate the association between the severity and progress of diabetes and the risk of dementia.
We conducted a 12-year population-based cohort study of new-onset diabetic patients from the Taiwan National Health Insurance Research Database. The diabetic severity was evaluated by the adapted Diabetes Complications Severity Index (aDCSI) from the prediabetic period to the end of follow-up. Cox proportional hazard regressions were used to calculate the hazard ratios (HRs) of the scores and change in the aDCSI.
Participants were 431,178 new-onset diabetic patients who were older than 50 years and had to receive antidiabetic medications.
Dementia cases were identified by International Classification of Diseases, ninth revision, code (International Classification of Diseases, ninth revision, codes 290.0, 290.1, 290.2, 290.3, 290.4, 294.1, 331.0), and the date of the initial dementia diagnosis was used as the index date.
The scores and change in the aDCSI were associated with the risk of dementia when adjusting for patient factors, comorbidity, antidiabetic drugs, and drug adherence. At the end of the follow-up, the risks for dementia were 1.04, 1.40, 1.54, and 1.70 (P < .001 for trend) in patients with an aDCSI score of 1, 2, 3, and greater than 3, respectively. Compared with the mildly progressive patients, the adjusted HRs increased as the aDCSI increased (2 y HRs: 1.30, 1.53, and 1.97; final HRs: 2.38, 6.95, and 24.0 with the change in the aDCSI score per year: 0.51–1.00, 1.01–2.00, and > 2.00 vs < 0.50 with P < .001 for trend).
The diabetic severity and progression reflected the risk of dementia, and the early change in the aDCSI could predict the risk of dementia in new-onset diabetic patients.
Diabetes mellitus is a common risk factor for dementia (1–3). Diabetes currently accounts for 6%–8% of all cases of dementia in older populations (4). Prospective observational studies have consistently reported an association between type 2 diabetes mellitus and dementia, showing that diabetes increases dementia risk 1.3- to 3.4-fold (2, 3). With regard to the subtypes of dementia, there is a 2.0- to 3.4-fold increased risk of vascular dementia and a 1.8- to 2.0-fold increased risk of Alzheimer's disease in older people with diabetes (5–8).
The relationship between the severity of diabetes and dementia is not clear. Diabetic complications are associated with mortality (9, 10) and disability (11). People with diabetes are vulnerable to the traditional microvascular and macrovascular complications of diabetes but are also at an increased risk for geriatric syndromes, such dementia (12). Mild cognitive impairment is associated with the presence of diabetic complications and other factors related to diabetic severity, such as earlier onset, longer duration, and treatment with insulin (13). Poor glucose control, which can exacerbate the severity of diabetes (14), is associated with worse cognitive function and greater decline (15). This observation suggests that the severity of diabetes may contribute to accelerated cognitive aging.
Although diabetes is associated with a risk of dementia and diabetes severity might play an important role in the association, studies addressing the association between the severity of diabetes and the risk of dementia are scarce. We conducted a 12-year population-based cohort study using reimbursement claims from Taiwan's National Health Insurance Research Database to examine the associations between diabetic severity and dementia in newly onset diabetic adults in an older population.
Materials and Methods
Data sources
The cohort sampling data set was obtained from the research database of the Taiwanese National Health Insurance (NHI). The NHI program, implemented on March 1, 1995, provides compulsory universal health insurance that covers all forms of healthcare services for 98% of the island's population. In cooperation with the Bureau of NHI, the National Health Research Institute (NHRI) of Taiwan randomly sampled a representative database of all NHI enrollees using a systematic sampling method for research purposes; the result of this sampling is known as the Longitudinal Health Insurance Database. There were no statistically significant differences in age, gender, or health care costs between the sample group and all enrollees, as reported by the NHRI. We used databases in the sample cohort, which included information on patient characteristics, including sex, date of birth, dates of visits, and up to five visit diagnoses [by International Classification of Diseases, ninth revision (ICD-9) classification]. These databases have previously been used for epidemiological research, and the information on prescription use, diagnoses, and hospitalizations is of high quality (16, 17).
Following strict confidentiality guidelines in accordance with personal electronic data protection regulations, the NHRI of Taiwan maintains an anonymous database of NHI reimbursement data suitable for research (18).
Identification of study sample
We conducted a population-based cohort study in which all subjects were older than 50 years, using a dataset of newly diagnosed diabetic (ICD-9 codes 250, A181) individuals. All newly diagnosed diabetic subjects had at least three visits recorded in outpatient records or one admission diagnosis (19) and did not have any records of diabetes in the dataset between January 1, 1997 and December 31, 1998. Every diabetic patient had to receive antidiabetic medications between January 1, 1999 and December 31, 2010. Subjects with a previous history of dementia (ICD-9 codes 290.0, 290.1, 290.2, 290.3, 290.4, 294.1, 331.0) between 1997 and 1998 and subjects whose onset of diabetes was later than their dementia diagnosis were excluded in the diabetes cohort. Overall, 431 178 insured adults were included for prospective analyses. This investigation started in 1999; it was designed to include all incident dementia cases until censoring due to death, loss to follow-up or other causes by the end of 2010, and it explored the association between the severity and progression of diabetes and the incidence of dementia (Supplemental Figure 1).
Severity of diabetes and the adapted Diabetes Complications Severity Index
Diabetic severity was evaluated by the adapted Diabetes Complications Severity Index (aDCSI) (Supplemental Figure 2) (20, 21). The Diabetes Complications Severity Index (DCSI), first developed by Young et al (22), uniquely incorporates a wide range of diabetes complications and is a useful tool for predicting mortality and hospitalizations for the adjustment of the baseline severity of disease in the diabetic population. The DCSI was developed to model the severity of diabetes complications at any one point in time. The DCSI incorporates diagnosed complications along with select laboratory results to assess patients' risks of adverse outcomes, including hospitalizations and death. The severity index includes the following seven categories of complications: cardiovascular disease, nephropathy, retinopathy, peripheral vascular disease, stroke, neuropathy, and metabolic. The aDCSI, which was modified from DCSI by excluding laboratory test results, could explain hospitalizations and has similar performance to DCSI in the claimed data (20). The aDCSI was validated in the National Health Insurance Research database, and the performance in predicting risk of hospitalization was similar to the original study (21). The progression of diabetes was defined as increased aDCSI score each year, and the four groups of progression were defined as increased scores less than 0.5, 0.5–1.0, 1.0–2.0 and greater than 2.0 per year.
Definition of dementia
Dementia cases were identified by ICD code (ICD-9 codes 290.0, 290.1, 290.2, 290.3, 290.4, 294.1, and 331.0), and the date of the initial dementia diagnose was used as the index date. All dementia subjects had at least three records of outpatient visits or one admission diagnosis. Because the diabetic complication may be highly associated with vascular dementia, we also excluded vascular dementia (ICD-9 code 290.4) for validation.
Potential confounding factors
We systematically identified any risk factors for dementia as potential confounding factors, as defined by the following diagnoses recorded between January 1, 1999, and the dementia index date: age of diabetic onset, sex, income, urbanization, comorbidity, drugs (antidiabetic drugs and angiotensin receptor blocker), and antidiabetic drug adherence. Urbanization levels in Taiwan were divided into four strata according to Taiwan National Health Research Institute publications, with level 1 referring to the most urbanized and level 4 referring to the least urbanized communities. Comorbid diseases included hypertension (ICD-9 code 401), heart failure (ICD-9 code 428), coronary heart disease (ICD-9 codes 414 and 429.2), hypercholesterolemia (ICD-9 code 272), chronic pulmonary obstructive disease (ICD-9 codes 491 and 492), chronic kidney disease (ICD-9 code 585), and depressive disorder (ICD-9 codes 296.2, 296.3, 300.4, and 311, exclude any records of bipolar disorder). Antidiabetic therapies in the cohort included insulin, metformin, sulfonylureas, thiazolidinediones, and other antidiabetic therapies; therapies were defined as the completion of at least 180 days of exposure before the index day. A cutoff of 180 days was applied to avoid an initial irregular pattern of drug use, which might relate to noncompliance, or adverse effects of initial antidiabetic medication. Drug adherence was defined as the total days of antidiabetic therapies divided by the total days of diabetic course.
Statistical analysis
Crude incidence rates of dementia were calculated from the follow-up period until the end of 2010. We used the Kaplan-Meier method to estimate dementia cumulative incidences. A Cox proportional hazard model was used to compute the hazard ratios (HRs), and the accompanying 95% confidence intervals (CIs) were used after adjustment for the variables mentioned. For the evaluation of diabetic severity on dementia risk in the different disease time point, the HRs were calculated at the day of diabetic onset, the end of the follow-up, and the end of each year after onset. The HRs of progressions of whole diabetic course (the average change of aDCSI from the onset day to the end of the follow-up) were examined. We also evaluated the risk of the first few-year progression (four progression groups: increased aDCSI scores < 0.5, 0.5–1.0, 1.0–2.0, and > 2.0 per year) to examine whether the early-year progression could predict the risk of dementia. Finally, a log-rank test was performed to examine the differences in the risk for dementia between different populations for diabetic severity and progression. A two-tailed value of P = .05 was considered significant.
To examine potential effect modifiers, we conducted analyses stratified by age, sex, and groups with and without hypertension, hypercholesterolemia, chronic obstructive pulmonary disease (COPD), chronic kidney disease, depressive disorder, and stroke in the cohort. These sensitivity analyses evaluated the differences and consistencies between age, sex, and comorbidities. All of the above analyses were conducted using SAS statistical software (version 9.2; SAS Institute Inc).
Results
A total of 431 178 new-onset diabetic patients were included in the study cohort, of whom 6.2% (n = 26 856) had been diagnosed with dementia. The overall incidence rate of dementia was 106.3 ± 1.2 cases per 10 000 person-years in the diabetic cohort. The mean onset age of diabetes in the study subjects was 69.0 ± 8.1 years, and 50.5% were female. The mean follow-up time was 5.6 ± 3.5 years. Table 1 presents the distribution of demographic characteristics and medical conditions. Hypertension (80.4%) was the most common comorbidity, followed by hypercholesterolemia (58.1%), coronary heart disease (55.8%), chronic pulmonary obstructive disease (29.7%), heart failure (20.9%), depressive disorder (12.5%), and chronic kidney disease (9.7%).
Subject Characteristics
| Characteristic | Subjects n = 431 178 | Change of aDCSI Score per Year | |||
|---|---|---|---|---|---|
| 0–0.5 n = 327 796 | 0.5–1 n = 58 375 | 1–2 n = 22 920 | >2 n = 22 087 | ||
| Age, y | |||||
| 50–59 | 49 321 (11.4) | 42 016 (12.8) | 5224 (9.0) | 1232 (5.4) | 849 (1.7) |
| 60–69 | 191 800 (44.5) | 155 222 (47.4) | 23 817 (40.8) | 7473 (32.6) | 5288 (23.9) |
| 70–79 | 141 973 (32.9) | 102 192 (31.2) | 21 867 (37.5) | 9316 (40.7) | 8598 (38.9) |
| ≥80 | 48 084 (11.2) | 28 366 (8.7) | 7467 (12.8) | 4899 (21.4) | 7352 (33.3) |
| Mean (SD) | 69.0 (8.1) | 68.2 (7.7) | 70.0 (8.0) | 72.5 (8.3) | 75.2 (8.9) |
| Sex | |||||
| Female | 217 927 (50.5) | 170 959 (52.2) | 26 912 (46.1) | 9989 (43.6) | 10 067 (45.6) |
| Urbanization | |||||
| Low | 47 308 (11.0) | 34 541 (10.5) | 6954 (11.9) | 2866 (12.5) | 2947 (13.3) |
| Moderate | 86 199 (20.0) | 63 678 (19.4) | 12 387 (21.2) | 5029 (21.9) | 5105 (23.1) |
| High | 185 995 (43.1) | 142 472 (43.5) | 24 857 (42.6) | 9654 (42.1) | 9012 (40.8) |
| Very high | 111 676 (25.9) | 87 105 (26.6) | 14 177 (24.3) | 5371 (23.4) | 5023 (22.7) |
| Income (NTD) | |||||
| 0 | 94 954 (22.0) | 69 200 (21.1) | 13 538 (23.2) | 5852 (25.5) | 6364 (28.8) |
| 1–15 840 | 62 175 (14.4) | 44 614 (13.6) | 9568 (16.4) | 4014 (17.5) | 3979 (18.0) |
| 15 841–25 000 | 212 172 (49.2) | 162 258 (49.5) | 28 640 (49.1) | 10 951 (47.8) | 10 323 (46.7) |
| >25 000 | 61 877 (14.4) | 51 724 (15.8) | 6629 (11.4) | 2103 (9.2) | 1421 (6.4) |
| Medical diseases | |||||
| Hypertension | 346 805 (80.4) | 261 050 (79.6) | 51 154 (87.6) | 19 005 (82.9) | 15 596 (70.6) |
| Coronary heart disease | 240 592 (55.8) | 176 550 (53.9) | 39 266 (67.3) | 14 044 (61.3) | 10 732 (48.6) |
| Hypercholesterolemia | 250 358 (58.1) | 200 636 (61.2) | 33 828 (58.0) | 10 208 (44.5) | 5686 (25.7) |
| Heart failure | 90 026 (20.9) | 52 495 (16.0) | 20 447 (35.0) | 9057 (39.5) | 8027 (36.3) |
| Chronic kidney disease | 41 883 (9.7) | 20 352 (6.2) | 12 126 (20.8) | 5271 (23.0) | 4134 (18.7) |
| Depressive disorder | 53 992 (12.5) | 40 591 (12.4) | 8583 (14.7) | 2840 (12.4) | 1978 (9.0) |
| COPD | 128 043 (29.7) | 91 125 (27.8) | 21 155 (36.2) | 8423 (36.8) | 7340 (33.2) |
| Stroke | 183 178 (42.5) | 119 223 (36.4) | 37 079 (63.5) | 14 482 (63.2) | 12 394 (56.1) |
| Diabetes complication | |||||
| Retinopathy | 42 347 (9.8) | 24 726 (7.5) | 12 292 (21.1) | 3771 (16.5) | 1558 (7.1) |
| Nephropathy | 113 286 (26.3) | 62 819 (19.2) | 29 419 (50.4) | 11 651 (50.8) | 9397 (42.6) |
| Neuropathy | 101 829 (23.6) | 67 603 (20.6) | 23 072 (39.5) | 7331 (32.0) | 3823 (17.3) |
| Cerebrovascular | 122 963 (28.5) | 66 231 (20.2) | 31 929 (54.7) | 13 043 (56.9) | 11 760 (53.2) |
| Cardiovascular | 226 634 (52.6) | 152 443 (46.5) | 42 924 (73.5) | 16 662 (72.7) | 14 605 (66.1) |
| Peripheral vascular disease | 55 124 (12.8) | 27 698 (8.5) | 16 680 (28.6) | 6451 (28.2) | 4295 (19.5) |
| Metabolic | 19 194 (4.5) | 4591 (1.4) | 7116 (12.2) | 3667 (16.0) | 3820 (17.3) |
| Mean aDCSI score (SD) | |||||
| Onset | 0.8 (1.2) | 0.7 (1.2) | 0.7 (1.1) | 0.8 (1.2) | 0.8 (1.3) |
| End of follow-up | 2.4 (2.0) | 1.8 (1.6) | 4.5 (1.9) | 4.6 (2.2) | 3.8 (1.9) |
| Mean aDCSI complication counts (SD) | |||||
| Onset | 0.5 (0.8) | 0.5 (0.8) | 0.5 (0.7) | 0.5 (0.8) | 0.6 (0.8) |
| End of follow-up | 1.6 (1.2) | 1.2 (1.0) | 2.8 (1.2) | 2.7 (1.3) | 2.2 (1.1) |
| Drugsa | |||||
| Insulin | 41 253 (9.6) | 21 806 (6.7) | 11 185 (19.2) | 4758 (20.8) | 3504 (15.9) |
| Metformin | 237 006 (55.0) | 191 208 (58.3) | 33 857 (58.0) | 9172 (40.0) | 2769 (12.5) |
| Sulfonylurea | 247 217 (57.3) | 194 722 (59.4) | 37 507 (64.3) | 11 034 (48.1) | 3954 (17.9) |
| Thiazolidinedione | 44 238 (10.3) | 36 003 (11.0) | 6857 (11.8) | 1172 (5.1) | 206 (0.9) |
| Other antidiabetic drug | 74 603 (17.3) | 56 217 (17.2) | 14 097 (24.2) | 3418 (14.9) | 871 (3.9) |
| Mean follow-up, y (SD) | 5.6 (3.5) | 6.2 (3.4) | 5.7 (2.9) | 2.9 (1.9) | 0.7 (0.8) |
| Drug adherence (SD)b | 0.37 (0.27) | 0.37 (0.27) | 0.38 (0.27) | 0.35 (0.29) | 0.23 (0.29) |
Abbreviation: NTD, New Taiwan dollar.
Each class of antidiabetic drug was defined as subjects who were ever exposed for at least 180 days during the period of study.
Drug adherence was defined as the total days of antidiabetic therapies divided by the total days of diabetic course.
The adjusted HRs of the aDCSI score were increased with the severity. Cox proportional hazards regression models were performed with adjustments for age of diabetic onset, sex, income, urbanization, comorbidities, diabetic drugs, and drug adherence. At diabetic onset, adjusted HRs of the aDCSI score were 0.98 (95% CI 0.94–1.02), 1.12 (95% CI 1.08–1.16, P < .001), 1.26 (95% CI 1.19–1.33, P < .001), and 1.42 (95% CI 1.35–1.50, P < .001), with an aDCSI score 1, 2, 3, and greater than 3, respectively. At the end of the follow-up, the risks for dementia were 1.04 (95% CI 0.99–1.09), 1.40 (95% CI 1.34–1.46, P < .001), 1.54 (95% CI 1.47–1.61, P < .001,) and 1.70 (95% CI 1.63–1.78, P < .001), with an aDCSI score of 1, 2, 3, and greater than 3, respectively. The adjusted HRs of the aDCSI score (each year from y 0 to y 10) were also increased with the severity (P for trend <.001). After the first year, there were no significantly different trends among the follow-up years (Table 2).
Multivariable Cox Model: Measured HRs and 95% CIs of aDCSI for Dementia at the Onset of Diabetes, Each Year of Follow-Up and the End Point
| Year | n | Adjusted HR (95% CI)a | |||||
|---|---|---|---|---|---|---|---|
| aDCSI = 0 | aDCSI = 1 | aDCSI = 2 | aDCSI = 3 | aDCSI >3 | P for Trend | ||
| 0 | 431 178 | 1.00 | 0.98 (0.94–1.02) | 1.12 (1.08–1.16) | 1.26 (1.19–1.33) | 1.42 (1.35–1.50) | <.001 |
| 1 | 387 918 | 1.00 | 1.09 (1.05–1.13) | 1.35 (1.30–1.40) | 1.53 (1.46–1.61) | 1.80 (1.71–1.88) | <.001 |
| 2 | 350 120 | 1.00 | 1.11 (1.07–1.16) | 1.34 (1.28–1.40) | 1.58 (1.50–1.66) | 1.84 (1.76–1.94) | <.001 |
| 3 | 312 379 | 1.00 | 1.12 (1.06–1.17) | 1.34 (1.28–1.41) | 1.55 (1.47–1.64) | 1.88 (1.78–1.98) | <.001 |
| 4 | 274 426 | 1.00 | 1.15 (1.09–1.22) | 1.34 (1.27–1.42) | 1.57 (1.48–1.67) | 1.91 (1.80–2.02) | <.001 |
| 5 | 237 480 | 1.00 | 1.14 (1.07–1.22) | 1.34 (1.26–1.43) | 1.64 (1.53–1.75) | 1.94 (1.82–2.08) | <.001 |
| 6 | 200 801 | 1.00 | 1.12 (1.03–1.21) | 1.32 (1.23–1.43) | 1.67 (1.54–1.81) | 1.94 (1.80–2.09) | <.001 |
| 7 | 163 275 | 1.00 | 1.08 (0.98–1.19) | 1.36 (1.24–1.49) | 1.61 (1.46–1.78) | 1.93 (1.76–2.11) | <.001 |
| 8 | 127 991 | 1.00 | 1.06 (0.93–1.20) | 1.42 (1.26–1.60) | 1.77 (1.56–2.00) | 2.05 (1.82–2.31) | <.001 |
| 9 | 93 574 | 1.00 | 0.97 (0.82–1.16) | 1.32 (1.13–1.55) | 1.61 (1.36–1.90) | 1.90 (1.62–2.23) | <.001 |
| 10 | 60 975 | 1.00 | 1.05 (0.80–1.37) | 1.30 (1.01–1.67) | 1.74 (1.35–2.25) | 2.14 (1.68–2.72) | <.001 |
| End of follow-up | 431 178 | 1.00 | 1.04 (0.99–1.09) | 1.40 (1.34–1.46) | 1.54 (1.47–1.61) | 1.70 (1.63–1.78) | <.001 |
Adjusted for age, sex, income, urbanization, chronic kidney disease, COPD, depressive disorder antidiabetic drugs, and drug adherence.
There were higher proportions of progressive subgroups in people older than 70 years, living in a low urbanized area, and earning a low income; comorbidities included heart failure, chronic kidney disease, COPD, stroke, and all diabetic complications. The characteristics of four different diabetic progression grades are shown in Table 1. In the four grades of the progression groups, the mean aDCSI scores were approximately 0.7–0.8 on the day of diabetes onset, and mean component counts were approximately 0.5–0.6. Higher proportions of diabetic complications and shorter follow-up times were found in the more progressed diabetic patients.
The risks of dementia were associated with the progression in aDCSI score. Compared with mild progressive diabetic patients (aDCSI score increasing <0.5 per year), the adjusted HRs were increased with diabetic progression (HRs 2.38, 6.95, and 24.0 with the increase of aDCSI score per year of 0.51–1.00, 1.01–2.00, and >2.00 vs <0.50 with P < .001 for trend) (Table 3) (Figure 1). To examine whether a significant early progression effect exists, we further examined the effects of the first 6-year progression on dementia (Table 4). After adjusting for the confounding factors, we found that the first 6-year progression of diabetes was associated with a significantly higher risk of dementia. When vascular dementia was excluded, a similar result was noted (Supplemental Table 1).
Incidence Rates and HRs of aDCSI Change for Dementia in Diabetes Cohort, Analyzed by Cox Proportional Hazards and 95% CIs
| Change in aDCSI Score per Year | n | Person-Years | Dementia | |||
|---|---|---|---|---|---|---|
| n | Incidence Ratea | Crude HR (95% CI) | Adjusted HR (95% CI)b | |||
| 0–0.5 | 327 796 | 2 109 729.7 | 15 190 | 72.0 (70.9–73.2) | 1.0 | 1.0 |
| 0.5–1 | 58 375 | 334 020.7 | 5791 | 173.4 (169.0–177.9) | 2.4 (2.4–2.5) | 2.4 (2.3–2.5) |
| 1–2 | 22 920 | 66 196.4 | 3068 | 463.5 (447.4–480.2) | 8.5 (8.1–8.8) | 7.0 (6.7–7.3) |
| >2 | 22 087 | 15 908.8 | 2807 | 1764.4 (1700.4–1830.9) | 40.8 (38.9–42.9) | 24.0 (22.8–25.3) |
Incidence rate: per 104 person-years.
Adjusted for age, sex, income, urbanization, chronic kidney disease, COPD, depressive disorder, antidiabetic drugs, and drug adherence.
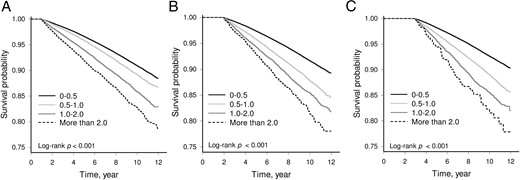
Kaplan-Meier curves of the cumulative incidence of dementia in the four groups of the aDCSI score change (<0.5, 0.5–1.0, 1.0–2.0, and > 2.0) from diabetes onset to the end of the first year (A), the second year (B), and the third year (C) (log rank P < .001).
Multivariable Cox Model Measured HRs and 95% CIs for Dementia for the First Six Years of aDCSI Change
| Year | n | Adjusted HR (95% CI)a | ||||
|---|---|---|---|---|---|---|
| Change of aDCSI Score per Year | ||||||
| 0–0.5 | 0.5–1 | 1–2 | >2 | P for Trend | ||
| 1 | 387 918 | 1.00 | 1.10 (1.06–1.14) | 1.40 (1.35–1.46) | 1.65 (1.56–1.74) | <.001 |
| 2 | 350 120 | 1.00 | 1.30 (1.25–1.35) | 1.53 (1.46–1.61) | 1.97 (1.77–2.19) | <.001 |
| 3 | 312 379 | 1.00 | 1.33 (1.29–1.38) | 1.66 (1.56–1.76) | 2.60 (2.09–3.23) | <.001 |
| 4 | 274 426 | 1.00 | 1.38 (1.32–1.45) | 1.73 (1.60–1.88) | 3.02 (1.90–4.80) | <.001 |
| 5 | 237 480 | 1.00 | 1.40 (1.34–1.47) | 1.98 (1.78–2.21) | 4.19 (1.74–10.1) | <.001 |
| 6 | 200 801 | 1.00 | 1.47 (1.38–1.56) | 1.96 (1.68–2.28) | 6.62 (1.65–26.5) | <.001 |
| End of follow-up | 431 178 | 1.00 | 2.38 (2.30–2.45) | 6.95 (6.66–7.25) | 24.0 (22.8–25.3) | <.001 |
Adjusted for age, sex, income, urbanization, chronic kidney disease, COPD, depressive disorder antidiabetic drugs, and drug adherence.
For subjects with different diabetic complications, the effects on dementia were varied. Neuropathy, cerebrovascular and metabolic complications were associated with dementia, but nephropathy and cardiovascular complications had negative associations with dementia (Supplemental Table 2).
Sensitivity analysis
This adjustment had little effect on the estimates from different models of association between diabetic progression and the incidence of dementia. Table 5 also shows that the effects of diabetic progression remain significant against dementia in gender, each age subgroup, comorbidities, diabetic drugs, and drug adherence.
HRs of Dementia Risk in Diabetes Cohort, Analyzed in Subgroup by Cox Proportional Hazards Regression
| Subgroups | n | Adjusted HR (95% CI)a | |||
|---|---|---|---|---|---|
| Change of aDCSI Score per Year | |||||
| 0–0.5 | 0.5–1 | 1–2 | >2 | ||
| Age, y | |||||
| 50–59 | 49 321 | 1.0 | 5.2 (4.5–6.0) | 30.2 (24.4–37.5) | 107.9 (76.9–151.3) |
| 60–69 | 191 800 | 1.0 | 3.4 (3.2–3.6) | 12.9 (11.8–14.0) | 58.3 (52.3–65.1) |
| 70–79 | 141 973 | 1.0 | 2.2 (2.1–2.3) | 6.9 (6.4–7.3) | 27.0 (25.0–29.2) |
| ≥80 | 48 084 | 1.0 | 1.2 (1.2–1.3) | 3.0 (2.7–3.2) | 10.1 (9.2–11.0) |
| Sex | |||||
| Female | 217 927 | 1.0 | 2.5 (2.4–2.6) | 6.8 (6.4–7.2) | 24.2 (22.5–26.0) |
| Male | 213 248 | 1.0 | 2.2 (2.1–2.3) | 7.1 (6.7–7.6) | 26.5 (24.6–28.6) |
| Medical diseases | |||||
| Hypertension | |||||
| Yes | 346 805 | 1.0 | 2.4 (2.3–2.5) | 7.2 (6.9–7.5) | 27.1 (25.7–28.7) |
| No | 84 373 | 1.0 | 2.2 (2.0–2.4) | 5.4 (4.7–6.2) | 15.2 (13.1–17.6) |
| Coronary heart disease | |||||
| Yes | 240 592 | 1.0 | 2.3 (2.2–2.4) | 7.2 (6.8–7.6) | 28.6 (26.7–30.5) |
| No | 190 586 | 1.0 | 2.6 (2.4–2.7) | 6.7 (6.2–7.2) | 20.8 (19.1–22.7) |
| Hypercholesterolemia | |||||
| Yes | 250 358 | 1.0 | 2.6 (2.4–2.7) | 8.8 (8.3–9.4) | 38.9 (35.9–42.1) |
| No | 180 820 | 1.0 | 2.1 (2.0–2.2) | 5.4 (5.0–5.7) | 18.1 (16.8–19.3) |
| Heart failure | |||||
| Yes | 90 026 | 1.0 | 1.7 (1.6–1.8) | 5.1 (4.8–5.5) | 19.9 (18.3–21.7) |
| No | 341 152 | 1.0 | 2.8 (2.6–2.9) | 8.3 (7.8–8.8) | 28.6 (26.8–30.6) |
| Chronic kidney disease | |||||
| Yes | 41 883 | 1.0 | 1.6 (1.4–1.7) | 5.0 (4.5–5.5) | 20.1 (17.6–22.9) |
| No | 389 295 | 1.0 | 2.5 (2.4–2.6) | 7.4 (7.1–7.8) | 26.1 (24.7–27.7) |
| Depressive disorder | |||||
| Yes | 53 992 | 1.0 | 2.1 (2.0–2.3) | 6.9 (6.3–7.5) | 25.1 (22.6–28.0) |
| No | 377 186 | 1.0 | 2.4 (2.4–2.5) | 7.0 (6.7–7.4) | 25.5 (24.0–27.1) |
| COPD | |||||
| Yes | 128 043 | 1.0 | 2.1 (2.0–2.2) | 6.5 (6.1–6.9) | 24.0 (22.2–25.9) |
| No | 303 135 | 1.0 | 2.6 (2.5–2.7) | 7.3 (6.9–7.8) | 26.2 (24.4–28.2) |
| Stroke | |||||
| Yes | 183 178 | 1.0 | 2.1 (2.0–2.2) | 6.7 (6.4–7.1) | 27.6 (25.9–29.4) |
| No | 248 000 | 1.0 | 2.2 (2.0–2.3) | 5.3 (4.9–5.8) | 15.1 (13.7–16.6) |
| Drugsb | |||||
| Insulin | 41 253 | 1.0 | 2.1 (1.9–2.2) | 5.0 (4.6–5.4) | 14.3 (13.0–15.7) |
| Metformin | 237 006 | 1.0 | 2.9 (2.7–3.0) | 11.4 (10.7–12.2) | 50.6 (45.2–56.6) |
| Sulfuria | 247 217 | 1.0 | 2.8 (2.7–3.0) | 10.6 (10.0–11.3) | 47.9 (43.5–52.7) |
| Thiazolidinedione | 44 238 | 1.0 | 3.3 (3.0–3.8) | 18.9 (15.7–22.8) | 91.9 (62.1–135.8) |
| Other | 74 603 | 1.0 | 2.6 (2.4–2.9) | 10.7 (9.4–12.1) | 45.9 (36.6–47.5) |
| Drug adherencec | |||||
| 0–0.25 | 141 393 | 1.0 | 2.0 (1.9–2.2) | 5.7 (5.3–6.1) | 21.8 (20.1–23.6) |
| 0.25–0.5 | 95 090 | 1.0 | 2.7 (2.5–2.9) | 7.7 (6.9–8.6) | 26.0 (22.7–29.8) |
| 0.5–0.75 | 103 355 | 1.0 | 2.5 (2.4–2.7) | 7.8 (7.0–8.6) | 25.1 (22.0–28.8) |
| 0.75–1.0 | 91 340 | 1.0 | 2.4 (2.2–2.5) | 7.3 (6.7–7.9) | 21.0 (18.9–23.3) |
Adjusted for age, sex, income, urbanization, chronic kidney disease, COPD, depressive disorder, antidiabetic drugs, and drug adherence.
Each class of antidiabetic drug was defined as subjects who were ever exposed for at least 180 days during the period of study.
Drug adherence was defined as the total days of antidiabetic therapies divided by the total days of diabetic course.
Discussion
To the best of our knowledge, this was the first nationwide study to examine the association between the severity and progression of diabetes and newly diagnosed dementia in an older population. The results of our 12-year population-based cohort study suggest that the diabetic complication severity and the change in severity were associated with an increased incidence of dementia in new-onset diabetic patients.
The diabetic patients with more severity had higher risk of dementia. In our first 10-year data set, an increased aDCSI score was positively related to the risk of dementia (Table 2). Diabetic factors are related to dementia or cognitive impairment. The stage and duration of diabetes are important factors related to the risk of developing cognitive impairment (23). Mild cognition impairment is associated with an onset of diabetes before the age of 65 years, diabetes duration of 10 years or longer, treatment with insulin, and the presence of diabetic complications (13). Although the diabetic factors were not the same as diabetic severities, they were related to different dimensions of severities. Furthermore, despite the duration of diabetes, the HRs were stable in our aDCSI score groups. This means that the risk of dementia did not increase without diabetic progression.
Glucose level is an important indicator for the condition of diabetic patients, but it is still complicated to predict the risk of dementia in diabetes. Higher-than-average glucose level is also related to an increased risk, not only in diabetic patients but also in people without diabetes (24). Higher blood glucose levels as indicated by higher glycohemoglobin levels were associated with worse cognitive performance (25), but in the study of middle-aged population, hyperglycemia, as measured by glycohemoglobin, did not add predictive power beyond diabetes status for a 6-year cognitive decline (26). Higher glucose levels may contribute to an increased risk of dementia through several potential mechanisms, including acute and chronic hyperglycemia and insulin resistance, increased microvascular disease of the central nervous system (CNS) (24), and toxic effects on neurons in the brain (27). Osmotic insults and oxidative stress may be involved in the mechanism, and the maintenance of chronic high glucose leads to the enhanced formation of advanced glycation end products, which have potentially toxic effects on neurons (27). In addition to the higher glucose level, hypoglycemia may contribute to the pathogenesis of dementia through several possible mechanisms. Hypoglycemia has been shown to result in brain damage, neuronal death, and cerebrovascular disease (28). In addition, other hypothetical mechanisms, such as impaired neurogenesis, dysfunction in the blood-brain barrier, inflammation, and vascular dysfunction, have also been proposed (27). In our study, the results of diabetic complication severity and progression provided another indicator of the risk of dementia from the glucose level.
In addition to the onset age and the diabetic severity, diabetic progression may also be an important risk factor for dementia. The pattern of progression to type 2 diabetes in individuals is difficult to quantify (29). The severity increases with time after diabetes onset, but not every diabetic patient has the same progression and complications. To slow progress for the prevention of diabetic complications was the treatment goal in the diabetes treatments. Some surveys have demonstrated that tighter type 2 diabetes control could improve the risk of dementia (30). In our study, the progression of severity, which was calculated by the change in aDCSI, had significant effects on dementia starting in the early years of having diabetes in our study (Table 3). We measured the progression at the end of each of the first 6 years of diabetes (Table 4). Although the HRs of the first few years were not the same as the end of the study, the risk of dementia increased with the progression of diabetes (P for trend <.001).
The aDCSI score was associated with the risk of dementia in the diabetic period and in the prediabetic period. Type 2 diabetes is usually diagnosed in adulthood, leaving a longer preonset time span over which the disease may progress compared with a disease of younger onset. Microvascular and macrovascular damage starts during prediabetes and is associated with an increased risk of cardiovascular disease early in the progression to diabetes (31). Modest cognitive decline is found during the early stage of diabetes (32). Patients in a prediabetic (33, 34) or an early stage (1, 32) of diabetes have a higher risk of cognitive impairment. In our study, diabetic severity was associated with dementia risk at the onset of diabetes (Table 2).
Among the different components of complications, the effects on dementia are controversial. In our study, cerebrovascular (adjusted HR 2.10, 95% CI 2.05–2.15), metabolic (adjusted HR 1.38, 95% CI 1.31–1.46), and neuropathic complications (adjusted HR 1.13, 95% CI 1.05–1.22) conferred significant risk of dementia (Supplemental Table 2). However, cardiovascular complications, nephropathy, and retinopathy had inverse effects on the risk of dementia. Cerebrovascular disease was a major contributor to later-life dementia, especially vascular dementia (35). Metabolic complication, especially hypoglycemia, is more serious and may be associated with an increased risk of dementia (36–38) In our study, hypoglycemia was associated with significant risk of dementia (adjusted HR 1.30, 95% CI 1.22–1.40) (Supplemental Table 2). The risk of diabetic complications is strongly associated with previous hyperglycemia (39). With regard to diabetic neuropathy, both diabetes and Alzheimer's disease share many pathological features in the brain and the peripheral nervous system (40). For other traditional microvascular complications, such as retinopathy and nephropathy, the association with the risk of dementia or cognitive impairments is controversial (41, 42). In our study, there were inverse associations among cardiovascular complications, nephropathy and retinopathy, and risk of dementia.
In our study, older patients living in a less urbanized area with low income comprised a relatively large portion of the faster-progression groups. The older patients had more comorbid illnesses and a higher risk for dementia. Patients living in a less urbanized area with low income were considered to be of a lower social class. Death rates from diabetes mellitus are higher in lower socioeconomic classes, and a higher risk for vascular disease in persons with diabetes of lower social class may be a possible reason (43, 44). In our study, a similar distribution was found in the progressive patients. Although there were demographic differences in different progressive groups, the baseline severities of our progression groups were similar (the mean aDCSI scores were ∼0.7–0.8 on the day of diabetes onset, and the mean component counts were ∼0.5–0.6).
The effects of antidiabetic drugs on dementia are controversial (45, 46). Patients receiving insulin therapy are considered to have a more severe form of diabetes (10). In our study, insulin was prescribed more in the rapidly progressing patients (Table 1). Insulin therapy for more than 180 days did not increase the risk of dementia after adjustment (Supplemental Table 2). Insulin had little effect on the less progressive diabetic patients but showed greater protective effects on dementia in the rapid-progressive patients (Table 5). Because our data were from an insurance data set, we could not obtain the compliance of patients, and only drug adherence was obtained. About the drug adherence, the patients with better adherence (0.8–1.0) had less risk (HR 0.85) for dementia than the poorest adherence group (0–0.2) but did not have the best outcome [compared with the adherence groups 0.2–0.4 (HR 0.76), 0.4–0.6 (HR 0.64), and 0.6–0.8 (HR 0.61)] (Supplemental Table 2). To avoid poor drug compliance, we stipulated that antidiabetic medications had to be prescribed for more than 180 days. All antidiabetic drugs and drug adherence were confounding factors in our statistical model.
Strengths and limitations
This study had a number of strengths. The participants were drawn from a population-based and highly representative computerized database of medical records spanning 12 years. Because data were obtained from a historical database that collected all available medical information before the date of dementia diagnosis, we can rule out the possibility of recall bias. The participants were new-onset diabetic patients, and prediabetic and diabetic stages were both evaluated. The participants were followed up from the age of 50 years; therefore, early-onset dementia cases could be evaluated in our study. Because most diabetic complications were micro- or macrovascular diseases and vascular dementia is highly associated with diabetes (5), we further examined the association between diabetic progression and nonvascular dementia by excluding vascular dementia. The effects on nonvascular dementia were still significant and similar to all incident dementia in diabetic progression (Supplemental Table 1).
The potential limitations of this study should be noted. First, we used only the clinical diagnosis of dementia; no biomarkers were included in the diagnosis. Because the diagnosis was from ICD-9 codes in our insurance database, the subtypes of dementia, Alzheimer's disease, and vascular dementia were grossly undercoded in these kinds of database (47). We considered some subgroup subjects were coded as unspecified dementia. The subgroups of dementia in ICD-9 were the limitation of our study. Although the progression of diabetes had the similar effects on the risk of dementia and nonvascular dementia (Supplemental Table 1), the further studies about the severity and progress and the risk of dementia subgroups are needed. Second, the incidence of dementia may be lower than the community incidence rate because not all patients with developing dementia seek treatment (48). Third, several potential unreported confounding factors that are also associated with dementia, including serum glucose, body mass index, smoking, alcohol intake, over-the-counter drug use, education level, and baseline cognitive functioning, were not included in our database. Fourth, the aDCSI, which was used to evaluate the diabetic severity in our study, was based on clinical practice without laboratory data and was an unweighted index that did not independently test adverse outcomes associated with each complication (22). Finally, the study included Taiwanese patients only; the results might not be generalizable to other populations.
Conclusions
Diabetic patients with rapid progression and exacerbated severity had a higher risk of dementia. The progressive severity in the early years after onset might increase the risk of dementia. The prevention of diabetic progression is an important factor in reducing the risk of dementia.
Acknowledgments
Author contributions included the following: P.-C.C. conceived of the study and supervised all aspects of its implementation. W.-C.C. completed the analyses and drafted the content. W.-C.H., D.-L.L., C.-C.C., and Y.-P.S. assisted with the study design and revised the content. M.-H.L. assisted with the statistical analysis and revised the content. All authors helped to conceptualize the ideas, interpret the findings, and review the drafts of the manuscript.
This work was supported in part by Grant CGH-MR-A10327 from Cathay General Hospital, Taipei, Taiwan.
This study is based in part on data obtained from the National Health Insurance Research Database provided by the Bureau of National Health Insurance, Department of Health, and managed by the National Health Research Institutes.
The interpretations and conclusions contained herein do not represent those of the Bureau of National Health Insurance, the Department of Health, or the National Health Research Institutes.
Disclosure Summary: The authors have nothing to disclose.
Abbreviations
- aDCSI
adapted Diabetes Complications Severity Index
- CI
confidence interval
- COPD
chronic obstructive pulmonary disease
- DCSI
Diabetes Complications Severity Index
- HR
hazard ratio
- ICD-9
International Classification of Diseases, ninth revision
- NHI
National Health Insurance
- NHRI
National Health Research Institute.
