


Endogenous glucocorticoids are known to increase blood pressure, but very little is known about the early effects of synthetic glucocorticoids (eg, prednisone, dexamethasone) on blood pressure.
To assess longitudinal variations of blood pressure before and after initiation of systemic glucocorticoid therapy.
Adult patients prescribed synthetic glucocorticoid therapy for at least 3 months and registered between 2004 and 2012 in The Health Improvement Network (THIN) primary care database.
Systolic and diastolic blood pressure as measured in primary care.
Among the 16 351 patients prescribed antihypertensive drug within the year before glucocorticoid initiation (women, 57.1%; age [mean ± SD], 72.0 ± 11.4 y), the mean (SD) blood pressure within the year before glucocorticoid initiation was 140 (18)/78 (9) mm Hg. It was 139 (19)/77 (11), 139 (19)/77 (10), and 139 (19)/77 (11) mm Hg during the first, second, and third months of exposure, respectively. We did not find any evidence of the effects of glucocorticoids on blood pressure in these patients. Among the 6914 patients not prescribed antihypertensive drug within the year before glucocorticoid initiation (women, 64.9%; age, 60.0 ± 17.8 y), the figures were 133 (17)/78 (10), 135 (20)/79 (11), 133 (19)/78 (11), and 133 (19)/78 (11) mm Hg before exposure and during the first, second, and third months of exposure, respectively. In this group of patients, glucocorticoid exposure was associated with a slight (<1 mm Hg; P = .03) increase of systolic but not diastolic (P = .52) blood pressure. However, in 4% of people or fewer, extreme increases or decreases (ie, ≥30 mm Hg for systolic blood pressure) in blood pressure were observed after glucocorticoid initiation. Prednisone/prednisolone use was associated with a higher risk of extreme increase in systolic blood pressure than the other synthetic glucocorticoids (odds ratio, 4.9 [95% confidence interval, 1.9–12.6]; P = .001).
Contrary to what is usually thought, the increase of blood pressure during the first months of exposure to synthetic glucocorticoids seems clinically nonsignificant.
Endogenous glucocorticoids are known to increase blood pressure. Up to 80% of people diagnosed with Cushing's syndrome suffer from hypertension at the time of diagnosis (1–3). This occurs through activation of the mineralocorticoid receptor in the kidney, although this may not be the primary mechanism for this effect (3–5). It is also known that the mineralocorticoid activity of the natural glucocorticoids may be enhanced or attenuated by the addition or subtraction of functional groups (eg, 6α-fluoro, 11-keto, 16-methyl, or Δ1-dehydro) (5–7), a fact used in the manufacture of synthetic glucocorticoids to improve their benefit/risk ratio. Consequently, mineralocorticoid activity of synthetic glucocorticoids appears to be three to 50 times lower than that of the natural hormone, cortisol (8). Hence, their potential to directly induce hypertension is questionable. Although hypertension is considered to be a frequent and life-threatening adverse event of glucocorticoid therapy, very little is known about it to assist clinicians with its prevention, diagnosis, and management. In the literature, the prevalence of hypertension in people prescribed synthetic glucocorticoids is highly variable between 0 to 90% (9–11). This wide range may be explained, at least partly, by the duration of glucocorticoid exposure, with people prescribed glucocorticoids for long durations probably being at higher risk of hypertension due to glucocorticoid-induced weight gain, visceral adiposity, and lipodystrophy (12, 13).
The aims of this study were: 1) to describe early changes in blood pressure (ie, during the first 3 months of exposure) in people prescribed systemic synthetic glucocorticoids in primary care; and 2) in instances of substantial blood pressure variations, to assess the factors associated with these variations.
Subjects and Methods
Data source: The Health Improvement Network
Approximately 98% of the population in the United Kingdom is registered with a general practitioner (14). The Health Improvement Network (THIN) is a database of electronic medical records from general practices. Participating general practitioners systematically and prospectively retrieve and enter clinical information on patients, including demographics data, diagnoses, and prescriptions so that the database provides a longitudinal medical record for each patient. The data are collected for clinical purposes during routine general practice and therefore reflect “real life” clinical care. Comparisons to external statistics and other independent studies have shown that both the clinical diagnostic and prescribing information is well recorded and accurate (15–17). For this study, we used data from January 1, 2004, to December 31, 2012, from 534 general practices.
Glucocorticoid prescriptions and study population
We included people aged 18 years and older who were prescribed systemic synthetic glucocorticoids (ie, prednisolone, prednisone, dexamethasone, triamcinolone, betamethasone, methylprednisolone, and deflazacort) (18). We selected only people prescribed glucocorticoids for at least 3 months. For people who received multiple courses of glucocorticoids during the study, we included only the first course. In the case of multiple consecutive prescriptions, we considered that the prescriptions were part of a single course of therapy if the previous prescription was issued less than 3 months earlier. We calculated the average daily dosage by multiplying the number of tablets prescribed by the dose/tablet (calculated in prednisone-equivalent), and this was divided by the number of days for which the drug was prescribed. The medical diagnosis recorded on the date of starting glucocorticoids was used as the indication for the prescription.
Blood pressure measurements
We extracted data on recorded blood pressure measurements on all individuals fulfilling our selection criteria. This included all measurements recorded within 1 year before glucocorticoids were initiated and those recorded within the first 3 months of exposure. We chose to examine variations of blood pressure during the first months of exposure rather than in people prescribed glucocorticoids for longer periods to limit the impact of glucocorticoid-induced weight gain, visceral adiposity, or lipodystrophy on blood pressure variations. In people initiated antihypertensive drugs during the first 3 months of glucocorticoid exposure, only blood pressure measurements before antihypertensive drug initiation were taken into account.
Covariates of interest
Covariates in our study included age at the time of glucocorticoid prescription, gender, smoking status based on the most recent record, and body mass index (BMI) recorded within the year previous to glucocorticoid prescription. We also extracted information on any recorded history of hypertension.
Statistical analysis
We analyzed only the data on people with blood pressure measurements available both within the year before glucocorticoid initiation and during the first 3 months of exposure (ie, complete case analyses). We conducted separate analyses on people prescribed any antihypertensive drug (that is, diuretics, aldosterone antagonists, β and α blockers, angiotensin-converting enzyme inhibitors, angiotensin II receptor antagonists, calcium channel blockers, α-2 agonists) during the year before glucocorticoid initiation and on people not prescribed antihypertensive drugs during this time period. Longitudinal variation of blood pressure before and after glucocorticoid initiation was examined in these populations using multilevel mixed-effects linear regression models controlling for gender, age, smoking status, BMI, type of prescribed glucocorticoid, average initial daily dosage, underlying disease, and history of hypertension.
Because we only found significant variations of systolic blood pressure in people not exposed to antihypertensive drugs, we further focused our secondary analyses on this population. We first performed sensitivity analyses by applying multiple imputation of missing data for blood pressure measurements to ensure that the results we found were not explained by a selected study population. In a second step, we searched for variables associated with extreme systolic blood pressure changes in the first 3 months after exposure to glucocorticoid. We defined extreme variations as an increase or a decrease of systolic blood pressure ≥ 30 mm Hg. Such variation is not frequently seen in daily practice, but our purpose was to identify patients with clear variations of blood pressure during glucocorticoid exposure. Groups (ie, extreme increase, extreme decrease, and no extreme variations of systolic blood pressure on glucocorticoids) were compared using logistic regression models adjusted on gender, age, underlying disease, mean initial daily dosage and type of glucocorticoid, BMI, smoking status, and history of hypertension. Continuous variables are presented as mean ± SD and categorical variables as proportions. All analyses were performed using Stata 11.2 (StataCorp). The THIN scheme for obtaining and providing anonymous patient data to researchers was approved by the National Health Service South-East Multicenter Research Ethics Committee in 2002. Furthermore, the study was approved by the THIN scientific review committee.
Results
Study population
During the study period, we identified 77 058 patients who were prescribed at least one course of systemic glucocorticoids ≥ 3 months (Figure 1). Among the 32 622 (42.3%) prescribed at least one antihypertensive drug within the year before glucocorticoid initiation, 16 351 (50.1%) had blood pressure measurement both within the year before and the 3 months after glucocorticoid initiation. Of the 44 436 (57.7%) remaining patients not prescribed any antihypertensive drug within the year before glucocorticoid initiation, 6914 (15.6%) had blood pressure recordings both before and during glucocorticoid exposure. The characteristics of these patients are reported in Table 1.
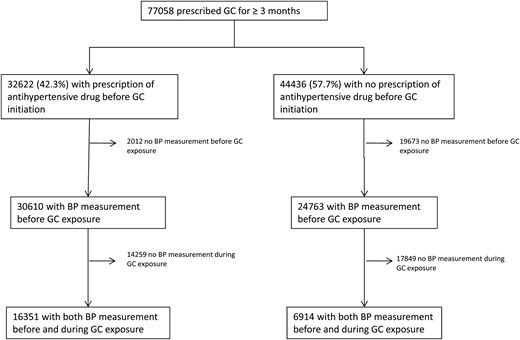
Flow chart of the study population.
GC, glucocorticoid; BP, blood pressure.
Study Population
| All People (n = 77 058) | Patients With BP Measured Before and During Glucocorticoid Exposure (n = 23 265) | ||
|---|---|---|---|
| People Not Prescribed Antihypertensive Drugs (n = 6914) | People Prescribed Antihypertensive Drugs (n = 16 351) | ||
| Female | 44 091 (57.2) | 4485 (64.9) | 9340 (57.1) |
| Mean age, y | 61.5 ± 20.1 | 60.0 ± 17.8 | 72.0 ± 11.4 |
| BMI, kg/m2 | |||
| Missing data | 26 205 (34.0) | 1741 (25.2) | 3095 (18.9) |
| Mean | 27.3 ± 6.2 | 26.7 ± 6.0 | 28.4 ± 6.1 |
| Smoking status | |||
| Missing data | 5212 (6.8) | 228 (3.3) | 402 (2.5) |
| Nonsmoker or ex-smoker | 32 662 (42.4) | 2969 (42.9) | 7237 (44.3) |
| Active smoker | 39 184 (50.8) | 3717 (53.8) | 8712 (53.3) |
| Prescribed drug | |||
| Prednisone or prednisolone | 65 080 (84.5) | 6032 (87.2) | 14 084 (86.1) |
| Dexamethasone | 5616 (7.3) | 432 (6.3) | 1054 (6.5) |
| Methylprednisolone | 4601 (5.9) | 338 (4.9) | 867 (5.3) |
| Othera | 1761 (2.3) | 112 (1.6) | 346 (2.1) |
| Mean daily dosage, mg/d | 11 ± 11 | 12 ± 12 | 11 ± 9 |
| Mean initial dosage, mg/d | 29 ± 27 | 29 ± 34 | 28 ± 22 |
| Mean total duration, mo | 10 ± 11 | 10 ± 12 | 10 ± 11 |
| Underlying disease | |||
| Asthma | 15 533 (20.1) | 1541 (22.3) | 2385 (14.6) |
| PMR/giant cell arteritis | 12 607 (16.4) | 1266 (18.3) | 3990 (24.4) |
| COPD | 10 804 (14.0) | 969 (14.0) | 2714 (16.6) |
| Cancer | 7749 (10.0) | 572 (8.3) | 1477 (9.0) |
| Rheumatoid arthritis | 3221 (4.2) | 343 (5.0) | 554 (3.4) |
| Other | 23 169 (30.1) | 1937 (28.0) | 4449 (27.2) |
| Unknown | 3975 (5.2) | 286 (4.1) | 782 (4.8) |
| Previous record of hypertension in the medical file | 25 907 (33.6) | 662 (9.6) | 13 114 (80.2) |
Abbreviations: BP, blood pressure; PMR, polymyalgia rheumatic; COPD, chronic obstructive pulmonary disease. Data are expressed as mean ± SD or number (percentage).
eg, triamcinolone, betamethasone, deflazacort.
Blood pressure variations
Of the 16 351 individuals prescribed antihypertensive drugs before glucocorticoid exposure and with blood pressure recordings both before and after glucocorticoid initiation, the mean (SD) blood pressure within the year before glucocorticoid initiation was 140 (18)/78 (9) mm Hg. It was 139 (19)/77 (11), 139 (19)/77 (10), and 139 (19)/77 (11) mm Hg during the first, second, and third months of exposure, respectively (Figure 2). In multivariable analysis, glucocorticoids were not associated with any variation of systolic or diastolic blood pressure in this group.
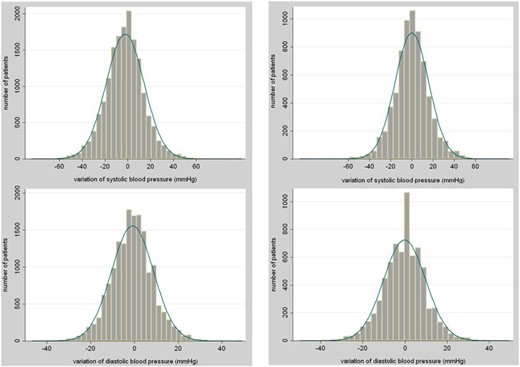
Variations of systolic and diastolic blood pressures in people prescribed antihypertensive drugs (left column) and in people not prescribed antihypertensive drugs (right column) before glucocorticoid initiation.
Among the 6914 individuals not prescribed antihypertensive drugs before glucocorticoid exposure and with blood pressure recordings both before and after glucocorticoid initiation, the mean (SD) blood pressure level within the year before glucocorticoid initiation was 133 (17)/78 (10) mm Hg. It was 135 (20)/79 (11), 133 (19)/78 (11), and 133 (19)/78 (11) mm Hg within the first, second, and third months of exposure, respectively (Figure 2). An antihypertensive medication was initiated for 204 (2.9%) of them during the first 3 months of glucocorticoids exposure, but for these patients, only blood pressure measured before antihypertensive drug initiation was taken into account in the analyses.
Multivariable analysis revealed that systemic glucocorticoids were associated with a slight increase of systolic (<1 mm Hg; P = .03), but not diastolic (P = .52), blood pressure during the first 3 months of exposure. Mean blood pressure slightly increased within the first month of glucocorticoid exposure for all age groups (Supplemental Table 1), and for all associated conditions except cancer, where a decrease was observed (Supplemental Table 2). Variations during the first months of exposure did not depend on the initial glucocorticoid daily dosage (Supplemental Table 3). After multiple imputation, we found that the baseline mean blood pressure in the overall population not prescribed antihypertensive drug (n = 44 436) was slightly lower than that of the complete cases (n = 6914), and we did not observe any overall increase of blood pressure after glucocorticoid initiation (mean blood pressure, 131/78, 132/78, 131/78, and 131/78 mm Hg within the year before exposure and the first, second, and third months of exposure, respectively).
Factors associated with extreme variations of blood pressure
In the population of patients not prescribed antihypertensive drugs before glucocorticoid initiation, we examined systolic blood pressure variations in further detail and found that the systolic blood pressure rose more sharply for some patients rather than for all patients. In 10% of the sample, it increased by more than 20 mm Hg, and in 4% it increased by more than 30 mm Hg. On the other hand, we observed a decrease in blood pressure by a similar proportion for some patients. A drop by 20 mm Hg occurred in about 10% of the sample and by 30 mm Hg in 3.5% (Figure 2). The characteristics of the patients with an extreme increase/decrease or with no substantial variation of systolic blood pressure are reported in Table 2. When those with an increase of systolic blood pressure ≥ 30 mm Hg were compared to those with no substantial variation, we found that they were significantly older (P = .01) and thinner (P < .001) and more frequently had a history of hypertension (P = .006) (multivariable analysis). Similar results were found when those with a decrease of systolic blood pressure ≥ 30 mm Hg were compared to patients with no substantial variation. We further found that these two groups were prescribed respectively more (P = .03) and less (P = .01) frequently prednisone/prednisolone than those with no substantial variation of systolic blood pressure. When the 269 patients with an increase of systolic blood pressure ≥ 30 mm Hg were compared to the 234 patients with a decrease ≥ 30 mm Hg in multivariable analysis, we found that these two groups were not significantly different in terms of gender (P = .50), age (P = .24), BMI (P = .08), smoking status (P = .46), initial glucocorticoid dosage (P = .25), or history of hypertension (P = .82). However, those with a substantial increase were more likely to be prescribed prednisone/prednisolone than those with a substantial decrease (odds ratio, 4.9 [95% confidence interval, 1.9–12.6], P = .001).
Characteristics of Patients With Extreme Variations of Systolic Blood Pressure During the First 3 Months of Glucocorticoid Exposure
| Decrease ≥ 30 mm Hg (n = 234) | No Variation > 30 mm Hg (n = 6411) | Increase ≥ 30 mm Hg (n = 269) | |
|---|---|---|---|
| Mean BP before exposure, mm Hg | |||
| Systolic | 154 ± 19 | 133 ± 17 | 123 ± 20 |
| Diastolic | 84 ± 11 | 78 ± 10 | 74 ± 11 |
| Mean BP after exposure, mm Hg | |||
| Systolic | 116 ± 18 | 132 ± 17 | 161 ± 21 |
| Diastolic | 71 ± 11 | 78 ± 10 | 86 ± 13 |
| Female | 145 (62.0) | 4164 (64.9) | 176 (65.4) |
| Mean age, y | 66.4 ± 15.6 | 59.6 ± 17.8 | 64.4 ± 16.5 |
| Mean BMI, kg/m2 | 25.8 ± 5.5 | 26.8 ± 6.0 | 24.8 ± 5.8 |
| Smoking status | |||
| Missing data | 12 (5.1) | 208 (3.2) | 8 (2.9) |
| Nonsmoker or ex-smoker | 96 (41.0) | 2762 (43.1) | 111 (41.3) |
| Active smoker | 126 (53.9) | 3441 (53.7) | 150 (55.8) |
| Prescribed drug | |||
| Prednisone or prednisolone | 183 (78.2) | 598 (87.3) | 251 (93.3) |
| Dexamethasone | 37 (15.8) | 386 (6.0) | 9 (3.3) |
| Methylprednisolone | 14 (6.0) | 320 (5.0) | 4 (1.5) |
| Othera | 107 (1.7) | 5 (1.9) | |
| Mean initial dosage, mg/d | 26.8 ± 21.1 | 28.9 ± 35.7 | 24.5 ± 17.8 |
| Underlying disease | |||
| PMR/giant cell arteritis | 38 (16.2) | 1180 (18.4) | 48 (17.8) |
| Asthma | 40 (17.1) | 1451 (22.6) | 50 (18.6) |
| COPD | 34 (14.5) | 887 (13.9) | 48 (17.8) |
| Cancer | 42 (18.0) | 510 (8.0) | 20 (7.5) |
| Rheumatoid arthritis | 11 (4.7) | 323 (5.0) | 9 (3.4) |
| Other or unknown | 69 (29.5) | 2060 (32.1) | 94 (34.9) |
| Past history of hypertension | 39 (16.7) | 579 (9.0) | 44 (16.4) |
Abbreviations: BP, blood pressure; PMR, polymyalgia rheumatic; COPD, chronic obstructive pulmonary disease. Data are expressed as mean ± SD or number (percentage).
eg, triamcinolone, betamethasone, deflazacort.
Discussion
This study of patients prescribed glucocorticoids suggests that systemic exposure to synthetic glucocorticoids is not associated with a clinically significant change in blood pressure during the first months of exposure, either in people prescribed antihypertensive drugs or in those not exposed to such treatment before glucocorticoid exposure. However, prednisone/prednisolone is associated with a higher risk of an extreme increase of blood pressure than other synthetic glucocorticoids.
Comparison with other studies
Synthetic glucocorticoids prescribed in daily care (eg, prednisone, dexamethasone) are known to induce hypertension. However, very few studies have focused on the incidence, natural history, or risk factors of this adverse event of glucocorticoid therapy, and the exact mechanisms by which synthetic glucocorticoids may induce hypertension are still unclear (19, 20). Moreover, the literature may be confusing in that although the term “glucocorticoids” (or “corticosteroids”) is used interchangeably, the effects on blood pressure of the natural (ie, cortisol) or the synthetic (eg, prednisone) glucocorticoids are different and should therefore be clearly differentiated. Although 80% of people with an endogenous hypercorticism exhibit hypertension at the time of diagnosis (1, 2), this figure should not be extrapolated to people with exogenous hypercorticism because the mineralocorticoid activity of the synthetic preparations is much lower than that of the natural hormone (8). Furthermore, whereas synthetic glucocorticoids may increase blood pressure after several months of exposure by inducing weight gain or lipodystrophy (12, 21), the early (ie, direct) effects of these drugs on blood pressure have been poorly studied.
There is some evidence supporting the fact that synthetic glucocorticoids may actually not be associated with an increase of blood pressure during the first weeks of exposure. In a study of rheumatoid arthritis patients, the risk of hypertension was not significantly different between those exposed (n = 472) and those unexposed (n = 307) to systemic glucocorticoids (22). In another study, 15.3% of 124 patients prescribed glucocorticoids for polymyalgia rheumatica developed hypertension, compared to 26.3% of the 57 patients who received nonsteroidal anti-inflammatory drugs (23). Furthermore, in a study of patients prescribed glucocorticoids for 8 weeks for chronic obstructive pulmonary disease, 5% of the 80 patients in the glucocorticoid group developed hypertension compared to 4% of the 111 patients in the placebo group (24). In a meta-analysis of studies evaluating synthetic glucocorticoids prescribed for the Guillain-Barré syndrome, significantly fewer glucocorticoid participants developed hypertension compared to those who received the placebo (relative risk, 0.15 [95% confidence interval, 0.05–0.41]) (25). On the other hand, there are studies showing an increase in risk of hypertension in people prescribed glucocorticoids. A meta-analysis of 93 randomized controlled trials showed a doubling of the risk of hypertension in patients exposed to glucocorticoids (sometimes for many months) compared to those exposed to placebo (odds ratio, 2.2 [1.4–3.8]) (26). In another study published in 1989 that included six healthy subjects exposed for 5 days to high-dose prednisolone, methylprednisolone, triamcinolone, and/or dexamethasone, it was found that all four glucocorticoids produced increases in blood pressure ranging from +6 to +13 mm Hg (27).
Surprisingly, there are very few data on risk factors of early hypertension in people prescribed synthetic glucocorticoids. In their study of 35 patients aged more than 65 years, Sato et al (28) reported that the 13 (37.1%) patients who developed hypertension had lower serum calcium concentrations and a more frequent family history of hypertension and were all prescribed more than 20 mg/d of prednisolone. We found that patients with an increase of systolic blood pressure ≥ 30 mm Hg were quite similar to those with a decrease of the same amount, except for the type of prescribed glucocorticoids. Interestingly, prednisolone is the synthetic glucocorticoid with the higher mineralocorticoid potency, ie, 2 to 50 times higher than that of the others drugs, although it is itself five times lower than that of cortisol (8).
Strengths and limitations of the study
Our study has several strengths. This includes the use of a very large population-based cohort with a wide range of diseases affecting both sexes and all age groups. We used a reference blood pressure that was defined over a long period time and not just before glucocorticoid initiation, when the exacerbation of the underlying disease is more likely to influence blood pressure values (29). However, there are some limitations. First, for people prescribed antihypertensive drugs before the initiation of glucocorticoid, it was not possible to account for variations in daily dosage of these drugs, and this may have impacted on the study results. However, it is unlikely that the antihypertensive therapies would have been modified without measurement of blood pressure, which would have therefore been captured in our analyses. Second, only 30% of patients had blood pressure measurement both before and during glucocorticoid exposure. This reflects primary care clinical practice. We believe that the complete case analysis may have overestimated the rise in blood pressure on glucocorticoids because those thought to be at higher risk of hypertension may have been more likely to be monitored. After multiple imputation of the missing blood pressure data, we did no longer evidence an increase of blood pressure after glucocorticoid initiation. Third, although we had a record of glucocorticoid prescriptions, no data were available on whether these drugs were taken by the patients. This may have induced a dilution on the true effect of the drugs. Fourth, a similar proportion of patients had an extreme increase or decrease of systolic blood pressure during the first 3 months of glucocorticoid exposure. We believe that these extreme variations may be associated with the underlying conditions rather than the glucocorticoid therapy. For instance, patients with an extreme drop of blood pressure may have had an unusually high blood pressure level during the weeks before glucocorticoid initiation because of the impact of the disease on their health. The same may be true for those with an extreme increase of blood pressure, due to the baseline impact of the underlying disease on their health and weight. These extreme variations may therefore be explained, at least partly, by a regression-toward-the-mean phenomenon. Fifth, our results reflect patients prescribed systemic glucocorticoids in primary care and cannot be extrapolated to people prescribed glucocorticoid in secondary or tertiary care facilities who often receive glucocorticoids iv or at higher dosages. Sixth, we did not have data about the quality of the blood pressure measurement in the participating general practices. However, more recently most general practitioners use mechanical devices for blood pressure measurement, hence limiting variability across centers and patients. Lastly, it is possible that glucocorticoids could have been stopped prematurely in people with extreme increases in blood pressure after initiation of glucocorticoid, and these would have been missed in our analyses. However, this almost never occurs in daily practice and is very unlikely to have biased our results.
Conclusion and perspectives
We did not find a significant rise in blood pressure within the first 3 months of starting synthetic glucocorticoids. In 4% of people on glucocorticoid therapy or fewer, however, extreme increases and decreases in blood pressure were observed. These extreme variations may be associated with the underlying conditions rather than the glucocorticoid therapy. However, physicians may be more likely to be reminded of patients with an increase of blood pressure (which they then attribute to the glucocorticoid therapy) rather than those with a decrease. On the other hand, other studies are required to assess the effects of synthetic glucocorticoid on blood pressure increases occurring after several months of exposure and their links to the glucocorticoid-induced morphological changes such as weight gain, visceral obesity, and lipodystrophy (12, 21).
Acknowledgments
Disclosure Summary: The authors have nothing to disclose.
