


A low response to controlled ovarian hyperstimulation implies a reduced number of embryos and impaired pregnancy rate. Follicular priming with steroids before controlled ovarian hyperstimulation has been suggested to improve the subsequent ovarian response.
The purpose of this study was to determine the best follicular priming protocol in low responders and to investigate the intrafollicular mechanisms triggered by steroid hormone priming.
This was a single-center, randomized, parallel, open-label, controlled trial, in two phases.
The setting was a university-based in vitro fertilization unit.
Potential low responders (n = 99) underwent a first intracytoplasmic sperm injection cycle. Confirmed low responders (n = 66) were randomized to different priming protocols before a new intracytoplasmic sperm injection.
Randomized patients underwent one of the following priming strategies: transdermal testosterone (20 μg/kg/d), transdermal estradiol (200 μg/d), or combined estrogens and oral contraceptive pills (30 μg of ethinyl estradiol plus 150 μg of desogestrel administered during the luteal phase of two consecutive cycles) and 4 mg/d of estradiol valerate during the follicular phase between them.
Metaphase II (MII) oocytes were retrieved. Gene expression levels in the granulosa cells of steroidogenesis enzymes and FSH, LH, and androgen receptors were measured.
The number of retrieved MII oocytes did not differ between the interventional groups (testosterone, 2.2 ± 2.0; estrogen, 2.7 ± 1.7; and combined estrogens and oral contraceptive pills, 2.0 ± 1.3; not significant). Compared with those in nonprimed cycles, estradiol pretreatment yielded more MII oocytes (primed, 2.7 ± 1.7; nonprimed, 1.6 ± 1.2; P = .029) although the clinical pregnancy rate was higher in patients treated with testosterone (P = .003). Testosterone pretreatment increased androgen receptor expression (P = .028) compared with that for the previous cycle without priming.
The results of the present trial do not support the superiority of one priming strategy over the others.
Low ovarian response (LOR) to controlled ovarian hyperstimulation (COH) is present in 9% to 24% of assisted reproduction technique cycles and is associated with poor outcomes, being today one of the main challenges in infertility treatment (1).
The main reason for the LOR is a decrease in ovarian reserve associated with age. Since the age for motherhood has been delayed in our modern society, many patients come to our units with a compromised follicular reserve.
Moreover, quantity and also quality are affected in the follicular machinery in LOR, which disturbs the physiological actions of gonadotropins in the follicle. Lower expression of FSH receptor (FSHR) in the granulosa cells from low responder (LR) patients has been described (2). Similarly, dysfunctional gene expression in ovarian steroidogenesis enzymes has been associated with a diminished ovarian response (3).
The management of LRs remains challenging. Different studies have been conducted to evaluate therapeutic approaches before and during COH, without reaching any consensus (4). One of the most commonly used strategies to improve the ovarian response is ovarian priming with steroidal hormones preceding COH.
It has been hypothesized that a short course of 17β-estradiol (E2) before COH may result in a suppression of a premature FSH rise in the luteal phase of the cycle preceding that of the COH, leading to a follicular cohort synchronization and more mature (metaphase II [MII]) oocytes retrieved (5). In line with this, Teramoto and Kato (6) have reported higher numbers of MII oocytes retrieved after follicular priming with a combination of oral contraceptive pills (OCPs) and estrogens. In addition, FSH and E2 promote accumulation of granulosa cell FSH receptors, and oocytes in an estrogenic microenvironment mature and ovulate (7).
There are also data in the literature suggesting that testosterone addition during the previous cycle may enhance the responsiveness of the ovaries to external FSH (8). In fact, in animal models, excess levels of androgen in the follicle increase FSHR expression in granulosa cells (9) and promote preantral and antral growth (10). Similarly, an association between androgen receptor (AR) expression in immature granulosa cells and the expression of FSHR in normal small human antral follicles and between follicular fluid levels of androgen and FSHR expression has recently been demonstrated (11).
From a clinical point of view, many studies have compared specific priming strategies with no priming or placebo before COH in LRs, suggesting an improvement in the number of collected mature oocytes and a significant decrease in cancellation rates (12–14). However, to date, no randomized controlled trial (RCT) comparing the different priming therapies has been published. Therefore, we designed the present study to determine the best priming strategy before COH (testosterone, estradiol, or a combination of OCPs and estrogens) in terms of the number of MII oocytes retrieved. The second aim of this study was to investigate the potential intrafollicular mechanisms triggered by these strategies and their effects on the ovarian response.
Subjects and Methods
Study design, setting, and patients
This study was a single center, parallel, randomized, controlled, open-label clinical trial carried out in two phases and performed at the in vitro fertilization (IVF) unit of La Fe University Hospital, between June 2011 and June 2013.
Phase 1
Potential LRs with an indication of intracytoplasmic sperm injection (ICSI) were invited to participate after providing written informed consent. The inclusion criteria are shown in Table 1. The clinical and demographic characteristics were systematically collected using a predefined electronic case record form. A COH protocol with a fixed dose of 300 IU/d of human recombinant FSH was initiated on menstrual cycle day 2. Pituitary suppression was achieved with 0.25 mg/d of cetrorelix acetate when at least one follicle exceeded a mean diameter of 14 mm, and ovulation was induced by sc administration of 0.2 mg of triptorelin acetate. A detailed description of the stimulation protocol and IVF procedures is provided in the Supplemental Methods.
Study Inclusion and Exclusion Criteria
| Inclusion Criteria Phase 1 (Verification of Low Response)a | Inclusion Criteria Phase 2 (Randomization to Interventions)b | Exclusion Criteria (Phase 1 and Phase 2) |
|---|---|---|
| Maternal age ≥38 years old | Development of ≤4 follicles of >16 mm on the day of ovulation triggering | Endometriosis |
| AFC ≤6 on day 3 of the menstrual cycle | Serum level E2 ≤500 pg/mL on the day of ovulation triggering | PCOS patients (Rotterdam criteria) |
| Serum basal FSH level ≥10 mIU/mL | ≤4 mature oocytes retrieved | Severe male factor (<1 million TMS) |
| AMH ≤5 pmol/L | Absence of signed consent |
Abbreviations: PCOS, polycystic ovary syndrome; TMS, total motile sperm.
At least 2 inclusion criteria were required to be recruited in phase 1.
Patients having an ongoing pregnancy were not included, even if a poor response was confirmed. Only one inclusion criterion is required for phase 2.
Phase 2
After 3 months, confirmed LRs (see the criteria in Table 1) who did not become pregnant were randomized to 1 of 3 priming strategies (see Interventions below). A randomized allocation sequence was created using the Random Integer Generator (Random.org). An independent analyst who did not participate in the recruitment generated the sequence, and physicians were not aware of this sequence. Every time a new patient was included in phase 2, the analyst was contacted to assign the patient to a group. After priming, patients underwent the same COH protocol as that used in phase 1.
The study was approved by the institutional review board of our institution (code 2009-018009-26) and registered at clinicaltrials.gov (registration number NCT01310647).
Interventions
Luteal phase priming with transdermal testosterone (T group, n = 22)
Transdermal testosterone (20 μg/kg/d; Testopatch; Pierre Fabre Ibérica SA) was administered starting on day 24 of the previous menstrual cycle and extending until day 2 of menstruation according to a modification of the protocol published by Fábregues et al (12). COH was started on the day after the last testosterone patch application.
Luteal phase priming with transdermal 17β-estrogen (E group, n = 24)
Transdermal E2 (200 g/d; Chiesi) was administered from day 20 of the previous cycle until the second day of menstruation. Thus, patients applied 2 patches on day 20 of the previous cycle and changed them every fourth day. COH was started on the third day of the menstrual cycle.
Priming with combined estrogens and OCPs (EOCP group, n = 20)
The combination was administered during 2 consecutive menstrual cycles according to a modification of the protocol published by Teramoto and Kato (6). In brief, in the first cycle, ovulation was confirmed by ultrasound on day 15 of the cycle. A daily dose of 30 μg of ethinyl estradiol plus 150 μg of desogestrel (Microdiol; MSD) was administered for 14 days from the day after ovulation. In the following cycle, 4 mg/d of estradiol valerate (Meriestra 2 mg; Novartis) was prescribed orally from day 2 to day 16 of the cycle. Then, the OCP treatment was administered again for 14 days; 5 days after the last pill, COH was started.
Study outcomes
The primary outcome of our study was the number of MII oocytes retrieved. Secondary outcomes included cancelation rates, duration of stimulation in days, total doses of FSH (in international units) used, fertilization rates, patients with transfer, number of patients with top-quality embryos available for transfer, clinical pregnancy rates, and live birth rates per initiated cycle. Pregnancy was diagnosed by a serum β-human chorionic gonadotropin (hCG) determination 15 days after embryo transfer; clinical pregnancy was defined as a visible fetal pole with normal fetal heartbeat observed 4 weeks after β-hCG determination. Hormone levels were determined in the follicular fluid on the day of oocyte retrieval and also in blood serum on the first day of ovarian stimulation and on the day of ovulation triggering. Putative luteinized granulosa cells (LGCs) were isolated from individual patient follicular aspirate pools according to the protocol published by Kossowska-Tomaszczuk et al (15) and the amounts of FSHR and androgen receptor (AR) were determined by flow cytometry. mRNA from cumulus cells was extracted and subsequently used for quantitative RT-PCR (qRT-PCR) of the following genes: FSHR, LH receptor (LHR), AR, and the steroidogenesis enzymes StAR, CYP11A1, and CYP19A1. Complete descriptions of the hormonal determinations, the isolation of LGCs, FSHR and AR quantification by flow cytometry, and the qRT-PCR protocol are available in the Supplemental Methods.
Statistical methods
The sample size was calculated to detect differences of at least two MII oocytes within groups, based on the comparison of 3 means by one-way ANOVA. The effect size was estimated using data from previous studies (12, 16, 17). This analysis, based on a two-sided significance level (α error of .05 and power of 95%) revealed that at least 11 patients per arm should be included. Based on 2 assumptions: potential losses of 10% and minimization of the within-group effect due to the inclusion of only confirmed poor responders, we decided to randomize 66 patients in total.
All outcomes were analyzed with respect to the intention-to-treat population. Clinical pregnancy and live birth rates (CPR and LBR) were calculated per initiated cycle using the Fisher or McNemar test. Differences were considered significant if the P value was <.05. Statistical analysis was performed with the statistical software SPSS v20.0 (IBM) and G*Power 3 (Heinrich-Heine-Universität).
Results
Patients
A total of 175 patients were screened for eligibility, 99 potential LRs underwent the first ICSI cycle of whom 66 confirmed LRs were randomized to 1 of 3 priming interventions before the second ICSI cycle. Twenty-two patients were allocated to the T group, 24 to the E group, and 20 to the EOCP group. One patient allocated to the EOCP group became pregnant before the priming started and 2 more patients (1 in the E group and 1 in the EOCP group) dropped out of the study after randomization because they decided to undergo an oocyte donation treatment (Figure 1). The baseline and demographic characteristics of the 66 confirmed LRs participating in both phase 1 and phase 2 are presented in Table 2. Women allocated to the 3 priming protocols did not show any difference regarding their basal characteristics, having similar age, body mass index, and baseline hormonal determinations.
Demographics and Baseline Characteristics According to Intervention Group
| T Group (n = 22) | E Group (n = 24) | EOCP Group (n = 20) | P Value | |
|---|---|---|---|---|
| Age, y | 36.6 ± 2.4 | 36.3 ± 2.3 | 35.1 ± 3.3 | NS |
| Body mass index, kg/m2 | 23.2 ± 4.8 | 22.8 ± 4.0 | 23.6 ± 3.9 | NS |
| Cause of sterility, other than poor response | ||||
| Tubal occlusion | 1 (4.5) | 2 (8.3) | 1 (5.0) | NS |
| Fibroids | 0 (0) | 1 (4.2) | 0 (0) | NS |
| Duration of sterility, y | 4.7 ± 2.8 | 5.0 ± 2.7 | 4.1 ± 3.6 | NS |
| Previous IVF | 0 (0) | 1 (4.2) | 0 (0) | NS |
| Smoker status | 5 (22.7) | 8 (33.3) | 7 (35) | NS |
| Basal FSH, mIU/mL | 11.6 ± 4.6 | 12.9 ± 5.4 | 13.8 ± 4.9 | NS |
| AMH, pmol/L | 2.4 [1.0–14.0] | 2.0 [0.7–15.0] | 2.1 [0.7–10.0] | NS |
| AFC | 4.3 ± 1.6 | 4.0 ± 2.0 | 4.8 ± 1.6 | NS |
Continuous variables were tested for normality using the Kolmogorov-Smirnov test; data are expressed as means ± SD if normally distributed or as median (range) if not. When normally distributed, variables were analyzed using one-way ANOVA and when not using the Kruskal-Wallis test. Categorical variables are expressed as raw number (%). Comparisons of categorical variables were done using the χ2 test. Differences were considered significant at P < .05.
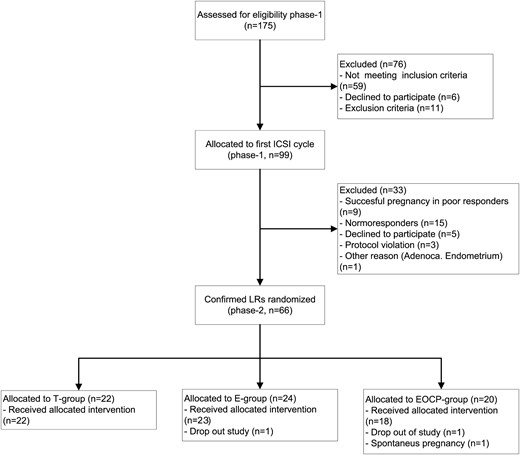
Participant flow diagram.
Effect of priming on COH (phase 1 vs phase 2)
COH outcomes before and after priming are summarized in Table 3. The basal levels of FSH were significantly lower after priming in the E group (T group, 10.3 ± 4.1 mIU/mL; E group, 4.9 ± 4.2 mIU/mL; EOCP group, 11.1 ± 7.5 mIU/mL; ANOVA P = .001). Primed cycles yielded higher numbers of total and MII oocytes retrieved in all groups, but only pretreatment with estradiol reached the significance level (P = .029). The number of cycles canceled due to the absence of an ovarian response did not vary after priming (phase 1, 7 [10.6%] vs phase 2, 7 [10.6%]; not significant [NS]).
COH Results Comparison Between Nonprimed Cycles and Primed Cycles (Phase 1 vs Phase 2) and Comparison Between Primed Cycles According to Intervention
| T Group | E Group | EOCP Group | Overall Population | |||||
|---|---|---|---|---|---|---|---|---|
| Nonprimed | Primed | Nonprimed | Primed | Nonprimed | Primed | Nonprimed | Primed | |
| FSH day 3, mIU/mL | 12.3 ± 6.1 | 10.3 ± 4.1a | 12.5 ± 6.2b | 4.9 ± 4.2a,b | 9.5 ± 4.9 | 11.1 ± 7.5a | 11.5 ± 5.9g | 8.5 ± 6.1g |
| AFC day 3 | 4.9 ± 1.5 | 4.8 ± 2.4 | 4.9 ± 2.3 | 5.9 ± 3.4 | 4.4 ± 1.8 | 4.2 ± 2.5 | 4.7 ± 1.9 | 5.0 ± 2.9 |
| Days of stimulation | 8.9 ± 2.9 | 9.4 ± 2.1 | 9.6 ± 2.3c | 11.1 ± 2.5c | 10.9 ± 3.3 | 9.4 ± 2.2 | 9.7 ± 2.9 | 10 ± 2.4 |
| Total IU of FSH | 2700 ± 888 | 2810 ± 642 | 2871 ± 700 | 3271 ± 799 | 3264 ± 988 | 2841 ± 672 | 2931 ± 872 | 2989 ± 732 |
| E2 on ovulation trigger day, pg/mL | 812.1 ± 391.9 | 891.2 ± 516.9 | 857.1 ± 511.7 | 1038 ± 469 | 895.2 ± 394.4 | 865 ± 322 | 851.9 ± 429 | 933.9 ± 450 |
| Endometrial thickness on ovulation trigger day, mm | 9.6 ± 1.9 | 9.8 ± 2.3 | 9.7 ± 1.9 | 10.2 ± 1.9 | 11.0 ± 2.5 | 9.6 ± 1.6 | 10.0 ± 2.1 | 9.8 ± 1.7 |
| No. of follicles >16 mm | 2.4 ± 1.2 | 2.4 ± 1.0 | 2.7 ± 1.6d | 3.8 ± 2.0d | 3.3 ± 1.5 | 2.3 ± 1.3 | 2.8 ± 1.4 | 2.8 ± 1.6 |
| No. of oocytes retrieved | 2.3 ± 1.9 | 2.7 ± 1.9 | 2.2 ± 1.3e | 3.6 ± 2.5e | 2.3 ± 1.7 | 2.2 ± 1.2 | 2.2 ± 1.6h | 2.9 ± 2.0h |
| No. of MII oocytes retrieved | 1.8 ± 1.5 | 2.2 ± 2.0 | 1.6 ± 1.2f | 2.7 ± 1.7f | 1.9 ± 1.2 | 2.0 ± 1.3 | 1.7 ± 1.3i | 2.4 ± 1.7i |
| Pregnancy rate, n (%) | 0j | 7 (31.8)j | 2 (8.3) | 6 (25) | 0 | 4 (20) | 2 (3)k | 17 (25.7)k |
| Live birth rate, n (%) | 0 | 5 (22.7) | 0 | 3 (12.5) | 0 | 3 (15) | 0l | 11 (16.7)l |
Continuous variables were tested for normality using the Kolmogorov-Smirnov test; data are expressed as means ± SD if normally distributed. Comparisons between arms (primed cycles) were analyzed using one-way ANOVA followed by the Bonferroni test using a P value adjusted to 0.016. Comparisons within patients (primed vs nonprimed cycles) were done using the Student t test for paired samples. Differences were considered significant at P < .05 or P < .016, and they are marked with superscripts: a E group vs T group: P = .009; E group vs EOCP group , P = .003;
primed vs nonprimed, P < .001;
primed vs nonprimed, P = .032;
primed vs nonprimed, P = .021;
primed vs nonprimed, P = .033;
primed vs nonprimed, P = .029;
primed vs nonprimed, P = .011;
primed vs nonprimed, P = .031;
primed vs nonprimed, P = .026;
primed vs nonprimed, P = .03;
primed vs nonprimed, P = .002;
primed vs nonprimed, P = .002.
CPR and LBR were higher in all groups after priming, although the differences were significant only for the T group CPR (T group: CPR, risk difference [RD] = 31.8%, 95% confidence interval [CI], 12.4–51.3; LBR, RD = 22.7%, 95% CI, 5.2–40.2; E group: CPR, RD = 16.7%, 95% CI, of −3.9 to 37.2; LBR, RD = 12.5%, 95% CI, −9.1 to 25.8; EOCP group: CPR, RD = 14.9%, 95% CI, −0.9 to 30.7; LBR, RD = 9.9%, 95% CI, −3.5 to 23.4). The overall CPR was significantly higher after priming (phase 1, 2 [3%] vs phase 2, 17 [25.7%]; P = .002) as it was the LBR (phase 1, 0 [0%] vs phase 2, 11 [16.7%]; P = .004). By definition, all of the above-mentioned comparisons did not take into account LRs who became pregnant in phase 1. When such patients were included in the analysis, CPR remained statistically higher after priming (CPR phase 1, 9 [10.7%] vs CPR phase 2, 17 [25.7%]; P = .018), although no statistically significant differences were evidenced any longer in terms of LBR (LBR phase 1, 7 [8.3%]vs LBR phase 2, 11 [16.7%]; NS).
Priming strategy-specific effect on COH (phase 2)
The COH outcomes in randomized LRs are summarized in Table 3. Among them, 6 patients with a dominant follicle or ovarian cyst at basal sonography did not start COH (T group, 3 [13.6%]; E group, 2 [8.3%]; EOCP group, 1 [5%]; NS). Pretreatment with E2 suppressed the basal FSH level more intensively than other priming treatments. Neither the mean number of follicles >16 mm the day of ovulation trigger nor the number of MII oocytes retrieved were different in either intervention group (Table 3). Differences in cancellation rates because of the lack of response to COH were not statistically significant (T group, 0 [0%]; E group, 5 [20.8%]; EOCP group, 2 [10.0%]; NS). Fertilization rates were similar among groups (T group, 84.0 ± 30.9; E group, 83.4 ± 20.6; EOCP group, 83.3 ± 30.4; NS). The numbers of patients who underwent embryo transfer were similar (T group, 14 [63.6%]; E group, 13 [54.2%]; EOCP group, 12 [66.7%]; NS). The CPR (T group, 7 [31.8%]; E group, 6 [25%]; EOCP group, 4 [20%]; NS) and LBR (T group, 5 [22.7%]; E group, 3 [12.5%]; EOCP group, 3 [15%]; NS) were higher with testosterone priming, but differences did not reach the significance level.
Serum and follicular fluid hormonal determinations
No differences between priming strategies were detected in the comparison of hormonal levels nor in serum or in follicular fluid (Table 4). When comparisons were made within subjects, T-primed and E-primed, but not EOCP-primed cycles yielded significantly higher estradiol follicular levels than their previous nonprimed cycles (T group, 1589.7 ± 876.4 pg/mL vs 731.7 ± 315.9 pg/mL, P = .009; E group, 1184.5 ± 517.7 pg/mL vs 733.7 ± 358.6 pg/mL, P = .003; EOCP group, 1181.8 ± 603.3 pg/mL vs 830.7 ± 709.4 pg/mL, NS). Patients in the E and EOCP groups showed significantly higher testosterone follicular levels after priming (T group, 16.3 ± 7.4 ng/mL vs 11.2 ± 4.1 ng/mL, NS; E group, 13.5 ± 4.3 ng/mL vs 10.6 ± 3.7 ng/mL, P = .027; EOCP group, 11.9 ± 3.4 ng/mL vs 9.3 ± 3.3 ng/mL, P = .045). Patients in the E and EOCP groups also showed significantly lower androstenedione follicular levels after priming (T group, 3.1 ± 1.6 ng/mL vs 5.3 ± 1.7 ng/mL, NS; E group, 2.1 ± 0.9 ng/mL vs 4.0 ± 1.9 ng/mL, P = .012; EOCP group, 2.5 ± 2.6 ng/mL vs 3.1 ± 2.5 ng/mL, P = .043).
Hormonal Serum Concentrations on Ovulation Trigger Day and Follicular Fluid Hormonal Determinations Between Nonprimed and Primed Cycles, According to Interventional Group
| T Group | E Group | EOCP Group | ||||
|---|---|---|---|---|---|---|
| Nonprimed | Primed | Nonprimed | Primed | Nonprimed | Primed | |
| Hormonal serum concentrations | ||||||
| FSH, mIU/mL | 19.4 ± 5.7 | 21.9 ± 3.8 | 19.2 ± 3.6 | 18.3 ± 4.5 | 18.2 ± 4.4 | 18.1 ± 5.1 |
| LH, mIU/mL | 3 ± 5 | 4.7 ± 5.9 | 3.1 ± 2.1 | 6 ± 14.3 | 1.8 ± 1.3 | 1.5 ± 1.3 |
| Estradiol, pg/mL | 812.1 ± 391.9 | 906.6 ± 556.6 | 857.1 ± 511.7 | 992.2 ± 477.5 | 895.2 ± 394.4 | 895.2 ± 315.8 |
| Progesterone, ng/dL | 0.5 ± 0.3 | 0.7 ± 0.4 | 0.6±.3 | 0.7 ± 0.3 | 1 ± 1.5 | 0.5 ± 0.2 |
| Testosterone, ng/dL | 0.4 ± 0.1 | 0.4 ± 0.2 | 0.4 ± 0.2 | 0.4 ± 0.1 | 0.3 ± 0.2 | 0.4 ± 0.2 |
| Free testosterone, ng/dL | 0.6 ± 0.2 | 0.6 ± 0.3 | 0.8 ± 0.2 | 0.7 ± 0.1 | 0.6 ± 0.2 | 0.7 ± 0.4 |
| Androstenedione, ng/dL | 2.2 ± 1.2 | 2.6 ± 1.3 | 2.3 ± 0.8 | 1.9 ± 0.5 | 2.5 ± 1.3 | 2.5 ± 1.2 |
| Follicular fluid concentrations | ||||||
| FSH, mIU/mL | 8.1 ± 1.7 | 9.8 ± 2.5 | 7.7 ± 1.1 | 7.6 ± 2.6 | 8.1 ± 2.4 | 7.8 ± 2.4 |
| LH, mIU/mL | 6.1 ± 1.8 | 7.9 ± 4.1 | 6.2 ± 3.5 | 4.6 ± 1.5 | 4.1 ± 2.5 | 5.8 ± 2 |
| Estradiol, pg/mL | 731.7 ± 315.9a | 1589.7 ± 876.4a | 733.8 ± 358.6b | 1184.5 ± 517.7b | 830.7 ± 709.4 | 1181.8 ± 603.3 |
| Progesterone, ng/dL | 12 108.8 [2441.3–73 761.8] | 35 510.9 [2638.1–110 015.0] | 72 487.6 [2113.4–103 704.6] | 50 297.7 [2901.2–132 039.5] | 13 826.0 [2242.6–24 407.6] | 56 674.3 [12 704.9–745 567.1] |
| Testosterone, ng/dL | 11.2 ± 4.1 | 16.3 ± 7.4 | 10.6 ± 3.7c | 13.5 ± 4.3c | 9.3 ± 3.3e | 11.9 ± 3.4e |
| Androstenedione, ng/mL | 5.3 ± 1.7 | 3.1 ± 1.6 | 4.0 ± 1.9d | 2.1 ± 0.9d | 3.1 ± 2.5f | 2.5 ± 2.6f |
Continuous variables were tested for normality using the Kolmogorov-Smirnov test; data are expressed as means ± SD if normally distributed or as median [range] if not. Comparisons within priming strategies (phase 2) were done using one-way ANOVA when normally distributed or the Kruskal-Wallis test when not. Comparisons within patients (phase 1 vs phase 2) were done using the Student t test for paired samples or the Wilcoxon test for paired samples when appropriate. Differences were considered significant at P < .05 and are marked with superscripts: a primed vs nonprimed, P = .009;
primed vs nonprimed, P = .003;
primed vs nonprimed, P = .027;
primed vs nonprimed, P = .012;
primed vs nonprimed, P = .045;
primed vs nonprimed, P = .043.
Quantification of FSHR and AR on luteinized granulosa cells
Percentages of LGCs positive for FSHR (FSHR+/CD45−/IP+) and AR (AR+/CD45−/IP+) quantified by flow cytometry are displayed in Supplemental Figure 1. No differences were seen when the three priming strategies or priming vs nonpriming within subjects was compared.
Overall, the comparison of pooled data (all priming groups) between priming cycles vs nonpriming cycles did not yield any significant difference in the percentage of cells positive for FSHR or AR (data not shown).
FSHR, LHR, AR, and steroidogenesis-related gene expression
Relative gene expression levels of FSHR, AR, LHR/LHC choriogonadotropin receptor, StAR, CYP11A1, and CYP19A1 did not differ between patients allocated to different priming groups. When cycles before and after priming were compared, AR mRNA expression was higher in patients allocated to receive testosterone before COH (median [range] normalized AR mRNA expression: 3.51 [0.01–45.58] before priming vs 3.99 [0.30–51.27] after priming, P = .028). Expression levels of the other genes studied did not reveal any differences when compared within subjects or within priming groups (Figure 2).
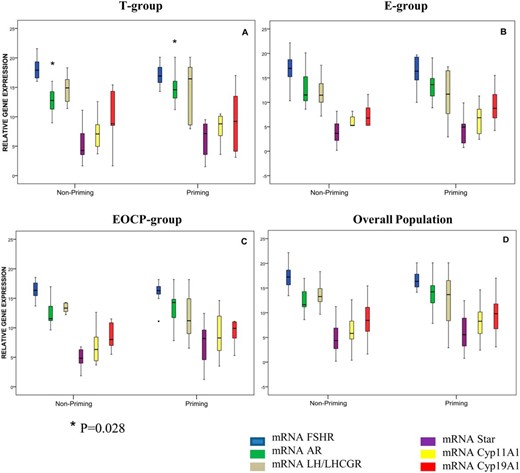
Relative gene expression levels of FSHR, AR, LHR/LH choriogonadotropin receptor (LH/LHCGR), STar, CYP11A1, and CYP19A1 according to interventional group.
Results of qRT-PCR performed on mRNA of FSHR, AR, and steroidogenesis-related genes are shown. The boxplots represent the median, 25th percentile, and 75th percentile of the distribution; the whiskers represent the minimum and maximum values. Comparisons within patients (priming vs nonpriming) were done using the Wilcoxon rank test for paired samples. Comparisons between priming strategies were done using the Kruskal-Wallis test. A, AR was overexpressed after priming in patients allocated to testosterone (P = .028). B and C, Patients allocated to estradiol (B) and combined estradiol and OCP (C) did not show any difference in expression of the study target genes after follicular priming. D, Overall, relative gene expression showed no statistically significant differences between nonpriming and priming cycles. No differences in gene expression were seen between the priming groups for any of the genes studied.
Overall, the comparison of pooled data (all priming groups) between primed cycles vs nonprimed cycles did not yield any significant difference in terms of expression levels for any of the genes studied (data not shown).
Discussion
In the present study, all priming strategies resulted in increased numbers of MII oocytes retrieved compared with that for the nonprimed cycle, but such differences were only significant in the E group. When comparisons were made between the different priming strategies, we failed to demonstrate any statistically significant difference among groups regarding the main predefined outcome: the number of MII oocytes retrieved. This is probably because all the interventions increased the number of MII oocytes retrieved to some extent. Although CPR and LBR were secondary outcomes in this study, it is of clinical relevance that they were significantly higher in the testosterone group than in the nonprimed cycle in the same patient. A similar tendency was found in a comparison with the other groups. Because the sample size of this study was not calculated to detect differences in CPR or LBR, we performed a subsequent power analysis for these variables and concluded that it was <40%. To have power enough to detect differences between priming strategies of at least 7.7% in LBR (those detected between EOCP and T groups), it would have been necessary to include at least 430 patients per arm.
To our knowledge, this is the first RCT comparing different follicular priming approaches. Because of the heterogeneity of the definition of LOR and the small sample size of most the clinical trials, poor evidence on the management of these patients has been reported (1, 4). This situation led to the publication of an ESHRE consensus on poor ovarian response (POR) in 2011 (the term POR replaced LOR) (18). Our study began before the publication of this consensus, so we used definition criteria based on previously published experience (19–25). Among the 66 confirmed LR patients randomized in our study, 51 met the ESRHE criteria, presenting a previous POR cycle (≤3 oocytes collected) and an abnormal ovarian reserve test (antral follicle count [AFC] of ≤6 follicles or/and anti-Müllerian hormone [AMH] of ≤0.7 ng/mL); the other 14 patients presented both AFC of ≤6 follicles and AMH of ≤0.7 ng/mL, but the response in the number of oocytes after phase 1 exceeded the ESRHE limit of 3 oocytes (10 patients had 4 oocytes and 4 patients had between 5 and 7 oocytes) and 1 patient was included with a high basal level of FSH and had a POR in phase 1 (≤3 oocytes).
Regarding E2 priming, two recent RCTs showed controversial results. Whereas Reynolds et al (26) did not find any difference in the number of oocytes retrieved, Chang and Wu (27) found that E2 priming increased the number of oocytes collected. We observed that FSH was strongly suppressed at the start of COH in the E group, and this could have contributed to antral follicle synchronization. In the literature, this follicular synchronization was associated with more >16-mm follicles, mature oocytes, and embryos after E2 pretreatment (5). In our study, pretreatment with estradiol strongly suppressed FSH and significantly increased the number of MII oocytes retrieved compared with phase 1 but not with other priming groups. This moderate increase in retrieved mature oocytes (about 1 MII oocyte) did not lead to an increase in the number of embryos.
This result is in line with the results of 2 previous meta-analyses of RCT that failed to confirm any beneficial effect of E2 priming in terms of LBR (26, 27), although one of them found improved CPR (relative risk [RR], 1.33, 95% CI, 1.02–1.72) (26).
Regarding the use of OCP, there is only one RCT assessing its effect before COH in LRs. In that study, the numbers of MII and fertilized oocytes were significantly higher in patients primed with OCPs (13). However, several retrospective studies (28, 29) did not demonstrate any benefit of OCP in terms of oocyte retrieval, embryo quality, and pregnancy rate. The combined treatment with E2 and OCP used in the present RCT was based on a retrospective study including >40 000 patients (6), in which authors noted that follicular priming doubled the number of oocytes retrieved and embryos cleaved in all age groups, except that of a 45 year old woman. In our study we could not replicate such results. The FSH levels on the first day of COH were not reduced in the EOCP group. This can be explained by the fact that patients in the EOCP group started stimulation 5 days after the last pill, according to the protocol used in this study (6).
Regarding the use of androgens, two recent meta-analyses evaluated the effect of androgen supplementation/modulation (30) and testosterone pretreatment (31). Neither of them found more oocytes retrieved. This result is consistent with the lack of differences regarding the number of oocytes retrieved in the T group found in our trial. When the effect of dehydroepiandrosterone (DHEA) or testosterone supplementation was analyzed, increased CPR was reported (RR, 2.86; 95% CI, 1.73–4.73) but the LBR remained similar between the primed and control groups (RR, 1.99; 95% CI, 0.72–5.51) (30). When the use of testosterone alone was analyzed, LBR remained higher in treated patients than in control subjects (RR, 1.91; 95% CI, 1.01–3.63) (31). These findings are also consistent with the increased CPR (RD = 31.8%; 95% CI, 12.4–51.3) and LBR (RD = 22.7%; 95% CI, 5.2–40.2) found in our study for cycles primed with testosterone vs nonprimed cycles. All of the above-mentioned meta-analyses included studies using testosterone, DHEA, and/or letrozole. In our trial, we decided to use testosterone as a direct androgen supplementation because DHEA is not commercially available in our country.
Follicular development is a process involving many molecular signals acting in complex and not completely clarified interactions (32). Different studies reported that LGCs from LRs are characterized by down-regulation of FSHR and steroidogenesis-related genes, by aromatase activity reduction, and by decreased levels of follicular E2 levels (33–35). Androgens and estrogens could play a role in increasing granulosa cell FSHR expression (9, 36), and FSH up-regulates steroidogenesis enzyme expression directly and indirectly through the increase in activin expression (32). In our study, we included direct measurements of FSHR by flow cytometry and qRT-PCR and also its potential effect on gene expression of pivotal enzymes involved in steroidogenesis by qRT-PCR. Ovulation was triggered with the GnRH analog to avoid gene expression changes induced by hCG (37). The different priming strategies did not seem to have any effect on gene expression of FSHR or on membrane expression of FSHR. When we compared the expression levels of genes encoding for key enzymes of steroidogenesis (StAR, CYP11A1, and CYP19A1), we could not find any significant differences between the groups. AR was overexpressed in the group of patients treated with T compared with that for the nonprimed cycle. In previous studies, different groups proved that androgen priming exerts a costimulatory effect on FSH-mediated signals through the AR pathway in small growing follicles from nonhuman (38) and human primates (11). In our study, it is unlikely that growing follicles were influenced by the priming strategy because the time gap between priming and oocyte pick-up in the same follicular cycle is too short to allow a primary follicle to develop into a preovulatory follicle. This suggests that the effect of testosterone priming (and that of the other priming strategies) acts through a different mechanism. In vitro experiments suggest that testosterone could enhance FSHR expression (36) and up-regulation of FSHR could subsequently cause AR overexpression through the production of increased local estradiol in the follicle (32). In vivo, our results support this hypothesis only partially.
In general, the lack of an evident effect of the priming strategies on gene expression of the studied pathways might reflect the fact that the effect of estrogens, androgens, and progestins on their receptors is time dependent, concentration dependent, and receptor isotype dependent (32): taking granulosa cells retrieved at oocyte pick-up only gives us the final picture of the process.
Very few data are available in the literature regarding the intrafollicular concentration of FSH and LH from LR women undergoing unstimulated cycles. De los Santos et al (39) investigated whether the follicular hormonal profile in LRs is hypoandrogenic. They observed higher concentrations of intrafollicular FSH in unstimulated cycles in aged LR patients compared with those in control subjects and young LR patients, but no differences were identified regarding androgen levels (39). They presumed that the increased FSH in aged LRs could be due to a lower number of FSHRs in the granulosa cells, as previously reported by Cai et al (34). In our patients, follicular priming increased intrafollicular E2 levels and decreased those of testosterone and androstenedione in the E and EOCP groups, but this effect was not mediated through an overexpression of FSHR.
In conclusion, the results of this RCT confirmed an improved ovarian response to COH after priming protocols in LRs. Nevertheless, we could not demonstrate a superiority of one of the different strategies over the others in terms of numbers of MII oocytes retrieved. Testosterone priming increases CPR and LBR per initiated cycle compared with those in nonprimed cycles. A trend toward higher CPR and LBR was also seen compared with that in the other different priming strategies. More powerful studies including larger sample sizes are necessary to confirm this trend. Steroid priming had a moderate effect on gene expression patterns of the FSHR, LHR, and AR pathways, suggesting that their effect, if it exists, is probably exerted early in the antral follicle or mediated through mechanisms other than mere changes in gene expression.
Acknowledgments
We thank the embryology team for helping with the isolation of LGCs.
This work was supported in part by the Valencian Health Board (Grant AP-199/10). No financial support was provided by any pharmaceutical company for the present research.
This study was registered at clinical trials.gov under registration number NCT01310647.
Disclosure Summary: The authors have nothing to disclose.
Abbreviations
- AFC
antral follicle count
- AMH
anti-Müllerian hormone
- AR
androgen receptor
- CI
confidence interval
- COH
controlled ovarian hyperstimulation
- CPR
clinical pregnancy rate
- DHEA
dehydroepiandrosterone
- E group
priming with 17β-estradiol
- E2
17β-estradiol
- EOCP
priming with combined estrogen and oral contraceptive pill
- FSHR
FSH receptor
- hCG
human chorionic gonadotropin
- ICSI
intracytoplasmic sperm injection
- IVF
in vitro fertilization
- LBR
live birth rate
- LOR
low ovarian response
- LGC
luteinized granulosa cell
- LHR
LH receptor
- LR
low responder
- MII
metaphase II
- NS
not significant
- OCP
oral contraceptive pill
- POR
poor ovarian response
- qRT-PCR
quantitative RT-PCR
- RCT
randomized controlled trial
- RD
risk difference
- RR
relative risk
- T group
priming with transdermal testosterone.
