


This study aimed to define the potential role of PTHrP on adipogenic regulation and to analyze its relationship with obesity and insulin resistance.
This was a cross-sectional study in which visceral (VAT) and subcutaneous (SAT) adipose tissue were extracted from 19 morbidly obese, 10 obese, and 10 lean subjects. PTHrP mRNA levels were measured in VAT and SAT. VAT mesenchymal stem cells and 3T3-L1 cells were differentiated into adipocytes in presence or absence of PTHrP siRNA. PTHrP mRNA and protein levels as well as adipogenic markers were evaluated by Western blotting or qPCR. Immunohistochemistry and immunofluorescence procedures were used for PTHrP intracellular localization.
Both human VAT and SAT express PTHrP protein mainly in the nucleolar compartment of stromal vascular fraction cells. The highest levels of PTHrP mRNA and protein expression were detected in undifferentiated mesenchymal cells and progressively decreased during adipogenesis. Remarkably, adipogenic differentiation in human mesenchymal stem cells (A-hMSC) was significantly impaired in a pthrp knockdown. PTHrP seems to be related to obesity-associated insulin resistance (IR), given that we found that PTHrP mRNA expression was higher in VAT from morbidly obese with a low IR degree (MO-L-IR) subjects than those from morbidly obese with a high IR degree (MO-H-IR) and lean subjects, and correlated positively with body mass index and hip circumference. We also found that A-hMSC from MO-L-IRs displayed higher adipogenic capacity than those from both MO-H-IRs and leans. In addition, adipogenesis was impaired in VAT from MO-H-IRs, given that mRNA expression levels of key adipogenic regulators were lower than those from MO-L-IR subjects.
PTHrP could be a potential new therapeutic target for the reprograming of adipogenesis and adipose tissue expansion, thus possibly ameliorating the metabolic syndrome in obese subjects.
The prevalence of obesity is increasing and has reached epidemic proportions (1). It is still unclear why obesity is associated with the development of metabolic complications. An incompetent and dysfunctional adipose tissue is being described to be a critical risk factor for the onset of obesity-associated metabolic complications (2–4).
Adult adipose tissue has been recognized as a rich source of mesenchymal stem cells, termed adipose-derived stem cells. Within adipose depots, these cells are responsible for the regeneration of tissue over time by replacing the approximately 10% of mature adipocytes that turn over each year (5). Adipogenesis is the most important process in regulating adipose tissue function and expansion (6). A higher adipogenic capacity is associated with lower insulin resistance (4, 6).
PTHrP has been shown to induce bone formation (7). It interacts at G protein–coupled receptors, which are linked to the adenylyl cyclase/protein kinase A (PKA)–signaling system and the phospholipase C/protein kinase C (PKC) systems (8). PTHrP, whose effects are mainly autocrine and paracrine, is synthesized by diverse tissues including bone and cartilage (9–11), neurons of the cerebral cortex, hippocampus and cerebellum, and smooth muscle as well as endothelial coronary cells and cardiomyocytes (11). PTHrP has been described to play a pivotal role in increasing bone mass through the induction of osteogenic progenitor cell proliferation and differentiation (12, 13), and the inhibition of osteoblastic cell apoptosis (14). Moreover, it has been described that PTHrP is able to inhibit the terminal differentiation of committed preadipocytes by stimulating Mitogen-activated protein kinases (MAPK) in vitro, which, in turn, can phosphorylate and down-regulate the adipogenic-determining factor peroxisome proliferator–activated receptor (PPARγ) (15).
Also, it has been described that PTHrP plays a role in the pathophysiology of type 2 diabetes through the regulation of β-cell survival (16).
The main role of PTHrP on the differentiation programming of stem cells into different cellular linages have been extensively investigated; however it remains undefined in its role in the regulation of adipogenic differentiation of human adipose tissue–derived stem cells (A-hMSCs), and its potential relationship with obesity and insulin resistance (IR) is still unstudied. Here, we aim to analyze, for the first time, the potential function of PTHrP on monitoring A-hMSCs committed differentiation, and to understand the association between this function, obesity, and associated IR.
Our study shows that both human visceral (VAT) and subcutaneous (SAT) adipose tissue express PTHrP protein mostly in their stromal vascular fraction (SVF) and, in particular, in the nucleolus compartment. Moreover, the highest levels of PTHrP were mostly detected in undifferentiated mesenchymal cells, and progressively decreased during adipogenesis. Interestingly, PTHrP knockdown (KD) in A-hMSC significantly reduced their adipogenic differentiation. Moreover, PTHrP mRNA expression levels were higher in VAT from morbidly obese subjects with a low IR degree (MO-L-IR) compared with morbidly obese subjects with a high IR degree (MO-H-IR) and lean subjects, and correlated positively with body mass index (BMI) and hip circumference. Also, A-hMSC from MO-L-IRs displayed higher adipogenic capacity in comparison with cells from both leans and MO-H-IRs, suggesting that PTHrP seems to be related to obesity-associated IR.
Materials and Methods
Patients and adipose tissue collection
This was a cross-sectional study comprising 39 subjects, 19 morbidly obese patients (BMI 57 ± 5.2 kg/m2) (10 male and 9 female); 12 MO-L-IR (homeostasis model assessment of insulin resistance index (HOMA-IR < 4) and 7 MO-H-IR (HOMA-IR > 7.5). Also, 10 nonobese lean subjects (BMI 22 ± 1.9 kg/m2) (five male and five female) and 10 obese subjects with a low degree of insulin resistance (32 ± 2.4 kg/m2) (5 male and 5 female) were evaluated. Exclusion criteria were type 2 diabetes mellitus, cardiovascular disease, arthritis, acute inflammatory disease, and infectious disease. Patients receiving treatment with drugs that could alter their lipid profile or metabolic parameters at the time of inclusion in the study were also excluded. VAT and SAT adipose tissue was extracted from nonmorbidly obese patients who underwent laparoscopic surgery for hiatus hernia or suffering from cholelithiasis, and from morbidly obese subjects who underwent bariatric surgery. All subjects were of Caucasian descent and reported that their body weight had been stable for at least 3 months prior to the study. All participants gave their written informed consent and the study was reviewed and approved by the Ethics and Research Committee of the Vírgen de la Victoria Clinical University Hospital, Málaga, Spain. Biopsy samples from VAT and SAT were washed in physiological saline and immediately frozen in liquid nitrogen. Biopsy samples were maintained at −80°C until analysis.
For adipogenesis and osteogenesis differentiation studies, A-hMSCs were derived from both fresh VAT and SAT from lean (BMI, 20–25 kg/m2; n = 11), MO-L-IR (BMI > 40 kg/m2; HOMA-IR < 4; n = 9) and MO-H-IR subjects (BMI > 40 kg/m2; HOMA-IR > 7.5; n = 9). Biopsy samples were washed in physiological saline and used immediately for in vitro analysis.
Isolation and expansion of adipose tissue stromal vascular fraction–derived cell from human VAT and SAT
Isolation and expansion of human SVF-derived cell from adipose tissue was carried out using a procedure modified from Zuk et al (17). Briefly, isolated adipose tissue samples were transported in Hank's balanced salt solution supplemented with 3% of penicillin and streptomycin. Adipose tissue biopsies were washed with PBS to remove residual blood cells and dissected into small pieces with enzymatic digestion in a solution of 0.150% collagenase type I and 1.0% BSA for 70 minutes at 37°C on a shaking water bath. Tissue suspension obtained from enzymatic digestion was centrifuged at 400 × g for 5 minutes and floating adipocytes were separated from precipitated stromal vascular fraction by decanting, which was filtered through a 100-μm mesh and centrifuged at 300 × g for 5 minutes. The cell pellet was resuspended in erythrocyte lysis buffer for 10 minutes at room temperature and, after further centrifuging at 300 × g for 5 minutes, resuspended in DMEM/F12 supplemented with 10% fetal bovine serum, 100 μg/mL streptomycin, 100 U/mL penicillin, 2mM L-glutamine, and 1 μg/mL of amphotericin B. Cells were plated in tissue culture flasks and incubated at 37°C in a humid atmosphere with 5% of CO2 for approximately 7 days until 90% confluence was reached. The culture medium was changed after the first 12 hours to reduce potential transversal contamination with endothelial cells and macrophages, whose presence was detected by the immunophenotypic characterization at passage zero using surface-specific markers of endothelial cells, macrophages, and mesenchymal stem cells. The percentage of each fraction was as follows: 3.5 ± 1.8% (CD34−/CD45+), 90.00 ± 4.06% [CD73], 89.14 ± 3.80% [CD90], 90.88 ± 3.76% [CD105], and 68.64 ± 12.13% [CD44] for VAT and 2.97 ± 1.10% (CD34−/CD45+), 92.62 ± 0.91% [CD73], 91.3 ± 2.4% [CD90], 96.62 ± 0.44% [CD105], and 64.26 ± 7.16% [CD44]. All experiments were processed at early passage P1-P3. Representative histogram of positive cells for each of the analyzed markers in A-hMSCs from VAT and SAT is shown in Supplemental Figure 1.
Human adipocyte differentiation and incubation with PTHrP-specific RNA silencer
The effects of PTHrP silencing on mRNA adipogenic marker expression levels were analyzed on VAT A-hMSC from obese (BMI = 32 ± 2.4 kg/m2) (n = 6) and from morbidly obese subjects (BMI = 57 ± 5.2 kg/m2) (n = 8), both with low degrees of insulin resistance. VAT A-hMSC was extracted and cultured in dishes that were maintained in expansion medium until approximately 90% confluence was reached. The expansion medium was replaced by adipogenic medium (expansion medium supplemented with 0.5mM isobutylmethylxanthine, 1.0μM dexamethasone, 10μM insulin, and 200μM indomethacin) with the absence or presence of 25nM of specific PTHrP siRNA (PTHrP Silencer Select Predesigned siRNA, Ambion) 5′-GGCGACGAUUCUUCCUUCAtt-3′ (Sense), 5′-UGAAGGAAGAAUCGUCGCCgt-3′ (antisense), and on the sixth day of adipogenic differentiation, mRNA and protein were extracted. Transfection with RNA silencer (siRNA) was carried out using Dharma FECT Transfection Reagent (adding the proportion of 0.2 μL for 5000 cells/well). To test the specificity and efficacy of the silencing, both siRNA-negative control (nontargeting) and Dharma FECT Transfection Reagent effects on differentiation were assessed to discard unspecific effects of both reagents. Dose effect of PTHrP siRNA study was carried out by transfecting A-hMSCs with different doses of siRNA (5, 25, 50, and 100nM). PTHrP mRNA was analyzed and presented in Supplemental Figure 2A, indicating the high efficiency of silencing at 25nM of siRNA.
3T3-L1 cell culture and adipocyte differentiation
Murine 3T3-L1 fibroblasts (CCL 92.1, American Type Culture Collection) were grown to confluence in DMEM containing 10% calf serum. The differentiation to adipocytes was induced according to the procedure described previously (18). On days 0, 3, 5, 7, 9, 12, and 14, three replicated cell samples were collected separately to be assayed later.
Oil Red O Staining
The staining was carried out as previously described (19). 3T3-L1 cells were fixed with 10% formalin for at least 1 hour. Prior to staining, cells were washed with 60% isopropanol and left to dry. Dried cells were stained with 0.35% Oil Red O (O-0625, Sigma-Aldrich) in isopropanol solution for 20 minutes in the dark and washed four times with dH2O. The stained cytosolic triglycerides were visualized and images captured by phase contrast microscopy. To quantify the cellular triglycerides, the stained cells were eluted with 100% isopropanol and the OD values were detected at a wavelength of 500 nm.
Cell protein extraction
Cells were removed from culture medium, washed with PBS, and then incubated with 500 μL of trypsin for 5 minutes at 37°C and collected by centrifugation for 5 minutes at 25°C. Protein extraction from these cells was carried out using a NE-PER kit (Pierce). Briefly, 100 μL of Cytoplasmic Extraction Reagent I (CER I) and 2 μL phosphatase inhibitor cocktail II and cocktail III (SIGMA) were added to the cell pellet and then homogenized and incubated for 10 minutes at 4°C. Eleven μL of Cytoplasmic Extraction Reagent II (CER II) was added to the homogenate and the cytoplasmic fraction was separated from the nucleus by centrifugation for 10 minutes at 4°C. Protein preparations were stored at −80°C until use.
RNA extraction
Differentiated cells and frozen VAT and SAT were homogenized with an Ultra-Turrax 8 (Ika). Total RNA was extracted by RNeasy lipid tissue mini kit (QIAGEN), and total RNA was treated with 55U RNase-free deoxyribonuclease (DNase; QIAGEN) following the manufacturer's instructions. From cell cultures: Total RNA was isolated from cell cultures using the RNA-Stat 60 Reagent (Ams Biotechnology).
The RNA concentrations were determined by absorbance at 260 nm (A260), and purity was estimated by A260:A280 ratio determination.
qRT-PCR
Total RNA was reverse transcribed to cDNA by using a high-capacity cDNA reverse transcription kit with an RNase inhibitor (Applied Biosystems). The cDNA was used for qRT-PCR with duplicates. The cycle threshold (Ct) value for each sample was normalized with the expression of cyclophilin A (4326316E, RefSeq. NM_021130.3) for adipocytes and β-actin for osteocytes (401846; Life Technology). The amplifications were performed using a MicroAmpOptical 96-well reaction plate (Applied Biosystems) on an ABI 7500 Fast RT-PCR System (Applied Biosystems). qRT-PCR reactions were carried out for all genes using specific TaqMan Gene Expression Assays (Applied Biosystems). During PCR, the Ct values for each amplified product were determined using a threshold value of 0.1. SDS software v. 2.3 and RQ Manager 1.2 (Applied Biosystems) were used to analyze the results with the comparative Ct method (2−ΔCt).
Laboratory measurements
Blood samples from all subjects were collected after a 12-hour fast. The serum was separated and immediately frozen at −80°C. Serum biochemical parameters were measured in duplicate. Serum glucose, cholesterol, high-density lipoprotein cholesterol, and triglycerides (Randox Laboratories Ltd.) were measured by standard enzymatic methods. Adiponectin levels were measured by ELISA kits (DRG Diagnostics). PTHrP levels were measured by ELISA kits (PTHrP [1–34], Phoenix Pharmaceuticals, Inc.). Insulin was analyzed by RIA (BioSource International). The HOMA-IR index was calculated from fasting insulin and glucose with the following equation: HOMA-IR = fasting insulin (μIU/mL) × fasting glucose (mol/L)/22.5.
Immunoblotting
Protein extracts from human fat biopsies, isolated adipocytes, SVF, and 3T3-L1 (5–15 μg) were resolved on SDS-PAGE and transferred onto Hybond enhanced chemiluminescence (ECL) nitrocellulose membranes by conventional procedures. Immunoblotting was performed with 1:2500 rabbit anti-PTHrP (AV33885; Sigma-Aldrich), 1:16000 mouse anti-GAPDH (AM4300; Ambion), 1:10000 rabbit antihistone H3 (ab1791; ABCAM) and anti-β-Actin (A2228; Sigma-Aldrich) antibodies. Subsequently, membranes were incubated with the appropriate IgG-linked to horseradish peroxidase enzyme (HRP)-conjugated secondary antibody. Immunoreactive bands were visualized with enhanced chemiluminescence (ECL)-plus reagent kit (GE Healthcare). ODs of the immunoreactive bands were measured using Image J analysis software.
Immunohistochemistry
Five-micron sections of formalin-fixed, paraffin-embedded adipose tissue were deparaffinized and rehydrated prior to antigen unmasking. Sections were blocked in normal serum and incubated overnight with rabbit anti-PTHrP (1:500 dilutions). Secondary antibody staining was performed using the VECTASTAIN ABC kit (Vector Laboratories, Inc.) and detected with diaminobenzidine (Vector Laboratories, Inc.). Sections were counterstained with hematoxylin prior to dehydration and coverslip placement, and examined under a Nikon Eclipse 90i microscope. As a negative control, the procedure was performed in the absence of the primary antibody.
Immunofluorescence
3T3-L1-cultured cells were fixed with 4% paraformaldehyde and permeabilized for 30 minutes with 0.1% Triton X-100 in PBS. Staining was performed with rabbit anti-PTHrP antibody (1:400 dilution) and with mouse anti-fibrillarin antibody (ab4566; Abcam plc.,) at 4°C overnight, and were visualized using Alexa Fluor 546 goat antirabbit or Alexa Fluor 488 goat antimouse antibodies (1:1000; Molecular Probes Inc.), respectively. The slides were counterstained with DAPI (4,6-diamidino-2-phenylindole) to reveal nuclei. The lipophilic fluorescence dye BODIPY 493/503 was used for lipid droplet labeling according to the manufacturer's instructions (Molecular Probes Inc.). The slides were examined under a Leica TCS SP5 fluorescent microscope. As a negative control, the assay was performed in the absence of primary antibodies.
Cell viability assay
The viability of siRNA-treated h-adipose-derived stem cells was determined using the CytoTox-ONE Homogeneous Membrane Integrity Assay (Promega). This assay measures the release of lactate dehydrogenase (LDH) as an indicator of cytotoxicity. siRNA transfection was performed as stated above. After transfection, 50 μL of media was removed from each well. Control cells were treated with 1 μL of lysis solution and media collected; this represented the maximum LDH release values. Samples were incubated with 50 μL CytoTox-ONE Reagent at room temperature for 10 minutes; the reaction was stopped by the addition of 25 μL stop solution. The fluorescence of samples was measured at excitation: 560 nm and emission: 590 nm. Cytotoxicity was calculated by subtracting the average fluorescence values of the culture medium background from all fluorescence values of the experimental wells. The average fluorescence values from treated cells were used to calculate the percent of cytotoxicity for a given experimental treatment. Percent cytotoxicity = 100 × (experimental-culture medium background)/(maximum LDH release − culture medium background). The cytotoxicity levels were measured in triplicate and for all subject types.
Statistical analysis
Statistical analysis was carried out with SPSS (Version 15.0 for Windows; SPSS, Inc.). As most of the parameters analyzed lacked a normal distribution, we used nonparametric tests. Differences between two related variables were analyzed by the use of the Wilcoxon test. Differences between more than two groups were compared by using the Kruskal-Wallis test. Spearman correlation coefficients were calculated to estimate the correlations between variables. Multiple linear regressions were used to determine the association between variables. Values were considered to be statistically significant when P ≤ .05. The results are given as the mean ± SE. Statistical comparisons of the densitometry data were carried out using Student's t test and results were expressed as mean ± SE using SPSS (Version 15.0 for Windows; SPSS, Inc.). Statistical significance was set at P < .05.
Results
PTHrP protein expression in human adipose tissue
Immunohistochemical analyses highlighted that PTHrP is mostly detected in the SVF from both human VAT and SAT. Moreover, protein is shown almost exclusively in the nucleus of human SVF cells as shown in the close up (Figure 1). Western Blot analysis confirmed the presence of PTHrP mostly in human SVF fraction from VAT and especially in nucleus subcellular fraction (Figure 2, A and B). In 3T3-L1, co-staining assays using fluorescent antibodies against PTHrP and fibrillarin, a protein expressed in the nucleolus (20), revealed that in both undifferentiated and differentiated 3T3-L1, PTHrP was located in the nucleolus (Figure 2C).
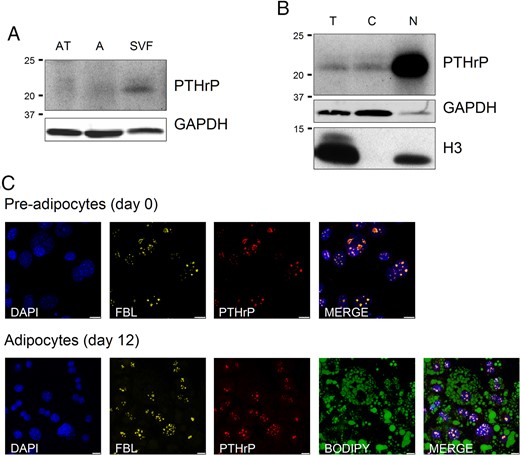
Representative Western Blot analysis of PTHrP protein expression in human VAT fractions, and immunofluorescence colocalization of PTHrP and fibrilarin proteins.
(A) PTHrP protein expression in total human VAT, adipocyte fraction, and SVF from lean subjects. PTHrP is mainly expressed in SVF. (B) PTHrP protein expression levels in total cellular fraction as well as in cytoplasmic and nuclear fractions (SVF) of VAT from lean subjects. The protein is mostly located in the nucleus of the SVF cells. GAPDH was used as cytoplasmic marker and Histone H3 was used as nuclear marker. The blot is representative of the results obtained from the analysis of VAT from obese and morbidly obese subjects with high and low degrees of IR and which showed similar results. AT, Total adipose tissue; A, isolated adipocytes fraction; T, total extract; C, cytoplasm fraction of SVF; N, nuclear fraction of SVF. C, Immunofluorescence colocalization of PTHrP (red) and fibrilarin (yellow) proteins in the nucleolus of 3T3–L1 preadipocytes (day 0) and in differentiated 3T3–L1 adipocytes (day 12). Nuclei have been stained with DAPI (blue). Lipid droplets have been stained with BODIPY 493/503 (green). Images are representative of five replicates. Scale bars correspond to 7.5 μm (for preadipocytes) and 10 μm (for adipocytes). FBL, fibrilarin.
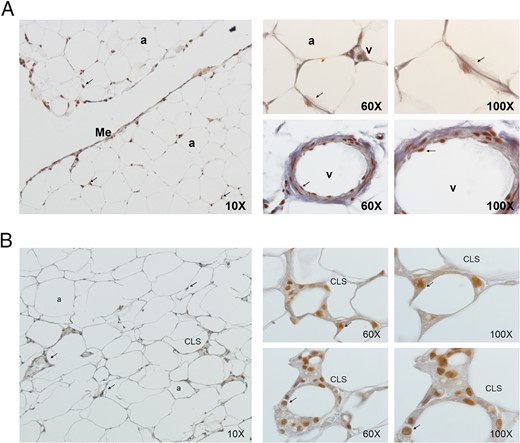
Immunohistochemical detection of PTHrP (in brown) in VAT (A) and in SAT (B) from MO-L-IR subjects (BMI = 45 kg/m2).
PTHrP was mainly expressed in the nucleus of SVF cells as shown in 60× and 100× images. These images are representative of several adipose tissue sections collected from five subjects, of both sexes, with different BMI (lean, obese, and morbidly obese), and with high and low degrees of IR and which showed similar results as those presented in the image. Arrow indicates nucleus staining. a, adipocyte; me, mesothelium; CLS, crown-like structure; v, vessel.
PTHrP mRNA expression levels in VAT and SAT from subjects with different BMI and different degrees of insulin resistance
Supplemental Table 1 summarizes the characteristics of the patients studied, including metabolically healthy MO-L-IR and MO-H-IR patients.
Figure 3 shows that VAT PTHrP mRNA expression was significantly higher among morbidly obese subjects (BMI > 40 kg/m2) compared with lean and obese subjects with a low degree of insulin resistance. These differences were not found in SAT (Figure 3A). VAT PTHrP mRNA expression levels were lower in MO-H-IR compared with MO-L-IR. No significant differences were observed in SAT (Figure 3B).
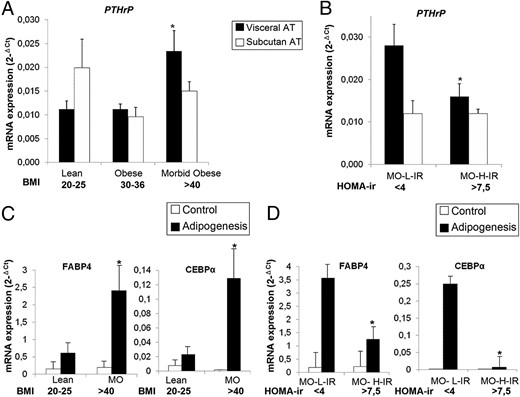
PTHrP mRNA expression levels in whole human VAT and SAT adipose tissue and adipogenic capacity of visceral and subcutaneous A-hMSC from subjects with different BMI and degree of IR.
A and B, PTHrP mRNA expression analysis was performed on human SAT and VAT from lean (BMI = 20–25 kg/m2; n = 10), obese (BMI = 30–36 kg/m2; n = 10) and morbidly obese (MO) subjects (BMI > 40 kg/m2) with low (HOMA-IR < 4; n = 12) and high (HOMA-IR > 7.5; n = 7) degree of IR. *, P < .05 (A) for comparison of MO subjects with both lean and obese subjects and (B) for comparison of MO-H-IR with MO-L-IR. C and D, A-hMSCs were isolated from VAT from leans (BMI = 20–25 kg/m2; n = 11), metabolically healthy MO-L-IRs (BMI > 40; HOMA-IR < 4; n = 9) and MO-H-IRs (BMI > 40 kg/m2; HOMA-IR > 7.5; n = 9), and then differentiated into adipocytes. Adipogenesis was evaluated by measuring FABP4 and CEBPα mRNA expression levels. *, P < .05 (C) for comparison of MO with lean subjects and (D) for comparison of MO-H-IR with MO-L-IR. mRNA levels of test genes were normalized to cyclophilin mRNA levels. Each sample from each subject was analyzed separately and in triplicate. Data represent the mean ± SE of the values obtained from all samples.
VAT PTH-rP gene expression levels correlated positively with BMI and hip circumference (Rs = 0.340; P = .049 and Rs = 0.446; P = .009, respectively). No significant correlations were observed with other anthropometric and biochemical variables (data not shown).
PTHrP mRNA expression levels in adipocytes and osteocytes differentiated from adipose tissue human mesenchymal stem cells
To analyze whether the capacity of A-hMSCs in differentiating into adipocytes was affected or not by obesity and insulin resistance, A-hMSC from VAT from leans, and from MO-H-IR and MO-L-IR were allowed to differentiate into adipocytes. FABP4 and CEBPα expression levels in differentiated adipocytes showed that adipogenesis levels were significantly increased in cells from morbidly obese compared with lean subjects. FABP4 and CEBPα expression levels were lower in MO-H-IR compared with MO-L-IR (Figure 3, C and D).
PTHrP expression levels were decreased during adipogenesis and osteogenesis processes
Figure 4A shows that PTHrP mRNA expression levels decreased significantly in human differentiated adipocytes and osteocytes compared with undifferentiated mesenchymal cells. PPARγ2 and ALP confirmed the differentiation to these different lineages (Figure 4, B and C).
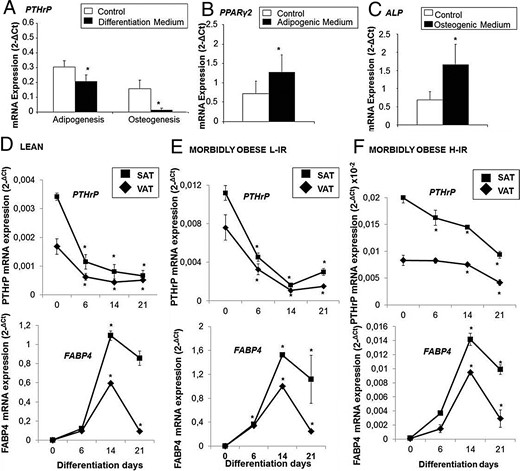
mRNA expression levels during VAT human MSC (A-hMSC) differentiation into adipocytes and osteocytes.
(A–C) A-hMSC (n = 6) were differentiated into adipocytes for 21 days (A, B) and to osteocytes for 21 days (A, C), and PTHrP, PPARγ2, and alkaline phosphatase (ALP) mRNA expression levels were measured. *, P < .05 compared with control. (D–F) Time course of PTHrP and FABP4 mRNA expression levels during adipogenesis. A-hMSC from VAT and SAT from leans (n = 10), metabolically healthy MO-L-IRs (n = 9) and MO-H-IR (n = 8) were let to differentiate into adipocytes for 21 days, and PTHrP and FABP4 mRNA expression levels were measured at 0, 6, 14, and 21 days of differentiation. *, P < .05 comparing values obtained at 6, 14, and 21 days of differentiation to values obtained at day 0. mRNA levels of test genes were normalized to cyclophilin mRNA levels for adipocytes and to Actin-β for osteocytes. Results were obtained in triplicate for each patient and expressed as the mean ± SE.
Human mesenchymal stem cells from VAT and SAT of subjects with different BMI and degrees of insulin resistance were allowed to differentiate into adipocytes and the time course of PTHrP mRNA expression levels was analyzed at 0, 6, 14, and 21 days of differentiation, as shown in Figure 4, D–F. PTHrP mRNA expression levels were significantly decreased during adipogenesis in both VAT and SAT, albeit the rate of this decrease was lower in MO-H-IR compared with leans and MO-L-IRs. PTHrP mRNA expression levels were also analyzed at early hours of differentiation (0, 4, 8, 12, 24, 48, and 72 h). Supplemental Figure 3 shows that PTHrP mRNA expression levels were higher during the first 12 hours without showing any relevant changes. After 12 hours of differentiation PTHrP mRNA decline progressively. In parallel, FABP4 mRNA expression levels showed a significant increase during adipogenesis, notwithstanding in MO-H-IR, this increase was lower compared with leans and MO-L-IR.
Moreover, 3T3-L1 adipogenesis analysis showed that PTHrP protein levels also decreased significantly during 3T3-L1 differentiation. The amount of this protein on the 14th day of differentiation was 4-fold lower compared with baseline levels. FABP4 increased concordantly during this period of differentiation, in parallel with the number of lipid droplets (Figure 5A).
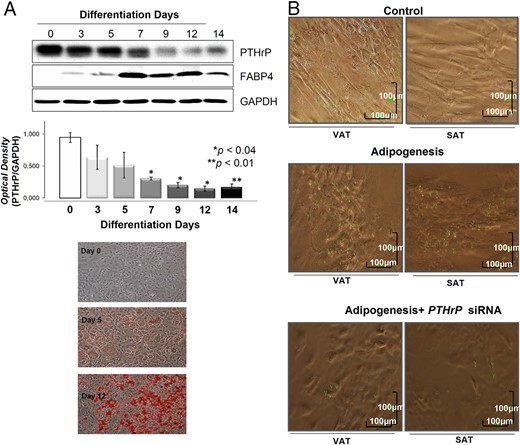
PTHrP protein expression levels during 3T3–L1 differentiation into adipocytes and effects of PTHrP mRNA silencing on A-hMSC cell differentiation into adipocytes.
(A) PTHrP protein levels assessed by Western Blot during adipogenic maturation of 3T3–L1 (n = 6). Values for relative intensity obtained after densitometry of the bands are means ± SE. *, P < .05 for comparison between PTHrP levels at days 7, 9, and 12 vs day 0 and **, P < .01 for comparison between day 14 and day 0. FABP4 was used as an adipogenesis control. The results were normalized by GAPDH density. A representative Western Blot of three independent analyses is shown. Oil Red Staining images are representative from a 3T3–L1 adipogenic differentiation experiment. (B) Effects of PTHrP mRNA silencing on visceral and subcutaneous A-hMSC from obese subjects (BMI = 32 ± 2.4 kg/m2) (n = 6) were differentiated into adipocytes in the presence and absence of specific PTHrP mRNA silencer (25nM) for 6 days. Samples from each subject were analyzed separately. Five replicates were carried out for each sample. Images are representative of the results obtained from all samples. Green arrows show lipid droplets. Scale bars correspond to 100 μm. Control represents A-hMSC cultured without adipogenic medium.
PTHrP silencing reduced adipogenesis differentiation
Given that the highest levels of PTHrP mRNA and protein were mostly detected in undifferentiated A-hMSC and were progressively decreased during adipogenesis (Figure 4), we investigated the involvement of PTHrP in adipogenesis regulation by knocking down PTHrP. Rather than overexpression, knocking down PTHrP could provide a better understanding of the potential involvement of this protein in the regulation of adipogenesis. Consequently, A-hMSC from VAT and SAT were differentiated into adipocytes in the presence or absence of the specific PTHrP mRNA silencer. Figure 6B shows that adipogenic differentiation of both VAT and SAT A-hMSC was significantly decreased after PTHrP knockdown (KD) in parallel with a clear reduction in the number of lipid droplets. Nontargeting negative Control siRNA and Dharma FECT Transfection Reagent did not affect adipogenic differentiation (data not shown).
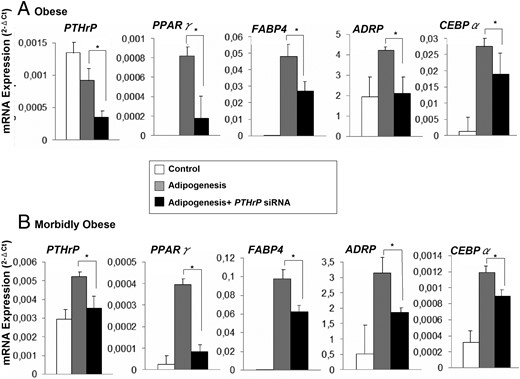
Effects of PTHrP silencing on mRNA expression levels of adipogenic markers after differentiation of human VAT A-hMSC, from obese and MO subjects into adipocytes.
VAT A-hMSC from obese (BMI = 32 ± 2.4 kg/m2) (n = 6) and MO subjects (BMI = 57 ± 5.2 kg/m2) (n = 8), both with low degrees of IR, were differentiated into adipocytes in the presence or absence of PTHrP mRNA silencer (25nM). At the sixth day of differentiation, PPARγ, FABP4, ADRP, and CEBPα mRNA expression levels were measured. mRNA levels of test genes were normalized to cyclophilin mRNA levels. Effects of both siRNA negative control and Dharma FECT Transfection Reagent on differentiation were assessed (Supplemental Figure 4). Samples from each subject were analyzed separately and in triplicate and the results obtained from all subjects were expressed as the mean ± SE. (A): Obese and (B): Morbidly Obese. *, P < .05 comparing adipogenesis in presence of siRNA vs. adipogenesis in absence of siRNA.
Effect of PTHrP siRNA on A-hMSCs' differentiation into adipocytes
A-hMSCs from VAT of obese and MO subjects were allowed to differentiate into adipocytes in the presence or absence of specific PTHrP mRNA silencer. PPARγ2, FABP4, ADRP, and CEBPα mRNA expression levels indicated that in both groups adipogenesis decreased significantly after PTHrP KD (Figure 6, A and B). Nontargeting negative Control siRNA and Dharma FECT Transfection reagent resulted in no discernible reduction of PTHrP mRNA, and did not affect adipogenic differentiation (Supplemental Figure 4). CytoTox-ONE Homogeneous Membrane Integrity Assay shows that all cell treatments (adipogenesis, nontargeting, PTHrP-siRNA and FECT-Transfect) showed approximately 20–25% cytotoxicity, whereas the positive lysis control cells showed approximately 89% cytotoxicity (Supplemental Figure 2B).
Discussion
It is well known that adipogenesis is the most important process in the regulation of adipose tissue function and expansion (6), and seems to be related to obesity and the onset of insulin resistance (4). For this reason, it is important to understand the mechanisms underlying the regulation of this process.
In the present work, we show for the first time that both human VAT and SAT express PTHrP protein mainly in the SVF and localized at the nucleolar compartment. The highest levels of PTHrP mRNA and protein expression were detected in undifferentiated mesenchymal cells and this progressively decreased during adipogenesis. Remarkably, adipogenic differentiation in A-hMSC was significantly impaired in a pthrp KD. Taken together, these data suggest that PTHrP may be linked to adipogenesis within adipose tissue and its expansibility.
In stem cells, PTHrP expression is associated with at least two signal transduction pathways, the adenylyl cyclase/protein kinase A (PKA) and the phospholipase C/protein kinase C (PKC) (21–25). These two pathways are crucial for adipogenesis regulation (22, 25, 26). It has been described that PTHrP interacts with members of the CCAAT/enhancer-binding protein (C/EBP) family to regulate the activation of lineage-specific promoters during MSCs differentiation (27–29). Another study has shown that PTHrP up-regulates the mRNA expression of a variety of transcription factors that are immediate-response genes, mainly C/EBP family (30), which are well known to regulate the early phase of adipogenesis (31). During the initial hours of adipocyte differentiation, PTHrP mediates C/EBP activation through the activation of the PKC/MEK/ERK pathway (24, 25). In addition, it has been described that PTHrP is involved in PPARγ activation, which is the master transcriptional regulator of adipogenesis and known to be immediately activated by C/EBPα (32). Another study has shown that in 3T3-L1 cells, PTHrP mediates MAPK activation through the PKA pathway, thus also enhancing PPARγ activation (23). Moreover, our data and that of others have demonstrated that PTHrP expression was higher in undifferentiated stem cells and decreases until nondetectable levels in terminally differentiated cells (33). Consequently, it might be expected that the silencing of PTHrP could negatively regulate PPARγ activation and the expression of adipogenic genes, which may inhibit the final differentiation of preadipocytes into adipocytes. Another potential pathway that may be involved in PTHrP-mediated adipogenesis could be the Wnt/β-catenin pathway, which seems to down-regulate PPARγ. In line with this suggestion, it has been described that Wnt signaling retains preadipocytes in an undifferentiated state through the inhibition of C/EBPα and PPARγ (34). In addition, Wnt signaling is one of the downstream pathways activated by PTHrP in mammary MSCs and is induced by PTHrP overexpression (35–37). These data could explain why PTHrP overexpression during the adipogenic process inhibits 3T3-L1 differentiation into mature adipocytes (16, 23).
These data are not contradictories, but highlight the complexity of the role of PTHrP in the regulation of stem cells differentiation. Therefore, in case MSCs are programmed to differentiate into the adipogenic lineage, PTHrP may act as the adipocyte differentiation “on switch” by activating C/EBPs. In the cases that MSCs are programmed to differentiate into other cell lineages such as osteoclasts or chondrocytes, it is reasonable to think that PTHrP expression levels should be maintained high throughout the differentiation process to inhibit the key regulatory factors of adipocytes terminal differentiation.
PTHrP seems to be related to obesity-associated IR, given that we found that PTHrP mRNA expression was higher in VAT from MO-L-IR than from MO-H-IR and leans, and was positively correlated with BMI and hip circumference. We also found that A-hMSC from MO-L-IR showed higher adipogenic capacity than from both MO-H-IR and leans. In addition, adipogenesis was impaired in VAT from MO-H-IR, given that the mRNA expression levels of key adipogenic regulators were lower than those from MO-L-IR. It has been described that increased visceral adiposity is a risk factor for metabolic disorders such as dyslipidemia, hypertension, IR, and type 2 diabetes, whereas sc obesity is not (38). There is increasing evidence showing that subjects with a higher capacity of adipose tissue expansion remain metabolically healthy and seem to be more resistant to the metabolic effects of obesity, such as IR, high-density lipoprotein cholesterol, hypertriglyceridemia, and hypertension (4). These data suggest that in VAT from metabolically healthy morbidly obese individuals, the increased levels of PTHrP could have an important role in the positive regulation of the VAT expansion capacity by promoting the adipogenesis process. There are two points supporting this hypothesis: 1) FABP4 is a key mediator of intracellular transport and metabolism of fatty acids in adipose tissues (31); and 2) PPARγ is a ligand-dependent transcription factor that regulates genes involved in lipid and glucose homeostasis, including FABP4 (31). Importantly, suppression of PPARγ by FABP4 in VAT could explain the role of FABP4 in the development of obesity-related morbidities, including IR and type 2 diabetes.
Altogether, our results seem to suggest the potential parallelism between PTHrP levels and the stemness regulatory network of adipose multipotent stem cells. In line with our proposition, in previous studies our group demonstrated that obesity causes a general short circuit in the stemness controlling system of adipose multipotent stem cells, and that morbid obesity has impaired the capacity of these cells to expand (39).
PTHrP may exert its adipogenic regulatory function in the nucleolar compartment given that it is located to this fraction in SVF cells, as previously described in other cell types (40, 41). To the best of our knowledge, this is the first time that PTHrP has been found to localize in the nucleolar compartment in adipose tissue cells. We are currently investigating its role in the nucleolus, although most studies suggest that PTHrP could act through interaction with mRNA in the nucleolus (42).
In conclusion, our data shows that PTHrP could be a potential new therapeutic target for the reprograming of adipogenesis and adipose tissue expansion, thus possibly ameliorating the metabolic syndrome in obese subjects.
Acknowledgments
The authors thank all the subjects for their collaboration. The Centro de Investigación Biomédica en Red (CIBER) de Diabetes y Enfermedades Metabólicas Asociadas and CIBER Fisiopatología de la Obesidad y Nutrición are part of a Instituto de Salud del Carlos III Project, and thanks to D.W.E. Ramsden (Málaga, Spain) and A. Vega-Rioja for help with the English-language version of the text.
This work was supported in part by grants from the Instituto de Salud Carlos III [PI12/02355, PI10/01947, PI13/02628, CP04/00133, PI10/01947, PS09/01060, PS09/00997], Servicio Andaluz de Salud [PI0255/2007]. CTS-7895 and CTS 08181 from the Consejería de Economía e Innovación, Ciencia y Empleo, Junta de Andalucia, by grant SAF-2012-33014 (to B.P.) from the Ministerio de Economia y Competitividad, Spain. L. Garrido-Sánchez is supported by fellowships from the ISCIII “Miguel Servet I” [CP13/00188]. M.M Roca-Rodríguez is supported by a fellowship from the Programa Rio Hortega (CM11/00030). R. El Bekay is supported by fellowships from the ISCIII “Miguel Servet II” [CPII13/00041]. L Garrido-Sánchez acknowledges support from the “Miguel Servet” program (CP13/00188) from the Fondo de Investigación Sanitaria (FIS). M. Gómez-Serrano is supported by a fellowship from Ayuda a la Formación de Personal Investigador de la Universidad Autónoma de Madrid (FPI-UAM) Program.
Author contributions: R.E., B.P., and F.J.T., designed the research; M.M.R.R., R.E., M.G.S., S.L., L.C.A., W.O.O., M.C.P., E.G.S., R.D.L.D., and E.M.Y.S. performed the research; J.M.F.R. contributed to discussion; R.E., F.J.T., and B.P. analyzed the data and wrote the paper.
Disclosure Summary: The authors have nothing to disclose. F.J.T., R.E. and B.P. are the guarantors of this work and, as such, had full access to all the data in the study and take responsibility for the integrity of the data and the accuracy of the data analysis.
M.M.R.R. and R.E. contributed equally to the study.
R.E.B, B.P., and F.J.T. are corresponding authors.
Abbreviations
- A-hMSC
Adipose tissue-derived human mensenchymal stem cells
- BMI
body mass index
- Ct
cycle threshold
- hMSC
human mesenchymal stem cells
- HOMA-IR
homeostasis model assessment of insulin resistance index
- IR
insulin resistance
- KD
knockdown
- MO-L-IR
morbidly obese with a low degree of insulin resistance
- MO-H-RI
morbidly obese with a high degree of insulin resistance
- MSC
mesenchymal stem cell
- SAT
subcutaneous adipose tissue
- siRNA
RNA silencer
- SVF
stromal vascular fraction
- VAT
visceral adipose tissue.
