


The interindividual variability in thyroid hormone function parameters is much larger than the intraindividual variability, suggesting an individual set point for these parameters. There is evidence to suggest that environmental factors are more important than genetic factors in the determination of this individual set point.
This study aimed to quantify the effect of genetic factors and (fetal) environment on the early postnatal blood T4 concentration.
This was a classical twin study comparing the resemblance of neonatal screening blood T4 concentrations in 1264 mono- and 2566 dizygotic twin pairs retrieved from the population-based Netherlands Twin Register. Maximum-likelihood estimates of variance explained by genetic and environmental influences were obtained by structural equation modeling in data from full-term and preterm twin pairs.
In full-term infants, genetic factors explained 40%/31% of the variance in standardized T4 scores in boys/girls, and shared environment, 27%/22%. The remaining variance of 33%/47% was due to environmental factors not shared by twins. For preterm infants, genetic factors explained 34%/0% of the variance in boys/girls, shared environment 31%/57%, and unique environment 35%/43%. In very preterm twins, no significant contribution of genetic factors was observed.
Environment explains a large proportion of the resemblance of the postnatal blood T4 concentration in twin pairs. Because we analyzed neonatal screening results, the fetal environment is the most likely candidate for these environmental influences. Genetic influences on the T4 set point diminished with declining gestational age, especially in girls. This may be due to major environmental influences such as immaturity and nonthyroidal illness in very preterm infants.
In healthy individuals, thyroid function parameters such as the plasma TSH, free T4 (FT4) and free T3 (FT3) concentrations show large interindividual differences leading to wide laboratory reference intervals. Their intraindividual variability, however, is much smaller, suggesting that each individual has his or her own specific hypothalamus-pituitary-thyroid axis set point (1, 2).
Previous twin studies have shown that both genetic and environmental factors seem to contribute to this individual set point (3–8). In a large UK study of 2124 female adult twins, environmental factors determined 61% of variation in FT4 and 77% in FT3 (3). This suggests that FT4 and FT3 concentrations are mainly influenced by environmental rather than genetic factors.
The term set point describes that an individual trait remains stable over time, which seems to apply to the TSH, FT4, and FT3 concentrations (2). If indeed these set points are mainly determined by environmental factors, the question arises which environmental factors would have such a major influence that they may be held responsible for determining an individual's set point. We hypothesized that the answer may lie in the fetal environment, which has a major effect on postnatal health (9, 10).
The fetal and maternal thyroid hormone state has been shown to influence postnatal thyroid hormone levels. One example is infants born to inadequately treated mothers with Graves' disease. Kempers et al (11) described congenital central hypothyroidism (low plasma FT4 concentrations in the presence of normal TSH concentrations in the neonatal period), and ultimately loss of thyroid function and even morphology in these infants. Another example is severe primary congenital hypothyroidism (CH), eg, thyroid agenesis. When treating patients with this condition with levothyroxine, it is often necessary to aim for and keep plasma FT4 concentrations above the age-specific reference range interval to achieve a normal TSH concentration (12–14). This suggests that the pituitary-thyroid axis set point is altered, possibly caused by a hypothyroid intrauterine environment. Recently, it was shown that in normal pregnancies higher maternal T4 concentrations (within the normal range) are associated with lower birth weight as well as with higher T4 cord blood concentrations (15, 16).
To test the hypothesis that the fetal environment to a large extent determines the postnatal thyroid hormone concentration and the T4 set point, we conducted a classical twin study, comparing the resemblance of neonatal screening blood T4 concentrations in a large sample of mono- (MZ) and dizygotic (DZ) twin pairs.
Subjects and Methods
This study was based on record linkage of two databases: the Dutch neonatal CH screening results, stored at the National Institute for Public Health and Environment (Rijksinstituut voor Volksgezondheid en Milieuhygiene, RIVM) and The Netherlands Twin Register (NTR).
In the Dutch neonatal CH screening program blood is drawn on average on the fifth day after birth. The program consists of a three-step-approach with primary T4 measurement in filter paper blood spots followed by additional TSH measurement in the lowest 20% T4 concentrations, and additional measurement of T4 binding globulin in the lowest 5%. T4 concentrations are expressed as SD score to the daily mean of the values for the neonatal screening series of that day, which we will refer to as “standardized T4 scores.” For children born at least 36 weeks of gestation in combination with a birth weight less than or equal to 2500 g, T4 measurement is always combined with TSH measurement, and referral is based only on the TSH concentration to avoid unnecessary referral due to transient hypothyroxinemia of prematurity (THOP). Permission for retrieval of screening results for this specific study was granted by the national neonatal screening program committee, which is linked to the RIVM.
The NTR has been recruiting newborn twins in The Netherlands since 1989. Depending on birth cohort, between 25 and 40% of all multiple births in The Netherlands are registered by the NTR. The general aim of the NTR is to study behavioral and emotional development from birth onward, and parents and teachers are asked to provide information via surveys, started shortly after birth (17, 18).
Given that screening results were stored in a single national RIVM database only from 2006 onward, we selected twin pairs from the NTR database born between 2006 and 2011. In this 2006–2011 cohort, 4663 mothers had returned the first survey, which is collected after registration of the twins and includes information on maternal age at birth, gestational age, sex, birth weight, birth order, and zygosity. In this first survey mothers are asked for permission to link data to external databases in The Netherlands, and 4146 mothers (88.9%) gave this permission. If data were missing for gestational age (31 pairs), birth weight (93 pairs), or zygosity (147 pairs), or if infants were born abroad (22 pairs), pairs were not selected for linkage to screening results. The final NTR selection included 3853 twin pairs (7706 twins).
For 20% of the same-sex twins, classification of zygosity was based on items about physical similarity and frequency of confusion of the twins by parents and strangers, which are collected in a survey at the age of 3 years. A comparison with zygosity based on genomic polymorphisms revealed that this procedure correctly classifies zygosity in 93% of the cases (19). When this information was not available, zygosity was determined by a single item in a survey at the age of 2 years, indicating how much the children look alike (41%). This question correctly classifies zygosity in 92% of the cases (20). For the remaining part of the sample (39%), the zygosity was based on the maternal answer on the question whether the zygosity of the twin pair was MZ, DZ or unknown.
Statistical analyses
Means were estimated by SPSS version 21.0 (Statistical Packages for Social Sciences; SPSS Inc., Chicago, IL). To test effects of maternal age, gestational age, birth weight, and sex on standardized T4 scores, we applied a linear mixed-effects model. The model included these factors plus time (day) of screening and birth order as predictors for the standardized T4 scores. To correct for the dependence of the data from twin pairs, family was included as a random factor.
Genetic analysis
The relative contribution of genetic and environmental factors to the variance of the standardized T4 scores can be inferred using data from genetically related subjects such as MZ and DZ twins. The logic of the twin method is to compare the resemblance for a certain trait in MZ twin pairs, who are genetically almost 100% identical, with resemblance in DZ pairs, who share on average 50% of their segregating genes. If the MZ resemblance, often expressed in correlations, is twice as large as the DZ resemblance, the trait is influenced by genetic factors, because the only difference between the two zygosity groups is in genetic relatedness. Shared environmental experiences, such as the intrauterine environment, will affect both MZ and DZ twins in the same way, and is a source for resemblance, which does not depend on zygosity. If a trait is influenced by shared environment, it is expected that the DZ correlation is the same or larger than half the MZ correlation. Experiences not shared by twin pairs, called unique environment, will cause twins within MZ and DZ pairs to differ from each other and will make them more dissimilar. Examples of circumstances referred to as unique environment are differential placental implantation site, differences in transplacental transmission of nutrients and other agents, and differences in presentation during birth. Measurement error is also a source of unique environment (21).
With structural equation modeling, maximum likelihood estimates of the influence of additive genetic factors (A), common environment (C) shared by twins, and nonshared environment (E) were obtained for 3 groups: full-term born twins (≥37 wk), preterm-born twins (≥32 to <37 wk), and very preterm-born twins (<32 wk). To test whether the genetic and environmental factors differ among the three groups, the absolute genetic and environmental influences were constrained to be equal across the full-term, preterm, and very preterm groups. A significant decrease in goodness of fit implies that there are significant differences in genetic and/or environmental influences across the full-term and (very) preterm-born twins and the constraint is not allowed. Models were compared by likelihood-ratio tests. The difference in likelihood follows a χ2 distribution with −2 degrees of freedom (df) equal to the difference between the df for the full and the reduced model (22). The estimation of the twin correlations and genetic analyses were performed using Mx Software (Richmond, VA) (23). All analyses included sex and gestational age as a fixed covariate.
Results
Linkage results
The record linkage was successful in 7665 of the 7706 children. Of this group, 28 children were excluded because of lacking or uncertain CH screening results, three pairs (n = 6) who were original triplets, and there were four families with two pairs of twins, for which we included only one pair (n = 8). This left 7623 children (98.9% of the original selection of 7706 children of the NTR cohort), consisting of 3793 complete pairs and 37 incomplete pairs. There were 653 monozygotic male pairs (MZM), 630 dizygotic male pairs (DZM), 611 monozygotic female pairs (MZF), 656 dizygotic female pairs (DZF), and 1280 dizygotic opposite sex (male–female) pairs. Data on thyroid status of the mother or on other health problems of mother and fetus were not available.
Descriptive statistics
The standardized T4 scores of first- and second-born twins showed normal distributions with a mean standardized-T4-score lower than the population reference mean: –0.57 (SD = 1.10) (Figure 1). Table 1 shows standardized-T4-scores according to maternal age, gestational age, birth weight, and sex. The results of the linear mixed-effects model revealed significant effects of gestational age (F = 174.066; df = 2; P < .0001), birth weight (F = 70.423; df = 5; P < .0001), sex (F = 46.808; df = 1; P < .0001) and birth order (F = 27.291; df = 1; P < .0001). There was no effect of maternal age at birth (F < 1; df = 3; P = .544). Post hoc tests revealed that the standardized T4 scores were significantly lower in children with a gestational age below 37 weeks compared with children with a gestational age of 37 weeks or more. Children with a birth weight below 2500 g had lower standardized T4 scores compared with children with birth weight of 2500 g or higher. In addition, boys had lower standardized T4 scores than girls, standardized T4 scores of firstborn twins were slightly higher than that of second-born twins. Information on screening date was available for 85% of the children. In this group 72% of the children were screened at the fourth day, 90.6% before the sixth day of life and only 1% after 1 week. A later screening day was associated with a lower standardized T4 score (F = 7.173; P < .007). When including screening day in the model, the effects of other covariates remained the same.
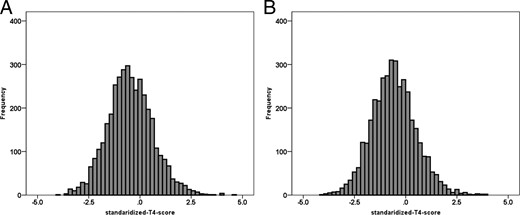
Distribution of standardized T4 SD scores in (A) the firstborn twin (n = 3820; mean, −0.52; SD = 1.104) and (B) second-born twin (n = 3803; mean, −0.62; SD, 1.086).
Means and sds of Standardized T4sd Scores Across Groups for Maternal Age, Gestational Age, Birth Weight, and Sex for First- and Second-Born Twins
| First Born | Second Born | |||||
|---|---|---|---|---|---|---|
| N | Mean | sd | N | Mean | sd | |
| Maternal age, y | ||||||
| <29.24 | 938 | −0.59 | 1.08 | 938 | −0.69 | 1.14 |
| ≥29.24 to <32.04 | 924 | −0.54 | 1.10 | 916 | −0.68 | 1.07 |
| ≥32.04 to <35.13 | 978 | −0.51 | 1.14 | 972 | −0.62 | 1.06 |
| ≥35.13 | 960 | −0.44 | 1.10 | 957 | −0.52 | 1.06 |
| Gestational age, wk | ||||||
| Full-term (≥37) | 2111 | −0.14 | 0.96 | 2106 | −0.23 | 0.93 |
| Preterm (>32 to <37) | 1402 | −0.76 | 1.01 | 1391 | −0.90 | 1.00 |
| Very preterm (≤32) | 307 | −2.04 | 0.83 | 306 | −2.08 | 0.78 |
| Birth weight, g | ||||||
| <1500 | 190 | −2.24 | 0.83 | 224 | −2.15 | 0.85 |
| 1500–1999 | 458 | −1.40 | 0.83 | 524 | −1.41 | 0.84 |
| 2000–2499 | 1095 | −0.55 | 1.00 | 1175 | −0.63 | 0.98 |
| 2500–2999 | 1383 | −0.20 | 0.95 | 1310 | −0.28 | 0.94 |
| 3000–3499 | 618 | −0.07 | 0.98 | 507 | −0.08 | 0.93 |
| ≥3500 | 76 | 0.06 | 0.99 | 63 | −0.01 | 0.91 |
| Sex | ||||||
| Boys | 1939 | −0.56 | 1.11 | 1888 | −0.68 | 1.07 |
| Girls | 1881 | −0.48 | 1.10 | 1915 | −0.57 | 1.10 |
Twin correlations
The results were taken forward in the genetic analyses (ie, different mean scores for first and second-born twins, a fixed effect of sex and gestational age). Twin correlations were obtained separately among the three groups: full-term twins, preterm twins, and very preterm twins. The twin correlations were corrected for gestational age and are given in Table 2. The full-term group showed stronger correlation in MZ than in DZ twins. However, the DZ correlations are more than half the MZ correlations, indicating an additional influence of shared environmental factors. For the preterm and the very preterm twin pairs, the difference between MZ and DZ twin correlations is less substantial than that in the full-term group, indicating that the resemblance in twins could be attributed more to shared environmental factors and less to genetic factors.
Gestational Age-Corrected Twin Correlations (r) and Variance Estimates for Standardized T4 Scores in Full-term, Preterm, and Very Preterm Infants
| N | r | T1 Var | T2 Var | |
|---|---|---|---|---|
| Full term (≥37 wk) | ||||
| MZM | 308 | 0.689 | 0.9335 | 0.9334 |
| DZM | 378 | 0.479 | 0.9413 | 0.9108 |
| MZF | 278 | 0.532 | 0.8876 | 0.8771 |
| DZF | 395 | 0.371 | 0.8424 | 0.9420 |
| DOS | 757 | 0.409 | 0.8374 | 0.8040 |
| Preterm (>32 to <37 wk) | ||||
| MZM | 281 | 0.6605 | 0.8720 | 0.8269 |
| DZM | 207 | 0.424 | 0.7626 | 0.7838 |
| MZF | 265 | 0.5598 | 0.9381 | 0.9103 |
| DZF | 217 | 0.601 | 0.7270 | 0.7080 |
| DOS | 435 | 0.449 | 0.8520 | 0.7929 |
| Very preterm (≤32 wk) | ||||
| MZM | 64 | 0.548 | 0.4250 | 0.4812 |
| DZM | 45 | 0.405 | 0.3155 | 0.4618 |
| MZF | 68 | 0.545 | 0.5014 | 0.4021 |
| DZF | 44 | 0.506 | 0.4680 | 0.5212 |
| DOS | 88 | 0.431 | 0.4410 | 0.6227 |
Abbreviations: DOS, dizygotic opposite sex; T1 var, gestational age-corrected variation for twin 1; T2 var, gestational age-corrected variation for twin 2.
With structural equation models, we estimated the effects of genetic and environmental influences for full-term and preterm groups separately. Constraining the influence of genetic and environmental factors to be equal across the three groups revealed significantly deteriorated fits compared with the full model (Table 3), indicating that the influences of genetic and environmental factors were different across these three groups. In a next series of analyses, the constraints of equal genetic and environmental variances across the three groups were performed separately for boys and girls (Table 3). These results showed that the group differences in genetic and environmental influences on standardized T4 scores were significant for girls but not for boys.
Results of Model Fitting for Standardized T4 Scores in a Multigroup Analysis
| Model | Goodness of Fit Test | Model Fit Comparison | ||||
|---|---|---|---|---|---|---|
| χ2 | df | Versus Model | Δχ2 | Δdf | P | |
| Full model | ||||||
| ACE estimates were different in the groups of term, preterm, and very preterm and were different in boys and girls | 18 962.907 | 7593 | ||||
| Constraining A, C, or E to be equal in the groups both for boys and girls | ||||||
| As FM but A equal across groups | 18 977.181 | 7597 | 1 | 14.274 | 4 | .006 |
| As FM but C equal across groups | 18 976.014 | 7597 | 1 | 13.108 | 4 | .011 |
| As FM but E equal across groups | 18 980.002 | 7597 | 1 | 17.096 | 4 | .002 |
| Constraining A, C, or E to be equal in the groups only in boys | ||||||
| As FM but A equal across groups | 18 967.675 | 7595 | 1 | 4.769 | 2 | .092 |
| As FM but C equal across groups | 18 963.823 | 7595 | 1 | 0.916 | 2 | .633 |
| As FM but E equal across groups | 18 967.202 | 7595 | 1 | 4.295 | 2 | .117 |
| Constraining A, C, or E to be equal in the groups only in girls | ||||||
| As FM but A equal across groups | 18 970.795 | 7595 | 1 | 7.889 | 2 | .019 |
| As FM but C equal across groups | 18 974.697 | 7595 | 1 | 11.791 | 2 | .003 |
| As FM but E equal across groups | 18 975.499 | 7595 | 1 | 12.593 | 2 | .002 |
Abbreviations: A, additive genetic factors; C, shared environmental factors; E, unique environmental factors.
ACE estimates were allowed to be different in the 3 groups of full term, preterm, and very preterm infants.
In Table 4 heritability estimates (and their 95% confidence interval [CI]) for standardized T4 scores are shown. In full-term (≥37 wk) boy twins, additive genetic factors explained 40% of the variance in standardized T4 scores, whereas shared environmental factors explained 27% and unique environmental effects explained 33%. In full-term girl twins additive genetic factors explained 31% of the variance in standardized T4 scores, shared environmental factors explained 22% and unique environmental effects explained 47%. In preterm (>32 to <37 wk) boy twins, additive genetic factors explained 34% of the variance, shared environmental factors 31%, and unique environmental factors 35%; whereas in preterm girl twins no effect of additive genetic factors was seen and only shared (57%) and unique environmental factors (43%) were involved. In the very preterm (≤32 wk) twins for both boys and girls, the contribution of genetic factors was not significant. Shared (23% and 49% for boys and girls, respectively) and unique environmental factors (45% and 39% for boys and girls, respectively) contributed to the variance of standardized T4 scores.
Estimates (and 95% CI) of Genetic and Environmental Influences for Standardized T4 Scores Corrected for Gestational Age in the Full-Term, Preterm, and Very Preterm Infants
| Gestational Age | a2 | c2 | e2 |
|---|---|---|---|
| Full term | |||
| Boys | 0.4015 (0.24–0.55) | 0.2739 (0.15–0.41) | 0.3246 (0.28–0.38) |
| Girls | 0.3104 (0.11–0.47) | 0.2149 (0.10–0.37) | 0.4747 (0.41–0.56) |
| Preterm | |||
| Boys | 0.3403 (0.19–0.50) | 0.3092 (0.19–0.44) | 0.3504 (0.30–0.42) |
| Girls | 0.0040 (0–0.10) | 0.5719 (0.47–0.63) | 0.4241 (0.37–0.48) |
| Very preterm | |||
| Boys | 0.3240 (0–0.60) | 0.2295 (0.02–0.61) | 0.4466 (0.32–0.64) |
| Girls | 0.1219 (0–0.61) | 0.4870 (0.05–0.69) | 0.3911 (0.27–0.55) |
Abbreviations: a2, relative contribution of additive genetic factors; c2, relative contribution of shared environmental factors; e2, relative contribution of unique environment.
Discussion
In this study neonatal screening blood T4 concentrations of a large cohort of MZ and DZ twin pairs were compared and heritability was calculated. In full-term infants genetic factors were found to explain 31–40% of the variation in postnatal T4 concentrations, and environmental factors (unique and shared) were responsible for 60–69% of the variation. So although genetics do influence postnatal T4 concentrations, the environment seems to play an important role. Because blood T4 concentrations were measured on average on the fifth day of life, the fetal environment is the most likely candidate for the shared environmental influences on postnatal T4 concentrations.
Several studies have attempted to estimate the contribution of genetic vs environmental influences on the individual T4 set point, using either twin- or family-based study designs (3–7). The heritability estimates from these studies ranged from 32–65%, and our findings of 31–40% heritability fall within this range. The range of heritabilities is rather large and may be explained by differences in study designs, sample sizes, sex, ages, and ethnicity (8). Although all previous studies were performed in adult samples, our heritabilities in the subgroup of full-term infants were very comparable. For example, Panicker et al (3) reported a heritability of 39% for FT4 in female adult twin pairs. This suggests that the contribution of genetic vs environmental influences in full-term infants remains stable throughout life. Genetic studies have revealed several candidate genes that may be involved in T4 set point determination. However, the contribution of each of these genes to the variability in thyroid hormone concentrations was small (8, 24–26). This may mean that other genes play a role, but it is also possible that nongenomic mechanisms play an important role in T4 set point determination. During embryonic development, driven by environmental forces, the epigenome undergoes modification, including DNA methylation and histone acetylation, leading to altered gene expression. This has been demonstrated for maternal diet and has been proposed to underlie the fetal origins of adult disease hypothesis (27–30). We hypothesize that the mechanism underlying T4 set point determination also lies in epigenetic modifications taking place during the fetal period.
The large variation in gestational ages enabled us to study the effect of prematurity. In preterm infants, at least in girls, the estimated heritability was lower than in full-term infants. In fact, the heritability seemed to diminish with declining gestational age. In preterm infants born between 32 and 37 weeks' gestation, heritability decreased to 34% in boys and was not significant in girls. For very-preterm infants (≤32 wk gestation) variation in standardized T4 scores was completely determined by environmental factors.
Preterm infants have lower umbilical cord T4 concentrations than full-term infants, that correlate with gestational age and birth weight (31). Our results are in line with this, with the lowest standardized T4 scores in the most preterm and lowest birth weight infants. Within the first 72 hours of life, full-term infants display a TSH surge that is accompanied by increases in plasma T4 and T3 concentrations. In preterm infants the postnatal TSH surge is less pronounced, and in very preterm infants it is often absent. In the latter group of infants the T4 concentration may even decrease, which is referred to as THOP. Multiple factors are involved in THOP such as immaturity of the hypothalamic-pituitary-thyroid-axis, limited thyroid gland reserve, early loss of transplacental T4 supply, and acute illness (31–33). Any illness on itself has a major influence on thyroid function, a phenomenon known as nonthyroidal illness syndrome (NTI, also known as euthyroid sick syndrome). NTI leads to decreased T4 and T3 concentrations and in premature infants NTI-like changes contribute to THOP (34). In this study for the preterm infants, and especially for the very-preterm infants, immaturity and illness seem to have such a major influence on the thyroid hormone parameters that the genetic influence on the postnatal blood T4 concentration seems to be “overruled.” This may explain the apparent “decrease” of heritability with declining gestation age found in our study. The hypothalamic-pituitary-thyroid negative feedback axis matures with time. In full-term infants the axis is mature at birth but in very premature infants the maturation continues during the first 6 weeks of postnatal life (35). Given that we analyzed T4 values measured within the first week of life, these values do not depict the actual T4 set point, especially in the very preterm infants.
Other intriguing findings in this study were significantly lower standardized T4 scores in boys compared with girls, and significantly lower standardized T4 scores in second-born compared with first-born infants. The explanation for the sex difference may lie in the so-called male disadvantage hypothesis that was introduced in 1971 by Naeye et al (36) as an explanation for the increased perinatal morbidity that is observed in boys compared with girls. This poorer neonatal outcome in boys has been confirmed in various other studies (37–40). Perhaps the lower standardized T4 scores found in boys suggest a more pronounced THOP due to more neonatal morbidity.
The lower standardized T4 scores in second-born twins may be explained by the disadvantage brought to the second-born twin due to a prolonged twin-to-twin delivery time index. This is an independent risk factor for an adverse neonatal outcome of the second-born twin and is associated with lower umbilical arterial cord pH (41–43). The lower standardized T4 scores in second twins may be the result of increased morbidity compared with firstborn twins.
Because we analyzed neonatal screening standardized T4 scores (taken on average on the fifth day after birth), a limitation of our study is that results may be influenced by environmental factors occurring during the first days of life. Ideally, we should have analyzed plasma T4 concentrations taken directly postpartum by umbilical cord sampling. Although the TSH surge observed in full-term infants during the first 72 hours after birth is usually on the decline at the time of sampling for the neonatal screening, the surge itself is driven by a major environmental factor (exposure to the cold extrauterine environment leading to stimulation of peripheral and central hypothalamic cold receptors). This could have led to an overestimation of the environmental influence for the full-term infants. Another limitation is that we used neonatal screening results, and hence could only analyze blood total T4 concentrations and not FT4 concentrations. Total T4 concentrations are influenced by T4 binding globulin concentrations and we were unable to correct for this.
In conclusion, in this study of neonatal T4 screening results in a large Dutch twin cohort we found that environmental factors were the major factor influencing variability in postnatal blood T4 concentrations. Given that we analyzed neonatal screening results, this emphasizes the importance of the fetal environment for the postnatal T4 concentration. This suggests that the mechanism underlying T4 set point determination may lie in epigenetic modifications taking place in the fetal period. Heritability for T4 set point diminished, at least for girls, with declining gestational age, most likely due to the major environmental influences of immaturity and illness in very preterm infants.
Acknowledgments
Disclosure Summary: The authors have nothing to disclose.
N. Z.-S. and C.E.M.v.B. contributed equally to the study.
D.I.B. and A.S.P.v.T. jointly directed this study.
Abbreviations
- A
additive genetic factors
- C
common environment
- CH
congenital hypothyroidism
- CI
confidence interval
- df
degrees of freedom
- DZ
dizygotic
- DZF
dizygotic female pair
- DZM
dizygotic male pair
- E
nonshared environment
- FT4
free T4
- MZ
monozygotic
- MZF
monozygotic female pair
- MZM
monozygotic male pair
- NTI
nonthyroidal illness syndrome
- NTR
Netherlands Twin Register
- RIVM
Rijksinstituut voor Volksgezondheid en Milieuhygiene
- THOP
transient hypothyroxinemia of prematurity.
