


The circadian clock coordinates numerous metabolic processes with light-dark and feeding regimens. However, in humans it is unknown whether dietary patterns influence circadian rhythms.
We examined the effects of switching from a high-carbohydrate, low-fat diet to a low-carbohydrate, high fat (LC/HFD) isocaloric diet on the central and peripheral circadian clocks in humans.
Diurnal patterns of salivary cortisol and gene expression were analyzed in blood monocytes of 29 nonobese healthy subjects before and 1 and 6 weeks after the dietary switch. For this, we established a method of rhythm prediction by 3-time point data.
The centrally driven cortisol rhythm showed a phase delay 1 and 6 weeks after the dietary switch to a LC/HFD as well as an amplitude increase. The dietary switch altered diurnal oscillations of core clock genes (PER1, PER2, PER3, and TEF) and inflammatory genes (CD14, CD180, NFKBIA, and IL1B). The LC/HFD also affected the expression of nonoscillating genes contributing to energy metabolism (SIRT1) and fat metabolism (ACOX3 and IDH3A). Expression of clock genes but not of salivary cortisol in monocytes tightly correlated with levels of blood lipids and with expression of metabolic and inflammatory genes.
Our results suggest that the modulation of the dietary fat and carbohydrate content alters the function of the central and peripheral circadian clocks in humans.
The major components of energy homeostasis are subjected to circadian regulation that synchronizes energy intake and expenditure with the day/night cycle (1). The master clock pacemaker in the suprachiasmatic nucleus of the hypothalamus orchestrates subsidiary clocks in peripheral tissues probably via multiple routes (1). A large part of the transcriptome and metabolome in peripheral tissues displays circadian oscillations including components of carbohydrate, cholesterol, and lipid metabolism, detoxification pathways, and inflammatory responses (2–4).
The role of circadian clocks in the regulation of metabolic processes was confirmed in both human studies in shift workers and in animal models with genetic disruption of circadian rhythms (5–7). Conversely, metabolic signals also feed back into the circadian system, modulating circadian gene expression and behavior. In addition to light, food availability and feeding regimens are dominant external cues affecting in particular peripheral clocks as demonstrated in rodents (8, 9). Moreover, animal studies demonstrated alterations of behavioral and molecular circadian rhythms induced by a calorically dense high-fat diet (HFD) (4, 8, 10). Alterations of clock oscillations were shown in many metabolic conditions such as obesity, type 2 diabetes, metabolic syndrome, and cardiovascular disease (11–13). Recently, the effect of food intake/fasting on diurnal rhythms of gene expression was demonstrated in human adipose tissue (3). Insulin is shown to be a humoral signal involved in feeding-induced circadian entrainment in liver and adipose tissue in mice (14). However, little is known about the effect of food composition on circadian mechanisms in humans and its role in metabolic regulation.
For monitoring peripheral circadian rhythms in humans, an analysis of the whole-blood transcriptome is widely used as a relatively simple and minimally invasive method (15). However, circadian rhythms in single blood cell types such as monocytes remain unexplored. Monocytes play a pivotal role in immune functions and metabolic regulation (16, 17). They are able to respond to nutrient-related hormonal stimuli (18). Therefore, blood monocytes represent an exciting target for the analysis of circadian rhythms in human metabolic studies.
In this study, we examined whether an isocaloric change of the food composition affects central and peripheral circadian clock in humans. For this, we provided a detailed analysis of the diurnal patterns of salivary cortisol and clock gene expression in blood monocytes before and after the switch from a high-carbohydrate, low-fat diet (HC/LFD) to a low-carbohydrate, high-fat isocaloric diet (LC/HFD). Moreover, we analyzed how the dietary-induced alterations of the circadian clock are associated with changes of biochemical parameters and with expression of genes related to the inflammatory response and fat metabolism.
Materials and Methods
Subjects and design of the study
The study was approved by the Ethics Commission of Charité University Medicine Berlin. The study was conducted in the outpatient department of the German Institute of Human Nutrition in accordance with the Declaration of Helsinki and registered at www.clinicaltrials.gov (registration no. NCT01631123). All subjects provided written, informed consent. The baseline examination included a physical examination, a 75-g oral glucose tolerance test, standard biochemical analyses, and an interview on medical history. Twenty-nine nonobese individuals (Supplemental Table 1 and Supplemental Figure 1, A and B) with normal glucose tolerance participated in this study. During the 6 weeks before the high-fat intervention, participants consumed an isocaloric HC/LFD (55% carbohydrates, 15% proteins, and 30% fat). Then the subjects switched to the isocaloric LC/HFD(40% carbohydrates, 15% proteins, and 45% fat) for 6 weeks (Figure 1A). Subjects participated in 3 exactly identical clinical investigation days (CIDs): after the HC/LFD phase (CID1) and after 1 (CID2) and 6 (CID3) weeks of the LC/HFD. At each CID, blood samples were taken at 3 time points during the daytime (at 8:00 am, 11:15 am, and 3:45 pm). Monocytes were isolated using CD14 MicroBeads (Miltenyi Biotec), and gene expression was measured by quantitative real-time PCR (qRT-PCR) using specific primers (Supplemental Table 2). Saliva samples for the cortisol and melatonin measurements were collected 1 day before each CID (every 4 hours during 24 hours).
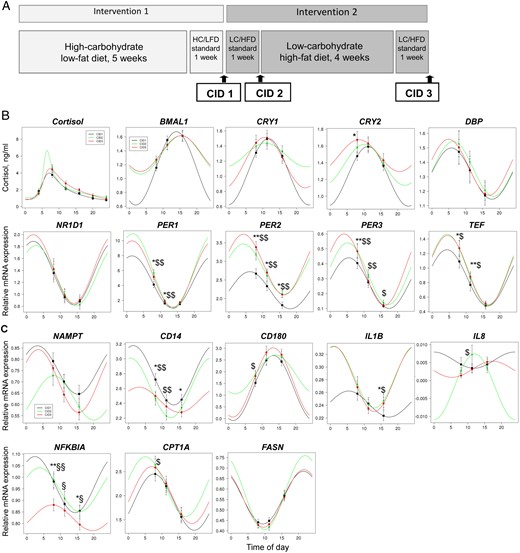
Influence of the diet switch on cortisol rhythm and diurnal oscillations of gene expression in monocytes in humans.
A, Design of the study. After 6 weeks of the isocaloric HC/LFD, participants consumed the isocaloric LC/HFD for 6 weeks. Subjects were investigated at 3 CIDs: after the HC/LFD phase (CID1) and after 1 (CID2) and 6 (CID3) weeks of the LC/HFD. Blood samples were collected at 3 time points during each CID: in the morning (at 8:00 am), at noon (at 11:15 am), and in the afternoon (at 3:45 pm). B, Salivary cortisol values were measured at 6 time points during 24 hours at CID1 (n = 29). Expression levels of clock genes BMAL1, CRY1, CRY2, DBP, NR1D1, PER1, PER2, PER3, and TEF were measured at 3 time points of 3 CIDs by qRT-PCR and normalized to the geometric means of PPIB, B2M, and HPRT (n = 29). Data obtained were fitted to the sinus model or extended sinus model for clock genes and cortisol, respectively (results of this analysis are also shown in Table 2). C, Expression levels of metabolic and inflammatory genes NAMPT, CD14, CD180, IL1B, IL8, NFKBIA, CPT1A, and FASN were measured at 3 time points of 3 CIDs by qRT-PCR (n = 29). Data obtained were fitted to the sinus model (results of this analysis are also shown in Table 3). *, P < .05 and **, P < .01 for CID3 vs CID1; $, P < .05 and $$, P < .01 for CID2 vs CID1; §, P < .05 and §§, P < .01 for CID3 vs CID2 by the Wilcoxon test. Data are presented as means ± SE.
Three-time point rhythm prediction method.
Bootstrapping approach
We generated 1000 random sets of the same size by resampling the donors with replacement. Values for the mesor, the amplitude, and the peak time (nadir for cortisol) were obtained for each of the 1000 sampled groups after the data were fitted to the sinus or extended sinus model and are displayed as boxplots (Supplemental Figure 2A). P values for differences between the CIDs were estimated using permutation tests.
Simulation approach
Synthetic sets were generated with parameter values derived from the original data. In short, we calculated the values for 3 time points derived from perfect sinus models with varying amplitudes (from 0.25 to 5) and acrophases (from 1 to 24) and added varying amounts of white noise. To get a range for the noise, we estimated the SEM for all measurements of all genes. Values varied from 0.00064 to 0.42 with >80% below 0.125. The procedure was repeated 1000-fold for each combination of amplitude, peak time, and noise. Mean values, deviations from the original sinus fits, coefficients of variation (amplitudes) and SDs (peak times) were calculated and are summarized in heat maps (Supplemental Figure 2B).
Analysis of frequently sampled microarray data
The online available microarray data set (Gene Expression Omnibus [GEO] accession no. GSE48113) included whole-blood transcriptomes of 22 donors for every 4 hours over 1 day (overall 7 measurements for each donor) when sleeping occurred in phase with melatonin rhythm (15). Probes associated with genes of interest were identified by the gene symbols of the Agilent and the custom-made specific probes, respectively. Sinus models were fitted to the data of each probe separately. For each gene, the probe with the best fit (lowest P value) was used for comparison with our own results if the P value was <.05.
See the Supplemental Methods for a full description of all methods.
Results
Clinical characteristics of subjects
Twenty-nine nonobese individuals with normal glucose tolerance participated in this study (Supplemental Table 1). After the dietary switch to the LC/HFD, no changes in anthropometric characteristics (body mass index, waist-to-hip ratio, and total body fat), fasting insulin and glucose, triglycerides, and C-reactive protein were found. As expected, the total, HDL, and LDL cholesterol levels were increased after 1 and 6 weeks of the LC/HFD (Supplemental Table 1). Nonesterified fatty acid (NEFA) levels were decreased after 6 weeks of the diet intervention (Supplemental Table 1). Serum IL-6 was increased 1 week after the dietary switch.
Dietary switch to LC/HFD alters diurnal oscillations of clock genes in human monocytes
To determine whether the isocaloric change of food composition affects the peripheral clock, we measured expression levels of 10 core clock genes in blood monocytes before and 1 and 6 weeks after the switch from the HC/LFD to the LC/HFD, 3 times at each CID (at 8:00 am, 11:15 am, and 3:45 pm). Analysis by two-way RM ANOVA revealed significant time effects for all genes examined (Supplemental Table 3). Expression levels of PER1-3, DBP, TEF, and NR1D1 were highest in the morning compared with those in the noon and afternoon samples in all subjects, whereas BMAL1 demonstrated an upward trend during the day (Figure 1B and Supplemental Figure 1C). PER1 had the largest “amplitude” in the time frame analyzed. Notably, considerable interindividual differences in expression levels and amplitudes of clock genes were found in the time frames analyzed, which are obviously explained by individual features of the clock oscillator (Supplemental Figure 1C).
Furthermore, we analyzed circadian oscillations of clock genes using the fitting of the sinus model to obtain values for amplitude, mesor, and peak time. To perform this with the 3-time point data received in our study, we established the procedure of prediction of diurnal expression rhythm suggested previously (20). A fitting of the sinus model with 3 parameters to only 3 data points is not meaningful, so we were not able to do the fittings for all donors separately. Instead of this, we fitted the data of all donors together to the sinus models, allowing the estimation of averaged values for mesor, amplitude, and peak time (Figure 1B and Table 1). Our 3-time point prediction confirmed significant diurnal oscillations of all clock genes examined except for CLOCK (Table 1).
Cosinor Analysis of Salivary Cortisol and Clock Gene Expression in Monocytes
| Gene | CID | Cosinor Fitting | Mesor | P Value | Amplitude | P Value | Acrophase/Nadir | P Value | |||||||
|---|---|---|---|---|---|---|---|---|---|---|---|---|---|---|---|
| r2 | P Value | CID1 vs CID2 | CID2 vs CID3 | CID1 vs CID3 | CID1 vs CID2 | CID2 vs CID3 | CID1 vs CID3 | CID1 vs CID2 | CID2 vs CID3 | CID1 vs CID3 | |||||
| Cortisol | CID1 | 0.42 | <.001 | 1.50 | 1.60 | 11:59 pm | |||||||||
| CID2 | 0.53 | <.001 | 1.70 | .335 | .212 | .139 | 2.80 | .065 | .062 | .491 | 1:29 am | .009 | .714 | .002 | |
| CID3 | 0.48 | <.001 | 1.80 | 1.80 | 1:16 am | ||||||||||
| BMAL1 | CID1 | 0.28 | <.001a | 1.15 | 0.53 | 1:54 pm | |||||||||
| CID2 | 0.22 | <.001a | 1.34 | .130 | .850 | .074 | 0.28 | .068 | .840 | .027 | 3:22 pm | .210 | .970 | .140 | |
| CID3 | 0.14 | .002a | 1.36 | 0.26 | 3:19 pm | ||||||||||
| CLOCK | CID1 | 0.03 | .340 | ||||||||||||
| CID2 | 0.03 | .290 | |||||||||||||
| CID3 | 0.01 | .780 | |||||||||||||
| CRY1 | CID1 | 0.07 | .046 | 1.06 | 0.44 | 11:38 am | |||||||||
| CID2 | 0.01 | .630 | |||||||||||||
| CID3 | 0.04 | .150 | |||||||||||||
| CRY2 | CID1 | 0.09 | .016a | 1.24 | 0.36 | 11:08 am | |||||||||
| CID2 | 0.06 | .066 | |||||||||||||
| CID3 | 0.05 | .120 | |||||||||||||
| DBP | CID1 | 0.08 | .026 | 1.32 | 0.18 | 5:49 am | |||||||||
| CID2 | 0.09 | .016a | 1.35 | .670 | 0.19 | .620 | 6:18 am | .820 | |||||||
| CID3 | 0.06 | .070 | |||||||||||||
| NR1D1 | CID1 | 0.12 | .006a | 1.36 | 0.53 | 1:58 am | |||||||||
| CID2 | 0.15 | .001a | 1.32 | .790 | .320 | .690 | 0.50 | .830 | .530 | .760 | 2:42 am | .240 | .220 | 1.000 | |
| CID3 | 0.10 | .011a | 1.42 | 0.58 | 1:58 am | ||||||||||
| PER1 | CID1 | 0.44 | <.001a | 4.47 | 3.49 | 1:36 am | |||||||||
| CID2 | 0.64 | <.001a | 5.93 | .009 | .460 | .030 | 4.99 | .024 | .410 | .100 | 1:48 am | .300 | .250 | .810 | |
| CID3 | 0.64 | <.001a | 5.53 | 4.43 | 1:38 am | ||||||||||
| PER2 | CID1 | 0.25 | <.001a | 2.22 | 0.50 | 6:09 am | |||||||||
| CID2 | 0.29 | <.001a | 2.79 | .033 | .630 | <.001a | 0.68 | .170 | .490 | .005 | 4:17 am | .380 | 1.000 | .120 | |
| CID3 | 0.42 | <.001a | 2.91 | 0.81 | 4:17 am | ||||||||||
| PER3 | CID1 | 0.33 | <.001a | 0.27 | 0.17 | 5:26 am | |||||||||
| CID2 | 0.35 | <.001a | 0.33 | .093 | .520 | .028 | 0.21 | .086 | .360 | .016 | 5:09 am | .850 | .230 | .120 | |
| CID3 | 0.44 | <.001a | 0.36 | 0.24 | 4:03 am | ||||||||||
| TEF | CID1 | 0.27 | <.001a | 0.87 | 0.39 | 4:20 am | |||||||||
| CID2 | 0.38 | <.001a | 0.97 | .290 | .990 | .290 | 0.49 | .140 | .870 | .140 | 4:25 am | .930 | .890 | .860 | |
| CID3 | 0.37 | <.001a | 0.97 | 0.48 | 4:33 am | ||||||||||
The fitting was performed using a sinus model and an extended sinus model for clock genes and salivary cortisol, respectively. For clock genes, acrophase times are shown and for cortisol nadir times (corresponding acrophase times for cortisol are 7:04 am, 6:26 am, and 7:22 am for CID1, CID2, and CID3, respectively, P = 0.058 for CID1 vs CID2, P = 0.041 for CID2 vs CID3, P = 0.594 CID1 vs CID3; see Results for details).
P < .05 after false discovery rate correction for clock genes.
To estimate the robustness of the parameters determined and the limitations of our method, we used bootstrapping and simulation approaches, respectively (Supplemental Figure 2, A and B), as described in detail in Materials and Methods. This analysis demonstrates clearly that given a good ratio from amplitudes to noise, our method is suitable to predict amplitudes and acrophases with reasonable sensitivity and specificity. Only in cases with very weak amplitudes and high noises can stronger deviations of amplitude and acrophase from the simulation results to the expected values be observed, as was found for FASN and NFKBIA (Supplemental Figure 2B).
For further validation of our 3-time point prediction method, we compared our results with frequently sampled whole-blood transcriptome data (15). The peak times of clock genes BMAL1, NR1D1, PER2, PER3, TEF, CPT1A, and FASN were within a 1.5-hour range compared with our results, whereas other oscillating genes showed higher deviances (Tables 1 and 2 and Supplemental Table 4).
Cosinor Analysis of Metabolic and Inflammatory Genes in Monocytes
| Gene | CID | Cosinor Fitting | Mesor | P Value | Amplitude | P Value | Acrophase | P Value | |||||||
|---|---|---|---|---|---|---|---|---|---|---|---|---|---|---|---|
| r2 | P Value | CID1 vs CID2 | CID2 vs CID3 | CID1 vs CID3 | CID1 vs CID2 | CID2 vs CID3 | CID1 vs CID3 | CID1 vs CID2 | CID2 vs CID3 | CID1 vs CID3 | |||||
| Energy metabolism | |||||||||||||||
| NAMPT | CID1 | 0.09 | .019 | 0.75 | 0.11 | 3:23 am | |||||||||
| CID2 | 0.08 | .037 | 0.63 | .073 | .180 | .370 | 0.10 | .680 | .079 | .530 | 8:09 am | .180 | .084 | .880 | |
| CID3 | 0.17 | <.001a | 0.70 | 0.14 | 3:35 am | ||||||||||
| LPS response | |||||||||||||||
| CD14 | CID1 | 0.10 | .013a | 2.78 | 0.40 | 1:26 am | |||||||||
| CID2 | 0.06 | .088 | .022 | .180 | .240 | ||||||||||
| CID3 | 0.08 | .035 | 2.45 | 0.17 | 3:08 am | ||||||||||
| CD180 | CID1 | 0.16 | .001a | 1.31 | 1.39 | 1:22 pm | |||||||||
| CID2 | 0.08 | .033 | 1.89 | .035 | .130 | .330 | 0.83 | .190 | .084 | .800 | 1:57 pm | .420 | .290 | .840 | |
| CID3 | 0.12 | .005a | 1.54 | 1.48 | 1:17 pm | ||||||||||
| IL1B | CID1 | 0.08 | .038 | 0.24 | 0.02 | 5:24 am | |||||||||
| CID2 | 0.06 | .079 | .028 | 0.05 | .095 | 1:05 am | .024 | ||||||||
| CID3 | 0.08 | .035 | 0.28 | 0.05 | 1:00 am | ||||||||||
| IL8 | CID1 | 0.00 | .870 | ||||||||||||
| CID2 | 0.04 | .150 | |||||||||||||
| CID3 | 0.07 | .043 | 0.00 | 0.002 | 5:21 pm | ||||||||||
| NFKBIA | CID1 | 0.14 | .002a | 0.97 | 0.12 | 2:23 am | |||||||||
| CID2 | 0.10 | .011a | 0.95 | .620 | .001a | .001a | 0.10 | .610 | .095 | .069 | 3:46 am | .390 | .190 | .055 | |
| CID3 | 0.07 | .048 | 0.83 | 0.06 | 7:35 am | ||||||||||
| Fat metabolism | |||||||||||||||
| CPT1A | CID1 | 0.22 | <.001a | 1.87 | 0.59 | 7:37 am | |||||||||
| CID2 | 0.21 | <.001a | 2.19 | .072 | .370 | .230 | 0.62 | .530 | .690 | .930 | 5:06 am | .100 | .310 | .490 | |
| CID3 | 0.18 | <.001a | 2.01 | 0.59 | 6:55 am | ||||||||||
| FASN | CID1 | 0.31 | <.001a | 0.56 | 0.13 | 9:25 pm | |||||||||
| CID2 | 0.39 | <.001a | 0.58 | .470 | .450 | .920 | 0.18 | .140 | .380 | .780 | 9:55 pm | .450 | .630 | .870 | |
| CID3 | 0.37 | <.001a | 0.56 | 0.14 | 9:34 pm | ||||||||||
The fitting was performed using a sinus model as described in Materials and Methods. Only genes significantly fitted to this curve are shown.
P < .05 after false discovery rate correction.
Using our 3-time point prediction method, we then investigated whether the dietary switch alters diurnal oscillations of clock genes. Indeed, we found diet effects on PER1, PER2, PER3, and TEF expression levels in preliminary analysis with RM ANOVA (Supplemental Table 3). Expression levels of these genes and their amplitudes between morning and afternoon increased after a dietary switch to the LC/HFD (Figure 1B and Supplemental Figure 3). The 3-time point prediction also demonstrated the LC/HFD-induced increases in mesor and amplitude of PER1, PER2, and PER3 without any shifts in acrophase (Table 1).
Dietary switch to LC/HFD affects cortisol rhythm
To determine whether the switching from the HC/LFD to the LC/HFD also affects the central clock, we measured salivary cortisol and melatonin concentrations during 24 hours at 3 CIDs. As expected, salivary cortisol levels demonstrated diurnal variation with a peak in the morning, at approximately 7:00 am and also showed considerable interindividual differences at CID1 (Supplemental Figure 1D) and in response to the dietary switch (data not shown). Analysis of the cortisol rhythm using an extended sinus model revealed a delay of the nocturnal nadir (time of the curve minimum) at CID2 and CID3 for 1 hour 30 minutes and 1 hour 17 minutes, respectively (Table 1). Interestingly, cortisol “daytime amplitudes” between 8:00 am and 4:00 pm increased in response to the dietary switch (Supplemental Figure 3). Accordingly, the predicted cortisol curve showed an increase in the morning peak 1 week after the diet switch (Figure 1B). Notably, no differences of lifestyle schedule (wake and meal times) were found between CID1, CID2, and CID3 (data not shown). For salivary melatonin, we were not able to find a fitting model (21) providing reasonable accuracy for diurnal rhythm analysis (data not shown).
Dietary switch affects expression of metabolic and inflammatory genes in monocytes
To determine whether the LC/HFD may have an effect on clock-controlled metabolic genes in monocytes, we measured the expression levels of a range of metabolic and inflammatory genes that demonstrated circadian expression in murine studies (2, 22, 23) (Supplemental Table 4). An analysis by RM ANOVA revealed significant time effects on the expression levels of most genes examined in human monocytes, eg, fat metabolism (ACOX3, CPT1A, FASN, and HADH), energy metabolism (NAMPT), and lipopolysaccharide (LPS) response (CD14, CD180, JUN, MAPK3, NFKBIA, CCL2, CCL3, IL10, IL1B, IL8, and TNFA) genes (Supplemental Table 3). In particular, for fat metabolism genes, we detected an increase in FASN and a decrease in CPT1A during the day (Figure 1C). The LPS response genes CD14 and NFKBIA and the cytokine IL1B showed a downward trend, and CD180 and IL10 demonstrated upward trends throughout the day. TNFA and CCL3 mRNA exhibited the highest levels at noon. NAMPT demonstrated the highest level in the morning (Figure 1C).
Further, the 3-time point rhythm prediction confirmed that NAMPT, CD14, CD180, IL1B, NFKBIA, CPT1A, and FASN are under diurnal control in human monocytes (Figure 1C and Table 2). The switch to the LC/HFD induced mesor changes of CD14, NFKBIA (decrease), CD180, and IL1B (increase) without any shifts of oscillation peaks (Table 2). For IL1B only, a phase delay was found after 6 weeks of diet intervention (Table 2).
Expression of other daytime-dependent genes did not fit a cosine function. Expression levels of SIRT1, IDH3A, and LPL did not change with time (Supplemental Table 3). For some of these genes, we also found diet effects according to the RM ANOVA (Supplemental Table 3). Indeed, LC/HFD induced a down-regulation of the expression of SIRT1 and ACOX3 and up-regulation of IDH3A (Figure 2). No influence of the LC/HFD on the expression of other genes studied was found.
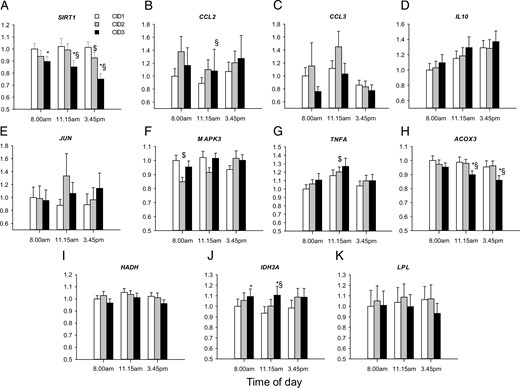
Influence of LC/HFD on the expression of nonoscillating metabolic and inflammatory genes in monocytes.
Expression levels of SIRT1 (A), CCL2 (B), CCL3 (C), IL10 (D), JUN (E), MAPK3 (F), TNFA (G), ACOX3 (H), HADH (I), IDH3A (J), and LPL (K) were measured at 3 time points of 3 CIDs by qRT-PCR, normalized to the geometric means of PPIB, B2M, and HPRT and are displayed as fold change relative to the morning level at CID1 (n = 29). *, P < .05 for CID3 vs CID1; $, P < .05 for CID2 vs CID1; §, P < .05 for CID3 vs CID2 by the Wilcoxon test. Data are presented as means ± SE.
Associations of circadian markers with biochemical parameters and expression of inflammatory and metabolic genes
Analysis of the interrelationships between central and peripheral circadian markers revealed that clock gene expression levels in monocytes strongly correlated with each other at all CIDs but not with cortisol levels (Supplemental Table 5). Because the clock gene machinery coordinates numerous metabolic processes (1), we further analyzed the correlations between expression levels of circadian markers and biochemical parameters of fat metabolism. Significant correlations of CRY2 and TEF expression with total cholesterol, CRY2, PER1, and PER3 with LDL levels, and CRY2, DBP, PER1, and TEF with triglyceride levels were detected (Supplemental Table 6). Clock genes CLOCK, CRY1, DBP, and PER1 correlated with serum TNFα levels, but not with C-reactive protein or serum IL-6. For cortisol, only correlations of the morning level with NEFA and serum TNFα at CID3 were found (Supplemental Table 6). Notably, we observed only minor correlation links of clock gene expression with anthropometric and biochemical parameters, which became nonsignificant after correction for multiple testing (Supplemental Table 6). In contrast, clock genes demonstrated a large number of correlations with numerous metabolic and inflammatory genes, especially correlations of CLOCK, CRY1/2, DBP, NR1D1, PER3, and TEF with cytokines and genes of fat oxidation (IDH3A and CPT1A) (Supplemental Table 7). Notably, cortisol levels negatively correlated with expression of a range of inflammatory genes and positively with IDH3A and LPL expression (Supplemental Table 7).
To provide a “system” view of the observed interconnections, we built a network representing links between central and peripheral clock markers, fat metabolism, and inflammation genes and corresponding blood parameters (cholesterol, triglyceride, NEFA, serum TNFα, and serum IL-6) at CID1, 8:00 am (Figure 3). In this network, nodes with the most connections were clock genes PER3, TEF, CRY1, and DBP and fat metabolism genes CPT1A and IDH3A (Figure 3). A lower number of links was found for blood parameters, and cortisol showed only 2 correlations (Figure 3). For other CIDs and time points, similar results were obtained (data not shown).
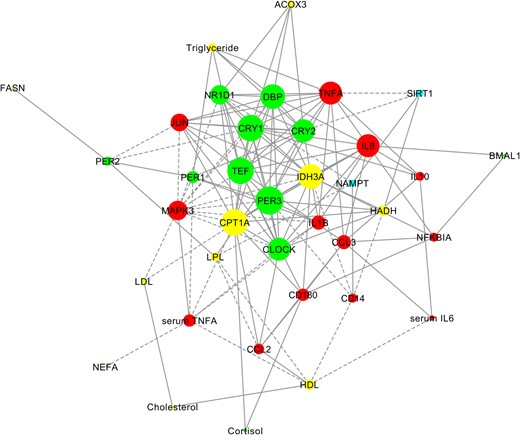
Involvement of clock genes in the regulation of inflammation and fat metabolism in humans.
A gene-phenotype network was constructed for parameters found to have a significant correlation at CID1, 8:00 am (P < .05, noncorrected Spearman correlation test). Node size reflects the number of direct connections a parameter has within a network. Clock genes and salivary cortisol are shown in green, fat metabolism genes and serum lipids in yellow, inflammation genes and serum proinflammatory cytokines in red, and genes relating to energy metabolism in blue. Positive correlations are shown with continued lines; negative correlations are shown with broken lines.
In addition, we performed correlation analysis of the LC/HFD-induced changes of circadian markers. Interestingly, changes of cortisol levels correlated with LDL changes but not with alterations of clock gene expression in monocytes (Table 3). PER1 expression changes correlated with total and LDL cholesterol changes and PER2 expression changes with NEFA alterations (Table 3). As expected, the LC/HFD-induced changes within the clock machinery (PER1, PER2, PER3, and TEF) tightly correlated with each other. Moreover, we found a range of correlation links for TEF changes with NFKBIA and ACOX3 changes (Table 3). Because of the low number of interconnections for each time point, the network visualization of the LC/HFD-induced changes was not meaningful.
Correlation Analysis of LC/HFD-Induced Changes of Gene Expression and Biochemical Parameters
| Gene | CID | Time | Total Cholesterol | HDL Cholesterol | LDL Cholesterol | NEFA | PER1 | PER2 | PER3 | TEF | SIRT1 | CD14 | CD180 | NFKBIA | CCL3 | ACOX3 | IDH3A |
|---|---|---|---|---|---|---|---|---|---|---|---|---|---|---|---|---|---|
| Cortisol | CID2/CID1 | 8:00 am | 0.381a | ||||||||||||||
| 11:15 am | |||||||||||||||||
| 3:45 pm | |||||||||||||||||
| CID3/CID1 | 8:00 am | ||||||||||||||||
| 11:15 am | |||||||||||||||||
| 3:45 pm | |||||||||||||||||
| PER1 | CID2/CID1 | 8:00 am | −0.369a | −0.380a | |||||||||||||
| 11:15 am | 0.393a | 0.374a | 0.412a | ||||||||||||||
| 3:45 pm | |||||||||||||||||
| CID3/CID1 | 8:00 am | −0.456a | |||||||||||||||
| 11:15 am | 0.512b | 0.538b | 0.432a | ||||||||||||||
| 3:45 pm | 0.573b | 0.568b | 0.429a | ||||||||||||||
| PER2 | CID2/CID1 | 8:00 am | |||||||||||||||
| 11:15 am | 0.475b | 0.455a | |||||||||||||||
| 3:45 pm | |||||||||||||||||
| CID3/CID1 | 8:00 am | 0.461a | 0.601b | ||||||||||||||
| 11:15 am | 0.512b | 0.636b | 0.479b | ||||||||||||||
| 3:45 pm | 0.573b | 0.765b | |||||||||||||||
| PER3 | CID2/CID1 | 8:00 am | 0.397a | ||||||||||||||
| 11:15 am | 0.393a | 0.474b | 0.441a | ||||||||||||||
| 3:45 pm | |||||||||||||||||
| CID3/CID1 | 8:00 am | 0.601b | 0.450a | ||||||||||||||
| 11:15 am | 0.538b | 0.636b | 0.724b | ||||||||||||||
| 3:45 pm | 0.568b | 0.765b | |||||||||||||||
| TEF | CID2/CID1 | 8:00 am | 0.410a | ||||||||||||||
| 11:15 am | 0.374a | 0.455a | 0.553b | 0.397a | 0.462a | ||||||||||||
| 3:45 pm | |||||||||||||||||
| CID3/CID1 | 8:00 am | 0.450a | 0.401a | ||||||||||||||
| 11:15 am | 0.432a | 0.479b | 0.724b | 0.438a | 0.590b | ||||||||||||
| 3:45 pm | 0.394a |
Genes and parameters demonstrating significant expression changes in response on LC/HFD are shown (Supplemental Table 2). Parameter alterations were analyzed after 1 week (CID2/CID1) and 6 weeks (CID3/CID1) in the morning after overnight fasting (biochemical parameters) or at 3 time points (gene expression). Only significant correlation links (r values) are presented. Correlations significant after false discovery rate correction are in italics.
P < .05 without correction for multiple testing.
P < 0.01 without correction for multiple testing.
Discussion
Our data showed that switching from the HC/LFD to the LC/HFD isocaloric diet affects the central and peripheral clocks in humans. We performed detailed analyses of salivary cortisol rhythm and of the gene expression in human blood monocytes as minimally invasive methods of monitoring diurnal oscillations in humans. Using the procedure of diurnal rhythm prediction by 3-time point data, we described diurnal oscillations of core clock genes and metabolic and inflammatory genes in monocytes and their response to the change of food composition.
For technical reasons, we were not able to perform 24-hour blood sampling every 3 to 4 hours as widely used for the analysis of circadian rhythms. Nevertheless, we could predict the whole diurnal rhythms based only on the 3-time point sampling, using mathematical methods. Similar approaches were used in some recently published chronobiological studies in humans (7, 20). Moreover, in this article, we also evaluated our method using bootstrapping and simulation approaches. Generally, all approaches clearly demonstrate that our method allows analysis of rhythmic parameters of clock oscillations in humans with reasonable accuracy, given a good ratio from amplitudes to noise. Our method may be a beneficial approach for studying the human circadian clock in the clinical setting when 24-hour frequent blood sampling is not possible.
However, some limitation of our method should be mentioned. First, for some genes (eg, CRY1, CRY2, and DBP), the cosinor fitting was not significant at several CIDs, possibly because of low oscillation amplitude. In this case, no values for amplitude, mesor, or acrophase could be calculated. Second, the simulation approaches showed that in cases with very weak amplitudes and high noises, stronger deviations from the simulation results to the expected values can be observed. For example, analysis of FASN and NFKBIA was not accurate for amplitude and acrophase (located in orange section of the graphs in Supplemental Figure 2B). Third, the comparison of our data with whole-blood transcriptome data (15) revealed that some genes (apparently those with high amplitudes) demonstrated comparable peak times, whereas other oscillating genes showed higher deviances. However, these deviances might also be caused by the different types of biological samples used (whole-blood samples vs monocytes).
Our 3-time point rhythm prediction method allowed us to demonstrate for the first time that the isocaloric switch to an LC/HFD affects central and peripheral diurnal rhythms in humans. Recent animal studies reported that a hypercaloric HFD affects the circadian rhythms of clock genes and metabolic genes and eating behavior (8, 10, 24). The HFD in mice acutely changed circadian rhythms in liver within some days, and this effect does not require the onset of obesity and is reversible (4, 24). In our study, diurnal oscillations of salivary cortisol and core clock genes (PER1, PER2, PER3, and TEF) in monocytes were rapidly altered by the dietary switch within 1 week of LC/HFD intervention. Cortisol rhythm showed an increase of the morning peak and amplitude and a phase delay already at 1 week after the dietary switch, apparently reflecting the acute adaptation response to the dietary changes (25). Interestingly, in monocytes, the dietary switch induced only changes of mesor and amplitude of clock genes without any shifts of peak expression. This finding suggests that the change of the food composition to the HFD may uncouple peripheral circadian oscillators from the central pacemaker in the suprachiasmatic nucleus and in this way alter the regulation of metabolic pathways in peripheral tissues. Such uncoupling was observed in studies with restricted feeding and acute systemic inflammation (9, 26). Generally, clock gene expression levels and their diet-induced changes in monocytes strongly correlated with each other but not with cortisol levels and its changes, respectively. Thus, the salivary cortisol rhythm is not tightly linked with peripheral circadian oscillations in blood monocytes, especially by metabolic challenges. This finding confirms the results of Archer et al (15) that the centrally driven hormones melatonin and cortisol have only a limited influence on the peripheral blood.
The effects of the dietary switch on core clock components, genes PERIOD and TEF, in humans confirmed their implication in the metabolic regulation described previously in mice (27). Per2−/− mice developed significant obesity when fed a hypercaloric HFD (6). PERIOD gene expression in human adipose tissue correlates with waist circumference and blood cholesterol levels (28) and with numerous metabolic genes as well as cytokine expression (3), which was confirmed in our study for human monocytes. The clock output gene Tef was recently characterized as a master regulator of seasonal metabolic changes in mammals that include alterations of fat metabolism (29). In our study, we also described diurnal oscillations of key fat metabolism genes in human monocytes. Indeed, the expression of fatty acid synthase (FASN), the key enzyme of fatty acid biosynthesis, was increased in the afternoon. In contrast, the expression of carnitine palmitoyl transferase 1 (CPT1A), the rate-limiting enzyme of mitochondrial fat oxidation, was decreased in the afternoon. This could mirror diurnal rhythms of the fat synthesis and fat oxidation, which were previously described in rodents and apparently also exist in humans (30). Many other components of lipid homeostasis are under circadian control including intestinal lipid transport, de novo lipid synthesis, and adipokine secretion (31–33). Nevertheless, we found no changes of FASN and CPT1A oscillations in response to the dietary switch. However, the dietary switch affected the expression of nonoscillating fat metabolism genes: down-regulated ACOX3 expression and up-regulated IDH3A involved in peroxisomal and mitochondrial fatty acid oxidation, respectively. Our network analysis also confirmed numerous connections of clock genes CLOCK, CRY1/2, DBP, NR1D1, PER3, and TEF with fat oxidation genes IDH3A and CPT1A. Whether this mechanism leads to the reorganization of fatty acid oxidation pathways and contributes to the NEFA decrease found in our healthy subjects after the switch to the LC/HFD needs further investigation.
In human monocytes, we also observed diurnal oscillations of genes involved in the LPS-triggered response (CD14, CD180, NFKBIA, and IL1B) described previously in murine macrophages (2). Moreover, both immune cell numbers and function such as cytokine expression, phagocytosis, and lytic activity are subjected to circadian regulation (2, 34) and are affected by circadian disruption (35). Indeed, in the correlation analysis, we found eminent interconnections of clock genes with cytokines.
Moreover, we demonstrated LC/HFD-induced alterations of diurnal oscillations of inflammatory genes. Fatty meal consumption is known to induce the postprandial low-grade inflammatory response in healthy subjects (36). Because systemic inflammation can reset the circadian clock in peripheral tissues (26, 37), this might be one possible mechanism of dysregulation of peripheral circadian rhythms. However, it is not known whether a dietary switch to a HFD primarily induces clock alterations and in this way affects metabolic and inflammatory pathways in monocytes (possibly via the change of NFKBIA expression rhythm and corresponding changes of NFKB activity) or vice versa. These mechanisms are obviously complex and pleiotropic.
Recent metabolome and transcriptome studies in mice revealed that a HFD induces a profound reorganization of metabolic pathways, including the disruption of normal circadian cycles and genesis of de novo oscillating transcripts (4). Similar effects were also observed in our study, although the loss and genesis of significant oscillation could also be explained by interindividual differences in expression rhythms and diet-induced effects. The mechanisms of this reprogramming involved the impairment of CLOCK:BMAL1 chromatin recruitment and cyclic activation of surrogate pathways through transcription factors PPARγ, SREBP-1, CREB1, and SRF (4). Previously described mechanisms of HFD effects on the circadian rhythmicity also include the fatty acid–mediated regulation of PPARα and PPARγ controlling BMAL1 and NR1D1 expression (38, 39), as well as redox state and AMP-activated protein kinase activity (22, 40).
Moreover, key enzymes of energy metabolism, NAMPT, an enzyme that provides a rate-limiting step in the NAD+ synthesis, and SIRT1, an NAD+-dependent histone deacetylase, interact with and affect the core clock mechanism (22, 23). In our study, the dietary switch triggered a decrease of the mRNA levels of both genes, and the LC/HFD-induced SIRT1 and PER3 alterations correlated significantly. Interestingly, in mice, a HFD induced a loss of NAD+ oscillation accompanied by a dampening of Nampt cyclic transcription (4). Furthermore, a recent human study also showed that the expression of SIRT1 in human peripheral blood mononuclear cells was decreased in subjects with metabolic syndrome and was down-regulated by palmitate in vitro (41).
In conclusion, we demonstrated that the dietary fat and carbohydrate content alters diurnal rhythms of central and peripheral clock and inflammatory genes in humans. Our data confirm the tight cross talk between the molecular clock and metabolic and inflammatory pathways involved in adapting energy metabolism to food composition changes. Further studies are needed to determine the exact mechanisms of the dietary switch effects and the role of clock genes in metabolic and immune adaptations to nutritional signals in humans.
Acknowledgments
We thank all study participants for their cooperation. We gratefully acknowledge the technical assistance of Andreas Wagner, Melanie Hannemann, and Anja Henkel. We also thank Dr Celine Vetter und Professor Till Roenneberg (Centre for Chronobiology of Institute of Medical Psychology of University of Munich, Munich, Germany) for the analysis of Munich Chronotype Questionnaire (MCTQ) data. We thank June Inderthal (Department of Clinical Nutrition, German Institute of Human Nutrition, Germany) for editing the manuscript.
The study was supported by the German Federal Ministry of Education and Research (BMBF Nutrigenomic Analysis in Twins 0315424 to O.P., M.K., A.B., and A.F.H.P.) and by the German Science Foundation (DFG Grant KFO218 PF164/16–1 to O.P., A.K., and A.F.H.P.).
Author contributions: O.P., A.K., and A.F.H.P. designed the research; O.P., S.H., Y.L., S.M., V.M., A.-C.S., C.M.-G., J.M., and M.K. conducted the research; O.P., K.J., N.R., K.K., M.K., A.B., and A.K. analyzed data and performed the statistical analysis; O.P., N.R., K.J., and A.F.H.P. wrote the manuscript; and O.P. had primary responsibility for the final content. All authors read and approved the final manuscript.
The study is registered at www.clinicaltrials.gov (registration number NCT01631123).
Disclosure Summary: The authors have nothing to disclose.
O.P., K.J., and N.R. contributed equally to the study.
Abbreviations
- CID
clinical investigation day
- HC/LFD
high-carbohydrate, low-fat diet
- HFD
high-fat diet
- LC/HFD
low-carbohydrate, high-fat diet
- LPS
lipopolysaccharide
- NEFA
nonesterified fatty acid
- qRT-PCR
quantitative real-time PCR
- RM ANOVA
two-way repeated-measures ANOVA.
