


Gastric emptying is a critical determinant of postprandial glycemic control in health and type 1 diabetes. There are few studies that assess the relationship between gastric emptying and postprandial glycaemia in adolescents with type 1 diabetes.
The objectives of the study were to quantify gastric emptying in adolescents with type 1 diabetes and examine its relationship to postprandial glycaemia and autonomic function.
This was a case-control study. Gastric half-emptying time of a solid meal was measured by a 13C-octanoate breath test. Cardio-autonomic function was measured by heart rate variability. Chronic and postprandial gastrointestinal symptoms were evaluated by questionnaire and visual analog scales. Blood glucose concentrations were monitored frequently during the study.
The study was conducted at a tertiary pediatric hospital in South Australia.
Thirty adolescents (aged 15 ± 2.5 y) with type 1 diabetes and age- and sex-matched controls (gastric emptying, n = 20; heart rate variability, n = 135) participated in the study.
Gastric half-emptying time was the main outcome in the study.
Gastric emptying was more rapid in subjects with type 1 diabetes than controls [median half emptying time 78 (interquartile range 61–99) vs 109 (interquartile range 71–124) min, P = .02]. The postprandial rise in blood glucose at 60 minutes was strongly related to gastric half-emptying time (R = −0.65, P = .0001). Gastric emptying was slower in subjects with fasting hyperglycemia but was not related to heart rate variability. Nausea, bloating, and anxiety were related to fasting glycemia (P = .03).
Rapid gastric emptying is a major determinant of postprandial glycemia in adolescents with type 1 diabetes. This observation has significant implications for therapy.
Optimal glycemic control is fundamental to preventing the microvascular and macrovascular complications of diabetes (1). The substantial contribution of postprandial glycemia, as opposed to fasting blood glucose, to glycated hemoglobin (HbA1c), and therefore the risk of vascular complications, is now well recognized (2, 3). We have shown in adults that gastric emptying accounts for up to 30% of postprandial glycemic variability in health and diabetes (4, 5).
Delayed gastric emptying affects 30%–50% of adults with longstanding diabetes and is weakly associated with markers of cardiovascular autonomic dysfunction (6, 7). Abnormally rapid emptying has been reported in patients with early type 2 diabetes and some patients with longstanding type 1 diabetes (8, 9). In contrast, the few studies that have assessed gastric emptying in adolescents with type 1 diabetes have shown inconsistent results with either delayed emptying (10, 11) or no difference in emptying (12).
Although gastrointestinal (GI) symptoms, particularly nausea, bloating, and early satiety, are frequently reported in adults with diabetes, they correlate poorly with the rate of gastric emptying and do not reliably predict abnormal gastric emptying (5, 7, 8). Symptom assessment has usually focused on chronic symptoms, rather than evaluating meal-related symptoms at the same time as the assessment of gastric emptying. Glycemia potentially plays a role in symptom perception; patients with blood glucose levels greater than 11 mmol/L have an increased perception of GI symptoms, when compared with euglycemia (13). Gastrointestinal symptoms are often overlooked in children with type 1 diabetes and their prevalence and relationship to gastric emptying and glycemia poorly defined (14, 15).
Abnormal autonomic function is implicated in the pathogenesis of delayed gastric emptying in adults with long-standing diabetes (5, 7). We and others have detected abnormalities of heart rate variability (HRV), a measure of cardiovascular autonomic function, in adolescents with type 1 diabetes (16, 17), but the relationship with gastric emptying is unknown.
We therefore aimed to measure gastric emptying, postprandial blood glucose, gastrointestinal (GI) symptoms, and autonomic function in adolescents with type 1 diabetes. We hypothesized that, as in adults, gastric emptying would be slower than in healthy controls and would relate to postprandial glycemia, GI symptoms and autonomic dysfunction.
Research Design and Methods
Subjects
Thirty patients aged 10–18 years were recruited consecutively from the type 1 diabetes clinics at the Women's and Children's Hospital, which cares for more than 85% of children with type 1 diabetes in South Australia. Patients with a history of GI surgery, celiac disease, or medications that affect GI motility (including erythromycin) were excluded. Of 147 patients assessed, 99 did not meet the inclusion criteria, 17 declined, and one withdrew. Twenty age- and sex-matched friends or siblings of the patients were recruited as healthy controls. Additional control data for HRV was obtained from community high school students (n = 115).
In the week prior to the study, none of the type 1 patients had experienced ketosis (blood ketones > 0.5 mmol/L). One patient was on T4 replacement and had been biochemically euthyroid for more than 6 months, whereas another had early background retinopathy. None of the remaining type 1 patients had any evidence of complications of diabetes. The protocol was approved by the Human Research Ethics Committee of the Women's and Children's Hospital. Written informed consent was obtained from participants and parents.
Protocol
Studies commenced at 8:00 am after fasting from 9:00 pm. Patients administered their usual ultrashort acting insulin, according to their prescribed units of insulin per gram of carbohydrate and insulin sensitivity factor, before the standardized test meal (t = −15 min) and then consumed the meal, consisting of 70 g pancake mix (Green's), 50 mL water, and 100 mg 13C Na-octanoate, cooked with 10 g butter (8.8 g fat, 30.3 g carbohydrate, 142.7 kcal), within 5 minutes.
Breath and blood samples were collected at t = −25, −15, 15, 30, 45, 60, 75, 90, 105, 120, 150, 180, 210, and 240 minutes, and blood glucose concentrations were measured by a glucose oxidase analyzer (YSI).
Validated visual analog questionnaires were administered at t = −25, 30, 60, 120, 180 and 240 minutes to assess anxiety, meal-related nausea and bloating, and postprandial fullness (18). Chronic symptoms during the preceding 3 months, including abdominal pain, nausea and vomiting, bloating, gastroesophageal reflux, dysphagia, diarrhea, and constipation, were assessed by the modified Diabetes Bowel Symptom Questionnaire (19). Breath samples were analyzed for 13CO2 using an isotope ratio mass spectrometer (Europa Scientific; ABCA 20/20), and 13CO2 excretion was analyzed using a nonlinear regression model to calculate the gastric half-emptying time (20).
An electrocardiogram was recorded from t = 210 to 220 minutes (LabChart Pro; AD Instruments) from which HRV was calculated, as described (21). Recordings were performed in a quiet room with the subject supine with no caffeine consumed in the 12 hours prior. The whole 10 minute recording was analyzed, excluding ectopic beats (<500 msec, >1100 msec). R-waves were marked after visual scanning by one investigator (S.J.P.). Derived time domain measures include SD of mean NN intervals (where NN is determined from adjacent QRS complexes) and root mean squared difference of successive NN intervals, which are estimates of overall HRV. Frequency domain measures included the following: low-frequency (LF) components, defined as greater than 0.04 Hz and less than 0.15 Hz, and high-frequency (HF) components, defined as greater than 0.15 Hz and less than 0.4 Hz and the LF to HF ratio, considered an estimate of the relative sympathetic and parasympathetic balance (16). Overall HRV was expressed as the triangular index (total number of NN intervals per number of NN intervals in the modal bin, in which the modal bin is the most commonly occurring NN interval determined by histogram plot) (17).
Statistical analysis
We calculated that 27 patients and 27 controls would provide 80% power (P < .05) to detect a 24-minute difference (SEM 15.4) in mean gastric half-emptying time. Statistical analyses were performed with STATA 13 software (StataCorp).
Mean and SEs (normally distributed variables) and median and interquartile ranges (for nonnormally distributed variables) were reported. Independent-samples t tests were used for comparisons of normally distributed continuous variables and Mann-Whitney U tests for comparisons of variables with skewed distributions. χ2 tests of association were used to compare cases and controls for categorical variables. Pearson correlation coefficients were used to assess relationships between the different measures. Multiple linear regression was used to analyze relationships between gastric half-emptying time, GI symptoms, and postprandial change in blood glucose. Values of P < .05 were taken as significant.
Results
Other than diabetes variables, the groups were well matched (Table 1). All subjects tolerated the protocol, with no episodes of hypoglycemia requiring treatment.
Characteristics of Type 1 Diabetes Patients and Controls
| Type 1 Diabetes (n = 30) | Controls for Gastric Emptying (n = 20) | P Valuea | Controls for HRV (n = 135) | P Valueb | |
|---|---|---|---|---|---|
| Male, n, % | 14 (47) | 10 (50) | .33 | 78 (53) | .26 |
| Age, y | 15.1 ± 2.5 | 14.0 ± 3.5 | .22 | 15.5 ± 2.6 | .48 |
| Height z-score | 0.5 ± 1.2 | 0.7 ± 2.5 | .72 | 0.29 ± 1.4 | .50 |
| Weight z-score | 0.7 ± 0.9 | 0.5 ± 0.9 | .66 | 0.25 ± 1.0 | .04 |
| BMI z-score | 0.6 ± 0.7 | 0.6 ± 0.9 | .99 | 0.20 ± 1.0 | .04 |
| Pubertal/postpubertal, n, % | 21 (30) | 11 (55) | .82 | ||
| Insulin pump, n, % | 17 (57) | ||||
| Diabetes duration, y | 8.0 ± 4.6 | ||||
| HbA1c (12 mo mean), %, mmol/mol | 8.7 ± 1.0 (72 ± 5.0) | ||||
| Insulin dose, U/kg · d | 0.78 ± 0.18 | ||||
| Fasting blood glucose, mmol/L | 12.8 ± 5.1 | 4.6 ± 0.4 | <.001 | ||
| Change in blood glucose0–60 min, mmol/L | 3.1 ± 3.9 | 0.7 ± 0.7 | <.001 | ||
| Peak blood glucose, mmol/L | 17.2 ± 3.7 | 6.5 ± 1.0 | <.001 | ||
| Fasting nausea/bloating, n, % | 10 (33) | 6 (40) | .66 | ||
| Postprandial nausea/bloating, n, % | 14 (47) | 8 (53) | .67 | ||
| Fullness t = 30 min, n, % | 17 (57) | 8 (53) | .83 | ||
| Anxiety, n, % | 11 (37) | 7 (47) | .52 | ||
| Two or more chronic symptoms, n, % | 5 (42) | 4 (50) | .40 | ||
| Severe chronic symptoms, n, % | 8 (67) | 6 (75) | .67 | ||
| Heart rate, bpmc | 67 (60–74) | 67 (60–76) | .07 | ||
| SDNNc | 71 (52–87) | 78 (55–104) | .27 | ||
| RMSSDc | 68 (43–105) | 76 (46–116) | .67 | ||
| LF power, msec2c | 1042 (624–1982) | 1507 (723–2623) | .14 | ||
| HF power, msec2c | 1747 (510–4012) | 1867 (912–4056) | .81 | ||
| LF to HF ratioc | 0.7 (0.4–1.1) | 1.2 (0.8–1.2) | .12 | ||
| Triangular indexc | 16 (12–19) | 17 (14–22) | .23 |
Abbreviations: RMSSD, root mean squared difference of successive NN intervals; SDNN, SD of mean NN interval. Data are mean ± SD.
Gastric emptying controls compared with type 1 diabetes patients.
HRV controls compared with type 1 diabetes patients.
Data are median (IQR).
Gastric emptying
Gastric emptying, although within the control range, was more rapid in the type 1 diabetes patients [median half emptying time 78; interquartile range (IQR) 61–99] than controls (median 109; IQR 71–124 min, P = .02) (Figure 1), and the difference remained significant when controls with chronic GI symptoms were excluded, and when controlling for fasting glucose. Gastric half-emptying time in those with type 1 diabetes did not relate to HRV and was independent of age, gender, body mass index (BMI) z-score, HbA1c, duration of diabetes, and total daily insulin dose.
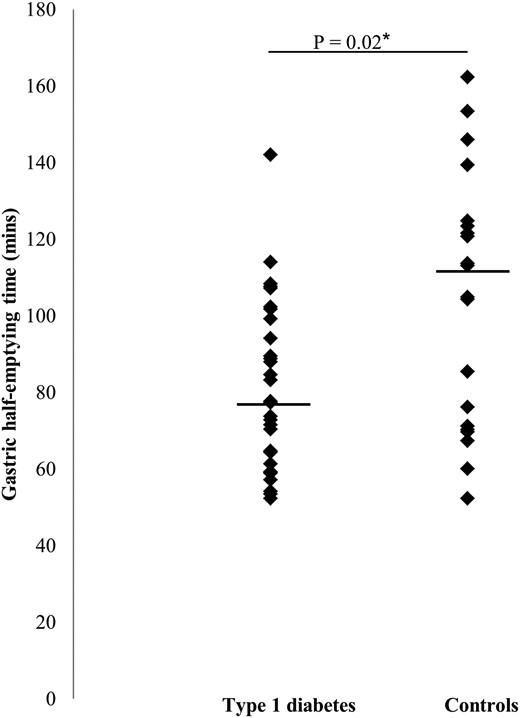
Gastric half-emptying time (horizontal line indicates median) in type 1 diabetes (n = 30) and controls (n = 20).
Blood glucose concentrations
Fasting and peak postprandial blood glucose concentrations were higher in type 1 patients than controls (both P < .05). The postprandial blood glucose increment (t = 0–60 min) in type 1 patients was inversely related to the gastric half-emptying time (r = −0.65, P = .0001) (Figure 2). Patients with fasting blood glucose levels above the median (14 mmol/L) had slower gastric emptying than the remainder (half emptying time 90; IQR 57–85 vs 73; IQR 72–107 min, P = .04). There was no relationship between gastric emptying and postprandial glycaemia in controls.
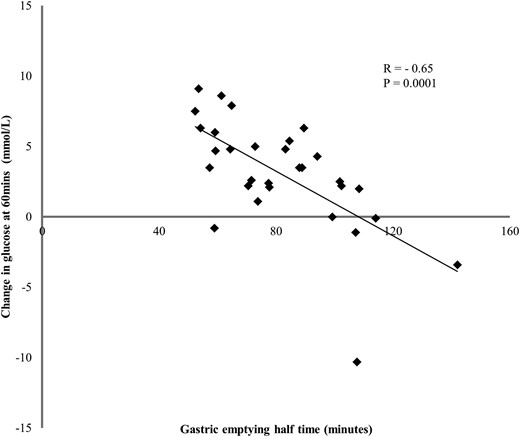
Relationship between change in postprandial glucose at 60 minutes postprandial, and the gastric half-emptying time in patients with type 1 diabetes (r = −0.65, P = .0001).
Gastrointestinal symptoms
There was no difference between type 1 patients and controls in the prevalence of the following: 1) nausea, bloating, or anxiety before or after the meal; 2) postprandial fullness; or 3) chronic GI symptoms.
Blood glucose and GI symptoms
In type 1 diabetes, fasting nausea and bloating and anxiety were related to fasting blood glucose (regression coefficient = 4.29, P = .03, and regression coefficient = 4.30, P = .03, respectively), but no symptom was related to gastric emptying after adjusting for blood glucose concentrations.
Conclusion
We have shown, in contrast to our hypothesis based primarily on observations in adults, that adolescents with type 1 diabetes, as a group, although with in the control range, have more rapid gastric emptying than healthy controls. Moreover, rapid gastric emptying in these patients is clearly associated with a greater postprandial rise in blood glucose. Conversely, fasting hyperglycemia is associated with slower gastric emptying and an increase in upper GI symptoms, as has been reported in adults (6, 22).
This study is the first to report rapid gastric emptying in adolescents with type 1 diabetes. The limited number of previous studies in adolescents describe either delayed (10, 11) or normal emptying (12). These differences may be attributed to variations in test meals and diagnostic methods or a failure to account for the effects of glycemia on gastric emptying. The 13C breath test has been validated against the gold standard technique, scintigraphy, in healthy adults (23) and adolescents (24) as well as in adults with diabetes (25). It is acceptable as an alternative measure of gastric emptying in a pediatric group because it is a noninvasive test with no associated radiation exposure. Gastric emptying involves the complex coordination of multiple variables. In this cohort, more rapid gastric emptying was independent of variables previously implicated in abnormal gastric emptying, including autonomic function, glycemic control, gender, age, HbA1c, BMI, and duration of diabetes. Although the mechanism for rapid gastric emptying is likely to be due to more than one pathological process, a potential explanation is amylin deficiency. Amylin is a pancreatic hormone cosecreted with insulin, which plays an important role in slowing gastric emptying; therefore, those with type 1 diabetes who are amylin deficient but have normal autonomic function would have rapid gastric emptying (26).
HRV did not differ between patients and controls, and GI autonomic dysfunction was not related to the rapid emptying. In a recent study of 125 adolescent girls with type 1 diabetes, HRV was reduced, and resting heart rate was higher, when compared with controls (21). We hypothesized in our previous study that the difference may be due to the higher BMI in those with type 1 diabetes because obesity is associated with sympathetic overdrive; however, there was a similar difference in BMI between type 1 diabetes and the control group in this study, and no difference in HRV was detected (27). The contrast in rates of gastric emptying between adolescents and adults with type 1 diabetes may be related to the different duration of disease. It is also possible that the prevalence of gastroparesis in adults is now less than reported in older studies due to improved glycemic control and a decrease in the prevalence of autonomic neuropathy. Longitudinal studies exploring the natural history of gastric emptying in type 1 diabetes are recognized as a significant knowledge gap (28).
The relationship between gastric emptying and glycemia is complex and reciprocal. The increase in blood glucose during the first hour after the meal in association with rapid gastric emptying occurred despite injection of ultrashort acting insulin 20 minutes before meal ingestion. This timing of insulin delivery is recommended, although in our experience, adolescents often administer their insulin immediately before eating, which may further exacerbate early postprandial hyperglycemia. Because the rate of gastric emptying is a key determinant of the absorption of nutrients in the small intestine, it appears likely that rapid emptying resulted in the large postprandial glycemic change and not vice versa. Conversely, patients with a greater degree of fasting hyperglycemia had slower gastric emptying, which is consistent with the adult literature (29), and suggests that gastric emptying would have been even faster if studied during euglycemia. Interestingly, GI symptoms related to fasting but not to postprandial glycaemia.
Strategies to reduce postprandial glycemia include earlier administration of short-acting insulin and/or an increased dose; however, the former may be difficult for adolescents to implement and the latter increases the risk of hypoglycemia. The strong relationship between preprandial hyperglycemia and delayed gastric emptying may be relevant, in particular to those on continuous subcutaneous insulin therapy, where there are different options for bolus duration, thereby allowing better matching of insulin delivery to the rate of gastric emptying and corresponding rise in blood glucose. Dietary modifications, including the addition of fiber to meals, or the consumption of preloads, such as whey in advance of the meal, slow gastric emptying and improve postprandial glycemia in patients with type 2 diabetes (30, 31). Pharmacological therapies that specifically target postprandial hyperglycemia by slowing gastric emptying include the short-acting (prandial) glucagon-like peptide-1 receptor agonists, such as exenatide, and the amylin analog, pramlinitide (32, 33). Neither is associated with an increase in the frequency of hypoglycemia (32). Limitations include small control numbers for gastric emptying; however, the observed difference in the rate of gastric emptying was greater than the predicted difference. The 13C breath test was used to assess gastric emptying, not scintigraphy, because it is the ethically acceptable test to use in a pediatric population. The 13C breath test correlates well with scintigraphy in adults with diabetes and in healthy children (24, 25).
Our results suggest that therapies that modify the rate of gastric emptying may be of particular benefit in optimizing postprandial glycemia in adolescents with type 1 diabetes and should be investigated further.
Acknowledgments
Use of the Diabetes Bowel Symptom Questionnaire was approved by Professor Nicholas Talley (University of Newcastle). Betty Zacharakis (Women's and Children's Hospital, South Australia) assisted with sample processing, and Tracey Jopling and Yoon-Hi Cho (The Children's Hospital Westmead, New South Wales, Australia) assisted with heart rate variability analysis and interpretation. We thank the participants and their families.
This trial was registered with the Australian New Zealand Clinical Trials Registry with the number ACTRN12612000619842. Full trial protocol can be accessed at https://www.anzctr.org.au.
Author contributions include the following: S.J.P. had full access to all of the data in the study and takes responsibility for the integrity of the data and the accuracy of the data analysis. S.J.P. also contributed to the conception and design of the study, the patient and data acquisition, and the analysis and interpretation of the data and drafted the article. C.K.R. contributed to the conception and design of the study and the analysis and interpretation of the data and provided the revision to the manuscript. S.K. contributed to the study design and the analysis interpretation of the data, and provided the revision to the manuscript. M.H. contributed to the conception and design of the study and the analysis and interpretation of the data and provided the revision to the manuscript. K.D. contributed to the study design, the patient and data acquisition, and the analysis and interpretation of the data and provided the revision to the manuscript. C.M.-K. and L.G. contributed to the statistical analysis and the interpretation of the data and provided the revision to the manuscript. J.J.C. contributed to the conception and design of the study and the analysis and interpretation of the data and provided the revision to the manuscript.
This work was supported by a McLeod Foundation fellowship, South Australia (to S.J.P.) and an Australian Pediatric Endocrine Care grant from Pfizer Pharmaceuticals, who had no input into the study.
Disclosure Summary: C.K.R. has received funding from Merck, Eli Lilly, and Novartis. M.H. has participated in the advisory boards and/or symposia for Novo Nordisk, Sanofi, Novartis, Eli Lilly, Merck Sharp & Dohme, Boehringer Ingelheim Satiogen, and AstraZeneca/BMS and has received honoraria for this activity. J.J.C. has participated in research grant review panels for Pfizer and received honoraria for this activity. The other authors have nothing to declare.
Abbreviations
- BMI
body mass index
- GI
gastrointestinal
- HbA1c
glycated hemoglobin
- HF
high frequency
- HRV
heart rate variability
- IQR
interquartile range
- LF
low frequency.
