


The physiological origins of age-related changes in hormone production during the menstrual cycle are uncertain.
The objective of the study was to test the hypothesis that changes in antral follicle dynamics are associated with changes in hormone production as women age.
A prospective, observational study was conducted in ovulatory women of midreproductive age (MRA; 18–35 y; n = 10) and advanced reproductive age (ARA; 45–55 y; n = 20). The numbers and diameters of all follicles of 2 mm or greater were quantified ultrasonographically every 1–3 days for one interovulatory interval; the growth profiles of individually identified follicles of 4 mm or greater were tabulated. Blood samples were assayed for FSH, LH, estradiol, progesterone, inhibin A and B, and anti-Mullerian hormone.
Fifty percent of women in both the MRA and ARA groups developed one to two luteal-phase dominant follicles (LPDFs). MRA women with typical LPDFs had greater luteal-phase inhibin B (44.2 vs 17.0 ng/L) and estradiol (91.3 vs 51.7 ng/L) compared with those without LPDFs (P < .05). Luteal-phase estradiol was greater (184 vs 79 ng/L), inhibin B was greater (25.3 vs 12.7 ng/L), and progesterone was lower (6.98 vs 13.8 μg/L) in ARA women with atypical vs no LPDFs (P < .01).
Changes in antral follicle dynamics are associated with changes in hormone production as women age. The development of LPDFs in women of MRA was associated with elevated luteal-phase estradiol. A similar but exaggerated elevation in late luteal-early follicular-phase estradiol, accompanied by lower progesterone, was observed in ARA women with atypically large and persistent LPDFs.
Changes in menstrual cyclicity are associated with modifications in the interactions between ovarian follicle development and hormone production as women age (1). It is well documented that aging is associated with a marked decline in ovarian reserve and a resultant decrease in ovarian hormone production (2, 3). A decrease in anti-Mullerian hormone (AMH) and inhibin B leads to a loss of negative feedback and a resultant rise in FSH (4, 5). Furthermore, there is a greater tendency for polyovulation as women age (6). We recently documented that luteal-phase dominant follicles (LPDFs) developed in 30%–50% of women; the prevalence of LPDFs did not change with age (7). We observed that LPDFs in older women often emerged earlier relative to ovulation and grew for a longer period and to a larger diameter compared with younger women (7). Both ovulatory and anovulatory LPDFs developed. These novel findings indicate that antral folliculogenesis changes as women age. The endocrinological associations and the clinical implications of the age-related variability in follicle dynamics, however, are not known.
Hale et al (4) reported that 37% of ovulatory cycles from women of advanced reproductive age exhibited a second rise in estradiol during the mid-late luteal phase, which continued into the subsequent follicular phase. Compared with the typical ovulatory cycles, cycles in the older women exhibited lower luteal-phase progesterone, greater follicular phase FSH, and lower follicular-phase inhibin B. These cycles were abnormally short or long. The hormonal pattern in women of advanced reproductive age was referred to as a luteal out-of-phase (LOOP) event. It was suggested that a causal relationship may exist between the presence of a LPDF (7, 8) and an atypical rise in luteal phase estradiol (4) in women of advanced reproductive age. Direct relationships between age-related changes in antral follicle dynamics and hormone production have not been reported. The objective of the present study was to test the hypothesis that age-related changes in antral follicle dynamics are associated with changes in hormone secretion as women age.
Materials and Methods
A prospective, observational study was conducted from 2006 through 2011. The study protocol was approved by the Biomedical Research Ethics Board at the University of Saskatchewan and the Strategic Priorities and Planning Committee of the Saskatoon Health Region. Study procedures were conducted in accordance with the Tri-Council Policy Statement on the Ethical Conduct for Research Involving Humans.
Study sample
Thirty-one healthy ovulatory participants were recruited as part of an ongoing study (7). Data from 5 of 31 women were excluded for the following reasons: failure to complete the study (n = 1), anovulatory cycles (n = 2), and the development of lag phases of follicle development (n = 2). A lag phase was defined as a period of no follicle development of 6 mm or greater for more than 20 days from menses or ovulation (ie, based on 2 SD above the mean follicular and luteal phase length). Data from the remaining 26 participants were analyzed. Women were divided into the following age categories: 1) midreproductive age (MRA; 18–35 y, n = 10), and 2) advanced reproductive age (ARA; 45–55 y, n = 16). MRA women were eligible if they had a history of regular menstrual cycles (ie, 21–45 d long). ARA women were eligible if they had 12 months or less of amenorrhea. Inclusion criteria were as follow: a normal complete blood count, TSH, and prolactin; and nondetectable β-human chorionic gonadotropin. Exclusion criteria included the following: use of any hormone therapy within 3 months of study participation, smoking, documented ovarian failure, infertility of unexplained or female origin, medical conditions known or suspected to interfere with reproductive function, presence of only one ovary, ovaries that could not be visualized ultrasonographically, use of medications known or suspected to interfere with reproductive function, pregnancy or lactation, and/or participation in another investigational trial within 30 days of study participation. Consent was obtained from all participants. Diary cards were completed to record adverse events and medications taken during the study.
Study procedures
Serial transvaginal ultrasonography was conducted to evaluate follicular growth of 2 mm or greater (7). Scans were initiated on days 8–15 after menses and continued every Monday, Wednesday, and Friday for one complete interovulatory interval (IOI). An IOI was defined as the interval from one ovulation to the subsequent ovulation (ie, luteal phase followed by follicular phase) (8, 9). When a dominant follicle reached 14–16 mm, scans were performed daily to determine follicle fate. The growth and regression profiles of individually identified follicles that developed to diameters of 4 mm or greater were characterized after the retrospective review of cineloops. Ovulation was defined as the disappearance of a dominant follicle and the subsequent visualization of a corpus luteum (CL), followed by a rise in serum progesterone of 5.0 ng/mL or greater (4, 10). Anovulation was defined as a dominant follicle that failed to ovulate and serum progesterone less than 5.0 ng/mL. Major waves were defined as a progressive increase and a subsequent decrease in the antral follicle count (AFC) of 6 mm or greater, which occurred in association with the selection of one or more dominant follicles. An LPDF was defined as a follicle that grew to a diameter of 10 mm or greater in the luteal phase and exceeded all other follicles in the wave by 2 mm or greater. Typical LPDFs did not exceed the diameter of a normal preovulatory follicle. Atypical LPDFs were those that developed to a diameter exceeding that of a normal preovulatory follicle (≥26 mm) (11, 12). The AFC across the IOI was reported for the following diameter categories: 2–5 mm, 2–9 mm, 2–10 mm, 4 mm or greater, 5 mm or greater, and 6 mm or greater.
Five milliliters of blood were drawn at each study visit. Blood was allowed to sit at room temperature for 30–60 minutes before centrifugation at 2500 rpm for 20 minutes. Serum was isolated and stored at −50C.
Hormone assays
Blood samples were assayed at the Prairie Diagnostics Services Laboratory, University of Saskatchewan. The immunoassays used were obtained as follows: FSH and LH (Immulite; Siemens Healthcare Diagnostics Ltd), 17β-Estradiol and progesterone (Count-A-Coat; Siemens Healthcare Diagnostics Inc), inhibin A, inhibin B, and AMH (Gen II assay; Beckman Coulter Inc). FSH and LH assays were performed in singlicate. The inhibin A, inhibin B, 17β-estradiol, progesterone, and AMH assays were performed in duplicate. Inter- and intraassay coefficients of variation and sensitivity were as follows: inhibin A (7.8%, 5.5%, 5 ng/L); inhibin B (7.34%, 5.7%, 2.6 ng/L); AMH (10.5%, 5.7%, 0.08 μg/L); progesterone (15.2%, 13.0%, 0.02 μg/L); estradiol (12.9%, 9.9%, 1.4 ng/L); FSH (6.7%, 0.1 IU/L); and LH (3.4%, 0.1 IU/L).
Statistical analyses
Follicle and hormone data were centralized to the day of the first ovulation and assessed in the following ways: 1) averaged across the IOI, luteal, and follicular phases, respectively; 2) averaged into 2-day windows across the IOI, luteal, and follicular phases; and 3) averaged into 3-day windows across the IOI, luteal, and follicular phases. Data averaged into 2-day windows were determined to be the most appropriate representation of the raw data and were therefore analyzed. Endocrine and follicle data were log transformed prior to analysis, if not normally distributed.
Mean hormone concentrations and AFC over the IOI, luteal phase, and follicular phase were compared between the MRA vs ARA women using independent-sample Student's t tests. Mean hormone concentrations and AFC across the luteal phase, the follicular phase, and IOI were compared among the women with no LPDFs, typical LPDFs, and atypical LPDFs using an ANOVA.
Repeated-measures ANOVAs with mixed-effects models were conducted to determine the effects of age, day, LPDF, and day × LPDF interaction across the luteal phase, follicular phase, and IOI. Mixed-effects models were fitted to determine whether changes in follicle and hormone end points occurred in a linear, quadratic, or cubic pattern. Significant main factors and interactions were determined and presented for each end point. In the model, day effect refers to a change in outcome over time. An LPDF effect refers to a difference in mean outcome between women with no vs typical vs atypical LPDFs. A day by LPDF interaction effect indicates differences in outcome patterns over time between the LPDF groups. All statistical analyses were conducted with α = .05 (SAS version 9.4, 2013; SAS Institute).
Results
Patient demographics
Participant demographics, cycle characteristics, and mean AFC were compared between the MRA and ARA groups; data were further subdivided into cycles with or without the development of a LPDF (Table 1). No differences in body mass index, IOI length, follicular-phase length, or luteal-phase length were detected between the MRA and ARA groups. The prevalence of LPDFs between age groups was similar, with 50% of women developing a LPDF irrespective of age (P > .05). In the MRA group, women with LPDFs exhibited a 2-fold increase in mean AFC of 6 mm or greater over the IOI compared with the women who did not develop a LPDF (Table 1 and Figure 1A). In the ARA group, women with atypical LPDFs had a 1.8-fold increase in AFC of 6 mm or greater compared with the women with typical LPDFs (Table 1 and Figure 1B).
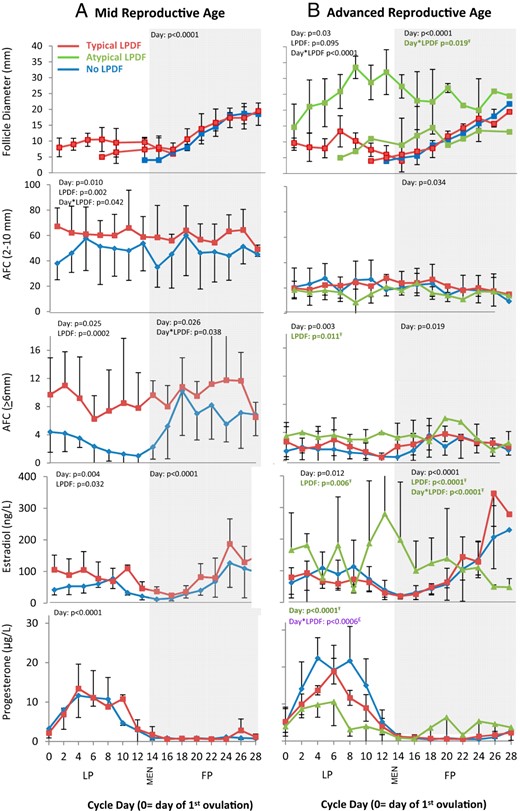
Mean diameter of the dominant follicle, AFC, serum estradiol, and serum progesterone profiles over the interovulatory interval in women of MRA (A) and ARA (B).
Data are binned into 2-day intervals and centralized to the day of the first ovulation. Data are represented as mean ± SD. FP, follicular phase; LP, luteal phase; MEN, first day of menses. Ŧ, Differences detected between ARA women with atypical vs no LPDFs (green); £, differences detected between ARA women with atypical vs typical or no LPDFs (purple); €, differences detected between ARA women with typical vs no LPDFs (red).
Participant Demographics and Cycle Characteristics Compared Between Age Groups in Women With and Without a LPDF
| LPDF | n | Age, y | BMI, kg/m2 | IOI, d | FP Length, d | LP Length, d | AFC >6 mm | AFC 2–10 mm |
|---|---|---|---|---|---|---|---|---|
| MRA | ||||||||
| No LPDF | 5 | 26.2 ± 5.17 | 29.9 ± 3.94a | 29.0 ± 3.81 | 14.8 ± 3.27 | 14.2 ± 0.84 | 5.38 ± 2.00c | 46.4 ± 20.4 |
| LPDF | 5 | 27.8 ± 7.70 | 25.1 ± 2.30b | 27.0 ± 3.10 | 14.4 ± 1.50 | 12.6 ± 3.90 | 10.6 ± 3.20d | 60.0 ± 14.0 |
| All | 10 | 27.0 ± 6.22e | 27.5 ± 3.96 | 28.0 ± 3.43 | 14.6 ± 2.41 | 13.4 ± 2.80 | 8.00 ± 3.74e | 53.2 ± 18.0e |
| ARA | ||||||||
| No LPDF | 8 | 47.0 ± 2.02 | 26.5 ± 4.87 | 27.4 ± 1.92 | 12.9 ± 1.13 | 14.5 ± 1.51 | 2.25 ± 1.28 | 22.1 ± 12.2 |
| Typical LPDF | 4 | 47.8 ± 1.71 | 25.8 ± 2.01 | 27.3 ± 1.89 | 13.3 ± 1.26 | 14.0 ± 0.82 | 1.98 ± 0.38a | 18.7 ± 6.89 |
| Atypical LPDF | 4 | 49.5 ± 0.58 | 23.6 ± 2.30 | 26.0 ± 10.7 | 13.0 ± 8.60 | 12.8 ± 2.36 | 3.50 ± 0.94b | 16.5 ± 3.85 |
| All LPDFs | 8 | 48.6 ± 1.51 | 24.7 ± 2.30 | 26.6 ± 7.13 | 13.1 ± 5.69 | 13.4 ± 1.77 | 2.76 ± 1.06 | 17.6 ± 5.29 |
| All | 16 | 47.8 ±1.94e | 25.6 ± 3.80 | 27.0 ± 5.06 | 13.0 ± 3.97 | 13.9 ± 1.69 | 2.50 ±1.17e | 19.8 ±9.37e |
Abbreviation: BMI, body mass index; FP, follicular phase; LP, luteal phase. Data are shown as mean ± SD. Differences in each column were assessed by a t test after log transformation. The AFC represents the sum of follicles from both ovaries.
Within each age group: a vs b = P < .05; c vs d = P < .01 (bold).
P < 0.001 between age groups.
Follicle growth, AFC, and hormone concentrations across the IOI
Mean changes in follicle diameter, AFC, and hormone concentrations were tabulated across the IOI in women of MRA vs ARA (Figures 1 and 2). Mean data for each age group were further compared in women with or without a LPDF (Figures 1 and 2). Mean data for the four women in the ARA group who developed atypical LPDFs are illustrated (Figures 1B and 2B); individual follicle and hormone profiles for the four ARA women with atypical LPDFs are also shown (Figure 3).
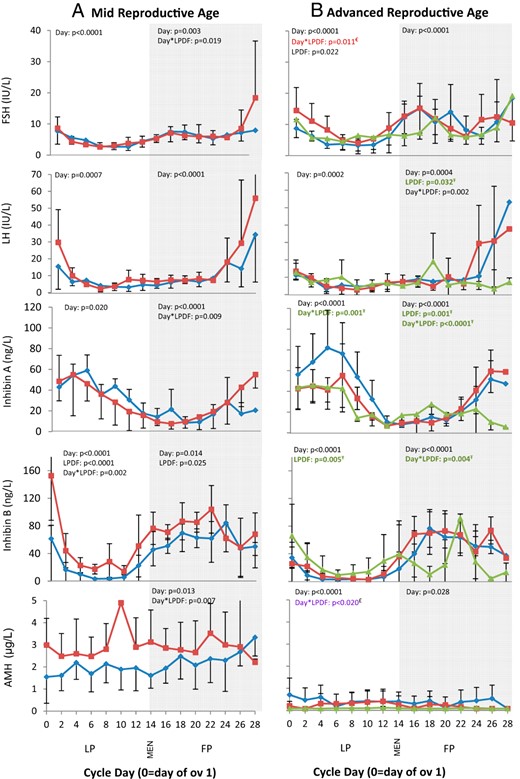
Serum FSH, LH, inhibin A, inhibin B, and AMH profiles over the interovulatory interval in women of MRA (A) and ARA (B).
Data are binned into 2-day intervals and centralized to the day of the first ovulation. Data are represented as mean ± SD. FP, follicular phase; LP, luteal phase; MEN, first day of menses. Ŧ, Differences detected between ARA women with atypical vs no LPDFs (green); £, differences detected between ARA women with atypical vs typical or no LPDFs (purple); €, differences detected between ARA women with typical vs no LPDFs (red).
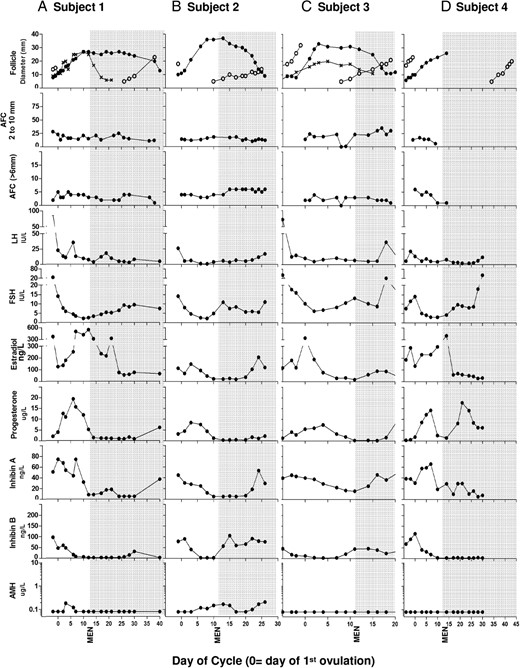
Individual dominant follicle growth, AFC, and hormone profiles in four ARA women (A–D) with atypical LPDFs during the IOI.
FP, follicular phase; LP, luteal phase; MEN, first day of menses.
Comparisons by age
The growth dynamics of the dominant follicle across the IOI differed in MRA vs ARA women (described in detail below; Figure 1). Both AFC of 6 mm or greater and 2–10 mm were lower in the ARA vs MRA group (Table 1 and Figure 1, A and B). Mean FSH and progesterone over the IOI were greater in women of ARA vs MRA (Table 2). In contrast, AMH and inhibin B over the IOI were lower in women of ARA vs MRA (Table 2). No differences in mean LH, estradiol, or inhibin A over the IOI were detected between ARA and MRA groups (Table 2 and Figures 1 and 2).
Endocrine Characteristics of Menstrual Cycles With and Without a LPDF
| Cycle Phase | LPDF | n | FSH, IU/L | LH, IU/L | Progesterone, μg/L | Estradiol, ng/L | AMH, μg/L | Inhibin A, ng/L | Inhibin B, ng/L |
|---|---|---|---|---|---|---|---|---|---|
| MRA FP | No LPDF | 5 | 6.66 ± 1.59 | 12.3 ± 4.54 | 0.83 ± 0.12 | 62.6 ± 21.1 | 2.31 ± 1.00 | 18.4 ± 4.85 | 61.6 ± 5.75a |
| Typical LPDF | 5 | 6.72 ± 2.99 | 13.0 ± 6.36 | 0.91 ± 0.39 | 72.6 ± 17.2 | 2.80 ± 1.17 | 18.3 ± 5.83 | 78.9 ± 7.78b | |
| MRA LP | No LPDF | 5 | 4.40 ± 1.65 | 6.06 ± 3.11 | 7.34 ± 1.94 | 51.7 ± 18.1c | 1.87 ± 0.81 | 40.8 ± 6.29 | 17.0 ± 3.34e |
| Typical LPDF | 5 | 4.31 ± 1.17 | 10.8 ± 6.15 | 8.31 ± 2.43 | 91.3 ± 18.4d | 3.04 ± 1.44 | 38.3 ± 13.1 | 44.2 ± 12.9f | |
| MRA | FP + LP | 10 | 5.69 ± 1.79i | 10.9 ± 3.01 | 4.07 ± 1.18i | 68.8 ± 20.6 | 2.50 ± 1.13j | 28.5 ± 6.85 | 54.1 ± 15.2j |
| ARA FP | No LPDF | 8 | 10.6 ± 3.81 | 11.6 ± 4.03 | 0.73 ±0.19a | 93.4± 39.6g | 0.43 ± 0.47 | 22.0 ± 8.26 | 53.5 ± 15.6 |
| Typical LPDF | 4 | 11.6 ± 0.81 | 14.5 ± 3.62a | 1.08 ± 0.30b | 98.7 ± 46.0 | 0.09 ± 0.10 | 23.2 ± 6.07 | 53.0 ± 15.5 | |
| Atypical LPDF | 4 | 7.96 ± 3.85 | 9.05 ± 2.93b | 0.92 ± 0.38 | 169 ± 157 | 0.09 ± 0.02 | 21.1 ± 10.3 | 31.4 ± 33.7 | |
| All LPDFs | 8 | 9.77 ± 3.21 | 11.8 ± 4.23 | 1.00 ± 0.33 | 134 ± 113h | 0.09 ± 0.02 | 22.2 ± 7.89 | 42.2 ± 26.9 | |
| ARA LP | No LPDF | 8 | 5.40 ± 1.73 | 6.82 ± 2.19 | 13.2 ± 4.19c | 97.8 ± 64.0a | 0.41 ± 0.51g | 52.8 ± 22.1 | 12.7 ± 12.7g |
| Typical LPDF | 4 | 8.08 ± 3.18 | 6.46 ± 0.37 | 10.7 ± 1.40 | 68.7 ± 27.3 | 0.10 ± 0.03 | 35.9 ± 9.27 | 8.21 ± 9.94 | |
| Atypical LPDF | 4 | 6.07 ± 1.67 | 8.30 ± 4.45 | 6.98 ± 2.47d | 184 ± 101b | 0.09 ± 0.01 | 35.0 ± 12.7 | 25.3 ± 13.6h | |
| All LPDFs | 8 | 7.08 ± 2.59 | 7.38 ± 3.08 | 8.85 ± 2.73d | 126 ± 91.9b | 0.10 ± 0.02h | 35.5 ± 10.3 | 16.8 ± 14.3 | |
| ARA | FP + LP | 16 | 8.34 ± 2.24i | 9.62 ± 2.16 | 6.07 ± 1.85i | 103 ± 53.8 | 0.28 ± 0.39j | 32.7 ± 8.46 | 31.7 ± 12.5j |
Abbreviation: FP, follicular phase; LP, luteal phase. The data are mean ± SD of samples across one interovulatory interval. Differences were assessed by t test and ANOVA after log transformation. See Table 1 for further details.
Within each age group: a vs b, g vs h = P < .05; c vs d = P < .01; e vs f, = P < .001 (bold).
P < .01 between age groups.
P < .001 between age groups.
Luteal phase
In the MRA group, 5 of 10 women (50%) developed a LPDF and the remaining 5 of 10 women (50%) did not (Table 2 and Figure 1A), as previously reported (7). All LPDFs in the MRA group were anovulatory. The mean peak LPDF diameter in MRA women was 10.5 ± 3.8 mm. None of these LPDFs exceeded 16 mm; therefore, they were considered typical LPDFs. The day of peak LPDF diameter varied throughout the luteal phase, after which time the LPDFs regressed.
MRA women with LPDFs had greater mean luteal phase estradiol compared with the women without LPDFs (Table 2 and Figure 1A). Mean luteal-phase progesterone was not different in MRA women with vs without LPDFs (Table 2 and Figure 1A). In the MRA group, luteal phase inhibin B was greater in women with vs without LPDFs (Figure 2A and Table 2).
In women of ARA, 8 of 16 women (50%) developed a LPDF, whereas the remaining 8 of 16 women did not (50%, Figure 1B). Luteal-phase follicle dynamics differed in women with vs without LPDFs (Figure 1B). In the ARA group, 4 of 16 women (25%) developed a typical LPDF (mean peak diameter 13.3 ± 4.9 mm), which regressed prior to menses (Figure 1B). Another 4/16 ARA women (25%) developed 1–2 atypical LPDFs which grew to a mean peak diameter of 33.5 ± 3.5 mm (Figures 1B and 3, A–D). In two of four ARA women, two atypical LPDFs developed simultaneously (Figure 3, A and C). In three of four cases, the atypical LPDFs were anovulatory (Figures 1B and 3, A–C); some LPDFs regressed in the midlate luteal phase and others regressed in the subsequent follicular phase (Figure 3, A–C). In the remaining woman (one of four), the LPDF ovulated during menses (Figure 3D). Ovulation was determined by a second rise in progesterone and the ultrasonographic detection of a CL; an LH surge was not detected prior to this atypical ovulation, most likely due to inadequate blood sampling frequency.
In the ARA group, luteal-phase estradiol was greater in women with atypical LPDFs compared with the women with no LPDFs (Table 2 and Figure 1B). In contrast, ARA women with atypical LPDFs had lower luteal-phase progesterone compared with the ARA women with typical or no LPDFs (Table 2 and Figure 1B). Luteal-phase inhibin A was lower in ARA women with atypical vs no LPDFs (Figure 2B). Luteal-phase inhibin B was greater in ARA women with atypical vs no LPDFs (Table 2 and Figure 2B). Luteal-phase FSH was greater in ARA women with typical LPDFs compared with those with no LPDFs (Figure 2B). AMH was detectable in six of eight ARA women with no LPDFs, three of four women with typical LPDFs, and three of four women with atypical LPDFs; however, AMH was not detectable in all women on every day of the IOI. AMH over the luteal phase appeared less variable (ie, fewer fluctuations) and lower in ARA women with atypical or typical LPDFs compared with those with no LPDFs (Table 2 and Figure 2B).
Follicular phase
Follicular-phase dominant follicle growth dynamics were similar between MRA and ARA groups, with the exception of atypical LPDFs in the ARA group which persisted into the subsequent follicular phase (Figure 1B). All women in the MRA and ARA groups developed a single dominant follicle in the follicular phase, which resulted in the second ovulation of the IOI (Figures 1–3).
In the MRA group, late follicular-phase FSH was greater in women with typical LPDFs vs no LPDFs (Figure 2A). Similarly, late follicular-phase inhibin A was greater in MRA women with vs without LPDFs (Figure 2A). Mean follicular-phase inhibin B was greater in MRA women with vs without LPDFs (Table 2 and Figure 2A). Follicular-phase AMH appeared greater in MRA women with vs without LPDFs (Figure 2A). No differences in follicular-phase estradiol, progesterone, or LH were detected in MRA women with vs without LPDFs (Table 2 and Figures 1A and 2A).
In the ARA group, women with atypical LPDFs had greater estradiol levels in the early follicular phase but lower estradiol levels in the late follicular phase compared with those with no LPDFs (Table 2 and Figure 1B). Follicular-phase progesterone was greater in ARA women with atypical LPDFs compared with those with no LPDFs (Table 2); the greater follicular-phase progesterone occurred due to one ARA woman who ovulated a LPDF during menses (Figure 3D). ARA women with atypical LPDFs had lower inhibin A in the late follicular phase compared with women with no LPDFs (Figure 2B). Serial changes in follicular phase inhibin B differed in ARA women with atypical vs typical or no LPDFs. Two falls in follicular-phase inhibin B occurred in women with atypical LPDFs (Figure 2B). Both falls in inhibin B occurred simultaneous to rises in FSH (Figure 2B). Late follicular-phase LH was lower in ARA women with atypical vs no LPDFs (Figure 2B). No differences in follicular-phase AMH were detected in ARA women with atypical LPDFs vs typical or no LPDFs (Figure 2B).
Discussion
In the present study, relationships between growth dynamics of individually identified antral follicles and corresponding hormone production across an IOI in women of MRA vs ARA were investigated. From this research, we documented that changes in antral follicle dynamics were associated with changes in hormone production in women of both MRA and ARA. Thus, our hypothesis was supported.
Luteal-phase dominant follicles in MRA women
The development of a LPDF in MRA women was associated with an increase in luteal-phase inhibin B and estradiol; other aspects of the endocrine system (LH, FSH, inhibin A, and progesterone) remained unchanged. Inhibin B is produced by follicles of the emerging wave (also referred to as the recruited cohort), whereas estradiol is produced from dominant follicles and the CL. A greater number of antral follicles and greater AMH over the IOI appeared to increase the likelihood of an estrogenic dominant follicle developing.
Luteal-phase dominant follicles in ARA women
Greater variability in LPDF growth dynamics (7) and hormone production were detected in ARA vs MRA women. In ARA women, atypical LPDFs were associated with greater luteal-phase estradiol and lower progesterone; with that said, both functional and nonfunctional atypical LPDFs were observed. Three of the four ARA women with atypical LPDFs exhibited marked elevations in luteal-phase estradiol, whereas the remaining woman did not show a rise in estradiol beyond normal luteal-phase levels. The timing of the elevations in estradiol varied among women from the early to mid-late luteal phase. These findings suggest that atypical LPDF cycles in women of ARA reflect exaggerated luteal-phase follicle growth and estradiol production compared with that seen in women with typical or no LPDFs. We postulated that the pituitary-ovarian mechanisms regulating luteal-phase antral follicle development change with age (ie, lower inhibin B, greater FSH), resulting in an increasing propensity for LPDFs to grow larger (sometimes to cystic diameters) and persist for longer periods of time. The persistent LPDFs can produce atypically high levels of estradiol, which appear to suppress luteal progesterone production.
LOOP events have been previously characterized in approximately 40% of late reproductive-age women as a rise in midluteal-phase estradiol, which continues into the early follicular phase (4). An LH surge (interpreted to represent ovulation) was detected in the early follicular phase in three of six women with a LOOP event (50%) (4). The origin of the atypical luteal-phase estradiol was unknown but was speculated to be related to major waves of antral follicle development (4). Findings from the present study confirm that LOOP events arise from the development of atypical LPDFs as women approach menopause. LOOP events were previously detected in women with abnormally short or long cycles (4); however, no association between cycle length and LPDFs was observed in the present study. Continued research is required to determine whether young women who develop typical LPDFs are at increased risk of developing atypical LPDFs as they approach menopause. It is plausible that atypical LPDFs in younger women may predict an earlier transition to menopause. Future investigations are also required to determine whether the presence of recurrent atypical LPDFs and associated transient elevations in estradiol with age predispose women to estrogen-mediated risks such as endometrial hyperplasia or breast cancer (13).
It is important to note that LPDFs were associated with lower progesterone in the ARA (but not MRA) group; these findings support documentations of LOOP events in women approaching menopause (4). The question then arises as to whether low progesterone is a cause or consequence of atypically high luteal-phase estradiol in women with LPDFs. Data from our study support the notion that LPDFs have a suppressive effect on luteal progesterone production because the LPDFs had achieved morphological dominance prior to the first ovulation of the IOI. Evidence of follicle-mediated suppression of luteal function is consistent with similar studies conducted in the bovine species (14). We did not observe increased luteal-phase inhibin A in ARA women with LPDFs. However, inhibin A is also a product of the CL; like progesterone, it may have been suppressed in the presence of a LPDF. In addition, LPDFs either underwent atresia or ovulated in women of ARA (7). Ovulation of LPDFs has not been documented to our knowledge. Continued research is required to determine the potential contraceptive implications of aberrant folliculogenesis resulting in ovulation during menses as women age.
Atypical LPDFs in ARA women emerged in the midlate follicular phase (underlying the major ovulatory wave) preceding the IOI evaluated. One or more follicles had achieved dominance around the time of the LH surge and then continued to grow and could produce estradiol throughout the subsequent luteal phase (presumably in response to the LH surge). In ARA women with atypical LPDFs, two rises and falls in inhibin B were detected during the late luteal-follicular phase. The late luteal-phase and follicular-phase nadirs in inhibin B occurred in temporal proximity to nadirs in AFC and elevations in FSH. We interpreted these data to mean that two waves of antral follicles emerged during the follicular phase in ARA women with atypical LPDFs (ie, contributing to three vs two waves over the entire IOI). These findings are consistent with previous reports on the timing of emergence of follicle waves in women (8, 9) and domestic farm animals (15). Multiple waves of follicle growth, inhibin B, and AFC documented by our research group (8, 9) support additional documentations of regular episodic secretion of inhibin B during the menstrual cycle (16).
Luteal-phase dominant follicles and markers of ovarian reserve
The AFC (17) and AMH are used as markers of ovarian reserve. They are predictive of the ovarian response to hormonal stimulation in women undergoing assisted reproduction. AFC and AMH are elevated in women with polycystic ovary syndrome (18, 19) and depressed in women with premature ovarian failure (20). In the present study, MRA women with LPDFs had a greater AFC 2–10 mm, AFC 6 mm or greater, and inhibin B across the luteal phase. AMH also appeared to be greater across the follicular phase in MRA women with vs without LPDFs; this difference was not attributed to outliers. Upon further inspection of the data, we found that AFC 2–9 mm on days 2–5 after menses exceeded 26 in 8 of 10 women in the MRA group. Based on new ultrasonographic criteria, these data may be interpreted to represent women with polycystic ovarian morphology (21). We did not quantify androgen concentrations or hirsutism in the present study. However, all of the women in the study had regular cycles and no clinical evidence of polycystic ovary syndrome. We attributed the increase in AFC in this study to be due to a greater propensity for higher follicle counts after the retrospective vs prospective review of ultrasound cineloops (A.B. and M. E. Lujan, personal communication), rather than the presence of polycystic ovaries (21). Collectively we interpreted our findings to mean that LPDFs were more likely to develop in MRA women with a greater ovarian reserve and greater number of growing antral follicles.
Similarly, ARA women with atypical LPDFs had greater AFC of 6 mm or greater and inhibin B compared with the women with typical LPDFs. However, AMH was lower and appeared to fluctuate less across the cycle in ARA women with vs without LPDFs. AMH detection was variable among women in our study. AMH levels were detected in most, but not all, women. Furthermore, not all women had detectable levels on each day during the IOI. Therefore, we attribute the inconsistent findings in serial changes in AMH between MRA and ARA women to be due to assay limitations. Further studies to quantify changes in AMH across the cycle using novel, more sensitive assays are ongoing in our laboratory.
Follicular-phase dominant follicles and hormone production
The growth dynamics of follicular-phase dominant follicles did not differ in women of MRA vs ARA (7). However, differences in follicular-phase hormone patterns were detected in association with LPDFs. Early follicular-phase estradiol was greater in ARA women who developed atypical LPDFs compared with those who did not. Follicular-phase estradiol has previously been shown to increase during the transition to menopause (22); the physiological origin of the elevated estradiol was not understood. In the present study, we documented that increased follicular-phase estradiol with age occurred in association with the development of atypical LPDFs that persisted into the follicular phase rather than earlier selection of a follicular-phase dominant follicle.
Study strengths and limitations
This study's strengths lie in the assessment of growth dynamics of individually identified dominant follicles and simultaneous changes in AFC and serum hormone concentrations across one IOI. Serial changes in hormone and follicle end points were compared with mean outcomes over the IOI, luteal phase, and follicular phase. Serial changes in end points across the IOI were not fully appreciated when data were averaged across phases of the cycle.
Longitudinal studies to characterize serial changes in follicle and endocrine dynamics over a complete cycle require significant time and financial resources, thereby limiting the number of participants that can be evaluated in a single study. The limited sample size in this study did not allow post hoc analyses for confirming specific days on which hormone concentrations differed within each phase of the cycle. In addition, the sample size did not enable us to characterize ovarian function according to the Stages of Reproductive Aging Workshop classifications of the menopausal transition (23). Future investigations in a larger cohort of women are required to confirm our findings. AMH was nondetectable in more than half of the ARA women, limiting interpretations of AMH over the cycle. We have since developed a more sensitive assay for human serum AMH (24); studies to evaluate AMH over the menstrual cycle are ongoing. Furthermore, current ultrasonographic methods do not allow the reliable detection of follicles less than 2 mm. These small antral follicles are likely to exhibit differences in endocrine responses not necessarily reflected with larger follicles (25).
Conclusion
Antral follicular development changes during the menstrual cycle as women age. In women of MRA, LPDFs were a product of normal follicular activity and were associated with elevations in luteal-phase estradiol. In women of ARA, LPDFs emerged earlier, grew larger, persisted for longer, and could be associated with acute and atypically high luteal-follicular phase estradiol. Progesterone concentrations were lower in ARA women with vs without LPDFs.
Acknowledgments
We thank the research participants, whose contributions were invaluable to the completion of this project. We also thank Dr Roger Pierson for his assistance in facilitating data collection in this study.
This study was registered at www.clinicaltrials.gov with the identifier of NCT01389141.
We acknowledge the provision of hormone assays by Beckman Coulter.
This work was supported by research grants from the Canadian Institutes of Health Research; the Canadian Foundation for Women's Health; an establishment grant from the University of Saskatchewan; the National Health and Medical Research Council of Australia Program Grant 494802 and Research Fellowship 169201 (to D.M.R.); and the Victorian Government's Operational Infrastructure Support Program.
Disclosure Summary: The authors have nothing to disclose.
Abbreviations
- AFC
antral follicle count
- AMH
anti-Mullerian hormone
- ARA
advanced reproductive age
- CL
corpus luteum
- IOI
interovulatory interval
- LOOP
luteal out of phase
- LPDF
luteal-phase dominant follicles
- MRA
midreproductive age.
