


MicroRNAs (miRNAs) are valuable circulating biomarkers and therapeutic targets for metabolic diseases.
The objective of the study was to define the pattern of circulating miRNAs in pregestational and gestational obesity and to explore their associations with maternal metabolic parameters and with markers for pre- and postnatal growth.
TaqMan low-density arrays were used to profile plasma miRNAs in six women with pregestational obesity (PregestOB), six with gestational obesity (GestOB), and six with normal pregnancies (control) during the second trimester of gestation. The most relevant miRNAs were validated in 70 pregnant women (20 PregestOB, 25 GestOB, and 25 control). Maternal metabolic parameters including glucose, glycated hemoglobin, homeostasis model assessment index of insulin resistance, C-peptide, and lipids were assessed. Placentas were weighed at delivery and newborns also during 6 months of life.
We identified 13 circulating miRNAs differentially expressed in maternal obesity, including decreased levels of miR-29c, miR-99b, miR-103, miR-221, and miR-340 and increased levels of miR-30a-5p, miR-130a, and miR-150 in GestOB; and decreased levels of miR-122, miR-324–3p, miR-375, and miR-652 and increased levels of miR-625 in both PregestOB and GestOB (P < .05 to P < .0001 vs control). Decreased levels of several of these miRNAs associated with a more adverse maternal metabolic status (more pregnancy weight gain, glucose, glycated hemoglobin, homeostasis model assessment index of insulin resistance, C-peptide, and triacylglycerol and less high density lipoprotein cholesterol), with more placental weight, weight at birth, and weight at 6 months of life (all P < .05 to P < .001).
This study provides the first identification of altered circulating miRNAs in maternal obesity and suggests a possible role of such miRNAS as markers for pre- and postnatal growth.
Obesity has emerged as a preeminent public health problem. In the United States, 66% of women in the reproductive age are overweight (body mass index [BMI] 25 to < 30 kg/m2), and 33% of these are obese (BMI ≥ 30 kg/m2), resulting in a modern health crisis (1). Obesity in pregnancy has not only adverse effects on maternal health and pregnancy outcome but also on the developing fetus. Obese pregnant women have an increased risk of impaired glucose tolerance and gestational diabetes and of having a large-for-gestational-age baby (2, 3). Offspring of obese women also have an increased risk of obesity and impaired glucose tolerance in later life (4, 5). The mechanism by which the maternal nutritional environment induces such changes is beginning to be understood and involves the altered epigenetic regulation of specific genes such as microRNAs (miRNAs) (6, 7).
miRNAs are a class of noncoding endogenous RNA molecules approximately 22 nucleotides long that regulate gene expression at the transcriptional or posttranscriptional level by suppressing translation of protein coding genes or cleaving target mRNAs to induce their degradation (8, 9). The particular mechanism of this regulation depends greatly on the degree of complementarity of the miRNA to its target mRNA. Previous work has shown that partial complementarity of a miRNA to an mRNA target may result in effective repression of translation; therefore, a single miRNA can regulate a vast number of genes (10). Evolutionarily conserved, miRNAs constitute a layer of epigenetic regulation that provides an additional control of intricate processes such as cell growth, differentiation, stress response, and tissue remodeling that when perturbed can potentially cause disease (11).
miRNAs have been heralded as potential novel biomarkers for many pathological states, consequent to their tissue specific expression and association with clinicopathological variables. Their recent discovery in the circulation has prompted further exploration of their potential use as novel minimally invasive biomarkers of disease (12, 13).
Several authors have reported altered the expression of circulating miRNAs during human pregnancy in pathological conditions such as preeclampsia (14–16), gestational hypertension (16), fetal growth restriction (16), fetal macrosomia (17), and congenital heart defects (18), but their role in gestational obesity has not been investigated.
In this study, we used TaqMan low-density arrays and reverse transcription quantitative PCR to define the pattern of circulating miRNAs in pregnant women with pregestational and gestational obesity and women with normal pregnancies as control subjects; to explore the associations between circulating miRNA and metabolic parameters during pregnancy; and to study the utility of maternal circulating miRNAs as markers for pre- and postnatal growth.
Materials and Methods
Subjects and ethics
The study population consisted of 70 pregnant Caucasian women with uncomplicated pregnancies (other than pregestational or gestational obesity) delivering appropriate-for-gestational-age term infants. Subjects were consecutively recruited among those seen within a setting of prenatal primary care in Girona (Spain). Women with multiple pregnancies, gestational diabetes, preeclampsia, and fetal malformations or asphyxia or drug use were excluded. Women were grouped according to their pregestational BMI (pregestBMI) and their pregnancy weight gain into the following: 1) control (18.5 kg/m2 < pregestBMI < 24.9 kg/m2 and 11.5 < pregnancy weight gain < 16 kg), 2) pregestational obesity (pregestBMI > 25 kg/m2 and 7 < pregnancy weight gain < 11.5 kg), and 3) gestational obesity (18.5 kg/m2 < pregestBMI < 24.9 kg/m2 and pregnancy weight gain > 16 kg), as previously described by the Institute of Medicine (19). The protocol was approved by the Institutional Review Board of Dr Josep Trueta Hospital. Informed written consent was obtained from the women.
Clinical assessments
A close prenatal follow-up, consisting of protocolized clinical examinations, ultrasonograms, and laboratory tests (urine and blood), was performed in all subjects. Information on maternal pregnancy characteristics was abstracted from standardized medical records. Pregestational BMI was calculated as weight divided by height squared.
All infants were born at term (37–42 wk). Infants were weighed and measured after delivery using a calibrated scale for weight and a measuring board for length. Placentas were also weighed at delivery. Forty-two mothers accepted to continue a follow-up study of their newborns for weight and height measurements at 1, 4, and 6 months of life.
Analytical methods
Blood tests were performed under fasting conditions in all women between 24 and 32 weeks of gestation. Serum glucose was analyzed by the hexokinase method. Serum immunoreactive insulin was measured by immunochemiluminescence (Immulite 2000; Diagnostic Products Inc). The lower detection limit was 0.4 mIU/L, and the intra- and interassay coefficients of variation were less than 10%. Fasting insulin sensitivity was estimated from fasting insulin and glucose levels using the following formula: homeostasis model assessment index of insulin resistance (HOMA-IR) = (fasting insulin in milliunits per liter) × (fasting glucose in millimoles)/22.5. Glycated hemoglobin (HbA1c) was measured by HPLC (Bio-Rad Laboratories) and a Jokoh HS-10 autoanalyzer. Serum C-peptide was measured by immunochemiluminiscence (IMMULITE 2000; Diagnostic Products Inc). The detection limit was 0.05 ng/mL, and the coefficients of variation were less than 10%. Total serum triacylglycerol was measured by monitoring the reaction of glycerol-phosphate-oxidase and peroxidase. High-density lipoprotein (HDL) cholesterol was quantified by the homogeneous method of selective detergent with accelerator.
Analysis of circulating miRNAs
Circulating miRNAs extraction and purification
Plasma was obtained by standard venipuncture and centrifugation in EDTA-coated Vacutainer Tubes (Becton Dickinson). Separation of plasma was performed by double centrifugation with a laboratory centrifuge (Beckman J-6M induction drive centrifuge; Beckman Instruments) at 1500 g for 15 minutes at 4°C. Plasma was separated into aliquots and stored at −80°C until ready for RNA extraction. Total RNA (including miRNAs) was isolated from plasma samples with the mirVana PARIS isolation kit (Applied Biosystems) according to the manufacturer's instructions. The quantity of isolated RNA was determined with a Nanodrop ND-1000 spectrophotometer (Nanodrop Technologies). The integrity of each RNA sample was checked with an Agilent Bioanalyzer (Agilent Technologies).
Circulating miRNA reverse transcription and preamplification
Three hundred nanograms of total RNA were reverse transcribed using TaqMan microRNA reverse transcription kit and Megaplex reverse transcription primers (human pool sets A and B) (Applied Biosystems). A preamplification step was performed with TaqMan preamp master mix and Megaplex preamp primers (human pool sets A and B; Applied Biosystems), as previously described (20).
Circulating miRNA profiling
We studied the circulating miRNA profiles in 18 representative pregnant women (six pregestOB, six gestOB and six control) randomly selected from the study population (n = 70, see below). The sampling method was stratified to ensure that the sample would be representative of the study subjects as regards maternal age, BMI, and smoking and newborn's gender. A TaqMan array human mRNA Card Set version 3.0 that enables accurate quantification of 723 human miRNAs was used. TaqMan low-density arrays were carried out with a real-time thermal cycler (Applied Biosystems 7900HT Fast real-time PCR system). Results were provided with the Sequence Detection Systems Software version 2.3 (Applied Biosystems) and analyzed with the R package SL qpcrNorm (Bioconductor), as previously described (21).
Analysis of individual miRNAs
Individual TaqMan microRNA assays (Applied Biosystems) were used to study the presence of circulating miRNA candidates in the studied subjects: 70 pregnant women (20 with pregestational obesity, 25 with gestational obesity, and 25 women with normal pregnancies), including the subjects previously used to determine the miRNA profile. Gene expression was assessed by real-time PCR using the LightCycler 480 real-time PCR system (Roche Diagnostics) as previously described (21). Real-time PCR was performed using the following Taqman miRNA assays (Applied Biosystems): hsa-miR-29c-3p (identification number 000587), hsa-miR-30a-5p (identification number 000417), hsa-miR-99b-5p (identification number 000436), hsa-miR-103a-3p (identification number 000439), hsa-miR-122–5p (identification number 002245), hsa-miR-128–3p (identification number 002216), hsa-miR-130a-3p (identification number 000454), hsa-miR-150–5p (identification number 000473), hsa-miR-193b-3p (identification number 002367), hsa-miR-221–3p (identification number 000524), hsa-miR-324–3p (identification number 002161), hsa-miR-340–5p (Identification number 002258), hsa-miR-370–3p (identification number 002275), hsa-miR-375 (identification number 000564), hsa-miR-423–5p (identification number 002340), hsa-miR-625–3p (identification number 002432), hsa-miR-652–3p (identification number 002352), and hsa-miR-885–5p (identification number 002296). We performed δcycle threshold normalization as implemented in the HTqPCR R package, using the three most stable (rank invariant) miRNAs (pool A: hsa-miR-28–3p [identification number 002446), hsa-miR-93–5p (identification number 001090), hsa-miR-146b-5p (identification number 001097); pool B: hsa-miR-151a-3p (identification number 002254), U6 snRNA (identification number 001973), hsa-miR-766–3p (identification number 001986) as reference. Relative miRNA levels were calculated according to the 2-δcycle threshold method.
Statistical analysis
Results are expressed as mean ± SEM. Variables without normal distribution were computed as logarithm values to improve symmetry. An unpaired t test or a one-way ANOVA was used to study differences in continuous variables among groups. The relationship between variables was analyzed by simple correlation followed by multiple regression analysis in a stepwise manner. Significance level was set at P < .05. Data analyses were performed with the SPSS (version 12.0) and R statistical software (http://www.r-project.org/). The SL qPCRNorm Package (Bioconductor) was also used for the analysis and normalization of miRNA data (22).
Accepting an α-risk of .05 and a β-risk of .2 in a two-sided test, 21 subjects are needed in each group to detect as statistically significant a difference of 1 SD of any given quantitative variable (metabolic, miRNA expression) between any pair of groups assuming that three groups exist. Differences of 1 SD are relevant for most of the studied variables. The study power was also sufficient to detect a statistically significant correlation between any pair of quantitative variables with a Pearson correlation coefficient of 0.33 or higher.
Results
Identification samples: screening of differential miRNA profile
From the 723 human miRNAs screened by quantitative RT-PCR array (TaqMan array human miRNA), the presence of 201 miRNAs (28%) was detected in plasma from PregestOB, 218 miRNAs (30%) in plasma from GestOB, and 207 miRNAs (29%) in plasma from control women. Among them, 174 miRNAs were common in all studied groups (PregestOB, GestOB, and control), whereas others were unique for each group (PregestOB: 13 miRNAs; GestOB: 23 miRNAs; and control: eight miRNAs) or were shared between two given groups (Figure 1).
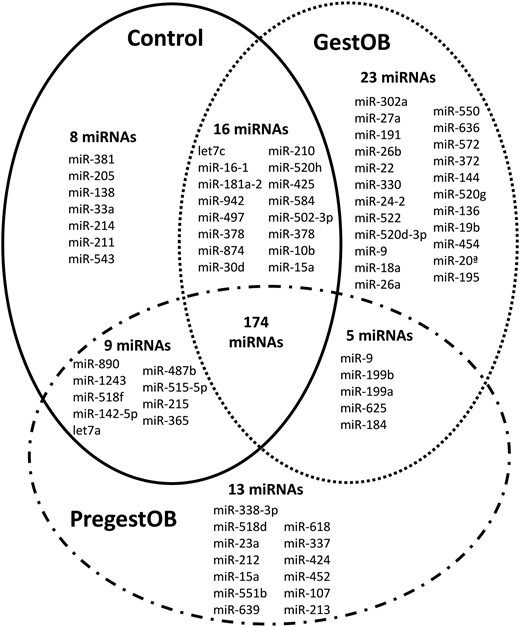
Venn diagram showing miRNA expressed in plasma of second-trimester pregnant women.
PregestOB, pregestational obesity; GestOB, gestational obesity; control, normal pregnancies.
Of the 174 miRNAs shared by all three groups, 18 miRNAs were found to be up- or down-regulated by at least 2-fold in PregestOB and GestOB plasma, respectively (P < .05). These 18 miRNAs were chosen as candidates for miRNAs differentially regulated by maternal obesity.
Validation samples: expression patterns of differential miRNAs in maternal obesity
Demographic and clinical characteristics of the study population are summarized in Table 1. Thirteen of 18 miRNAs were confirmed to be differentially present between women with normal pregnancies and obese women. Among them, miR-29c (P = .01), miR-99b (P = .008), miR-103 (P < .0001), miR-221 (P = .001), and miR-340 (P = .01) were decreased, and miR-30a-5p (P = .007), miR-130a (P = .02) and miR-150 (P = .004) were increased in GestOB compared with control (Table 1 and Supplemental Figure 1). miR-122 (P = .017 and P = .03), miR-324–3p (P = .002 and P < .0001), miR-375 (P = .007 and P = .04) and miR-652 (P = .04 and P < .0001) were decreased, and miR-625 (P = .009 and P = .04) was increased in both PregestOB and GestOB compared with control (Table 1 and Supplemental Figure 1). PregestOB showed increased levels of miR-211 (P = .02) and decreased levels of miR-130a (P = .01) compared with GestOB (Supplemental Figure 1).
Clinical Characteristics of Pregnant Women Enrolled in the Study
| Control (n = 25) | PregestOB (n = 20) | GestOB (n = 25) | P Value | |
|---|---|---|---|---|
| Mother | ||||
| Age, y | 30 ± 1 | 31 ± 1 | 30 ± 1 | ns |
| Pregestational BMI, kg/m2 | 22.4 ± 0.2 | 29.7 ± 0.2 | 21.6 ± 0.3 | ns |
| First-trimester BMI, kg/m2 | 23.0 ± 0.3 | 29.4 ± 0.6 | 23.0 ± 0.4 | <.0001 |
| Second-trimester BMI, kg/m2 | 25.0 ± 0.3 | 30.8 ± 0.6 | 26.2 ± 0.4 | <.0001 |
| Third-trimester BMI, kg/m2 | 26.7 ± 0.3 | 32.3 ± 0.6 | 29.2 ± 0.4 | <.0001 |
| Delivery BMI, kg/m2 | 27.0 ± 0.3 | 32.7 ± 0.7 | 29.8 ± 0.4 | <.0001 |
| Weight gain, kg | 12.2 ± 0.5 | 7.9 ± 0.5 | 22.0 ± 1 | <.0001 |
| Preload glucose, mg/dL | 77.7 ± 0.9 | 83.9 ± 1.6 | 79.1 ± 1.3 | ns |
| Postload glucose, mg/dL | 125 ± 5 | 131 ± 6 | 116 ± 6 | .005 |
| HbA1c, % | 4.9 ± 0.1 | 5.1 ± 0.1 | 5.0 ± 0.7 | ns |
| Insulin, mIU/L | 4.7 ± 1.1 | 8.3 ± 1.5 | 6.3 ± 0.8 | ns |
| HOMA-IR | 0.9 ± 0.2 | 1.7 ± 0.3 | 1.2 ± 0.2 | ns |
| C-peptide, ng/mL | 1.4 ± 0.1 | 2.2 ± 0.1 | 1.7 ± 0.1 | <.0001 |
| TG, mg/dL | 142.5 ± 7.2 | 195.7 ± 13.9 | 167.4 ± 17.8 | ns |
| HDL-cholesterol, mg/dL | 71.8 ± 1.9 | 70.1 ± 2.5 | 71.5 ± 2.7 | ns |
| Newborn and placenta | ||||
| Gender, % female | 42.3% | 45.5% | 46.7% | ns |
| Gestational age, wk | 39.7 ± 0.1 | 40.1 ± 0.2 | 39.9 ± 0.2 | ns |
| Birth weight, g | 3272 ± 37 | 3441 ± 65 | 3492 ± 75 | .03 |
| Birth weight SDS | −0.07 ± 0.1 | 0.28 ± 0.2 | 0.5 ± 0.2 | .02 |
| Birth height, cm | 49.2 ± 0.2 | 50.2 ± 0.4 | 50.1 ± 0.3 | ns |
| Birth height SDS | −0.35 ± 0.1 | 0.13 ± 0.2 | 0.15 ± 0.2 | ns |
| Placental weight, g | 576 ± 16 | 650 ± 20 | 642 ± 29 | ns |
| Weight 1 mo, kg) | 4.3 ± 0.1 | 4.3 ± 0.1 | 4.4 ± 0.1 | ns |
| Weight 4 mo, kg) | 6.8 ± 0.1 | 6.7 ± 0.1 | 7.1 ± 0.2 | ns |
| Weight 6 mo, kg) | 7.8 ± 0.2 | 7.7 ± 0.2 | 7.9 ± 0.2 | ns |
| miRNAs | ||||
| miR-29c | 1.04 ± 0.06 | 0.89 ± 0.06 | 0.79 ± 0.06a | 0.05 |
| miR-30a-5p | 2.86 ± 0.40 | 3.82 ± 0.81 | 5.40 ± 1.08a | 0.02 |
| miR-99b | 0.53 ± 0.04 | 0.44 ± 0.03 | 0.37 ± 0.03a | .05 |
| miR-103 | 1.66 ± 0.10 | 1.38 ± 0.17 | 1.01 ± 0.08b | .002 |
| miR-122 | 1.26 ± 0.29 | 0.61 ± 0.11a | 0.87 ± 0.26c | .02 |
| miR-128a | 0.08 ± 0.01 | 0.12 ± 0.02 | 0.07 ± 0.01 | ns |
| miR-130a | 0.68 ± 0.06 | 0.63 ± 0.08 | 1.11 ± 0.12c | .02 |
| miR-150 | 3.81 ± 0.48 | 5.61 ± 1.23 | 6.68 ± 0.86a | .01 |
| miR-193b | 0.20 ± 0.04 | 0.12 ± 0.02 | 0.22 ± 0.04 | ns |
| miR-221 | 5.13 ± 0.51 | 5.53 ± 0.92 | 3.11 ± 0.34b | .007 |
| miR-324-3p | 0.14 ± 0.01 | 0.08 ± 0.01a | 0.07 ± 0.01b | <.0001 |
| miR-340 | 0.03 ± 0.01 | 0.02 ± 0.01 | 0.01 ± 0.01a | .05 |
| miR-370 | 0.69 ± 0.15 | 0.48 ± 0.09 | 0.48 ± 0.09 | ns |
| miR-375 | 0.25 ± 0.05 | 0.12 ± 0.02a | 0.16 ± 0.02c | .005 |
| miR-423-5p | 0.30 ± 0.02 | 0.30 ± 0.04 | 0.27 ± 0.03 | ns |
| miR-625 | 0.23 ± 0.03 | 0.42 ± 0.07a | 0.30 ± 0.03c | .002 |
| miR-652 | 0.63 ± 0.05 | 0.53 ± 0.08c | 0.37 ± 0.06b | .001 |
| miR-885-5p | 0.18 ± 0.03 | 0.19 ± 0.03 | 0.23 ± 0.03 | ns |
Abbreviation: ns, not significant. Data are shown as mean ± SEM. miRNA values are shown as relative expression (2-ACT).
P ≤ .01.
P ≤ .001 vs control women.
P ≤ .05.
In receiver-operating characteristic curve analyses, miR-375 was found to have good discriminatory accuracy for pregestational obesity (area under the curve [AUC] 0.76). In turn, miR-30a-5p (AUC 0.74) and miR-221 (AUC 0.73) had acceptable discriminatory accuracy for gestational obesity; and miR-103 (AUC 0.77), miR-130a (AUC 0.75), miR-324–3p (AUC 0.76), and miR-652 (AUC 0.81) had good discriminatory accuracy for gestational obesity (Supplemental Figure 2).
Association with obesity-related traits
Plasma concentrations of nearly all studied miRNAs were significantly associated with pregnancy weight gain and metabolic parameters including glucose tolerance, insulin sensitivity and secretion and serum lipids.
miR-30a-5p (r = 0.341, P = .005), miR-130a (r = 0.408, P = .001), and miR-150 (r = 0.262, P = .03) were significantly associated with higher pregnancy weight gain, whereas miR-99b (r = −0.261, P = .03), miR-103 (r = −0.367, P = .003), miR-128a (r = −0.375, P = .002), miR-221 (r = −0.383, P = .002), miR-324–3p (r = −0.299, P = .01), and miR-652 (r = −0.317, P = .01) were significantly associated with lower pregnancy weight gain (Table 2 and Supplemental Figure 3). All of them, except miR-150, remained significantly associated with pregnancy weight gain in multiple regression analysis adjusting for confounding variables, including pregestational BMI, HOMA-IR, lipids, newborns' gender, and maternal age (Table 3).
Correlation Between miRNA Relative Expression and Obesity-Related Traits in All Pregnant Women Enrolled in This Study.
| Pregnancy Weight Gain | Glucose | HbA1c | HOMA-IR | C-Peptide | TG | HDL-Cholesterol | |
|---|---|---|---|---|---|---|---|
| miR-29c | −0.198 | −0.031 | −0.005 | −0.026 | −0.202 | −0.073 | 0.182 |
| miR-30a-5p | 0.341a | 0.038 | 0.242 | −0.021 | −0.004 | 0.100 | −0.051 |
| miR-99b | −0.261b | −0.071 | 0.114 | 0.017 | −0.138 | 0.083 | 0.032 |
| miR-103 | −0.367a | −0.229 | −0.164 | −0.057 | −0.197 | −0.195 | 0.126 |
| miR-122 | −0.118 | −0.156 | 0.081 | −0.344a | −0.327a | −0.275b | 0.250b |
| miR-128-a | −0.375a | −0.085 | −0.045 | 0.023 | 0.080 | −0.054 | 0.138 |
| miR-130a | 0.408c | −0.097 | 0.148 | −0.081 | −0.028 | 0.055 | −0.081 |
| miR-150 | 0.262b | 0.124 | 0.091 | 0.048 | 0.123 | 0.229 | −0.092 |
| miR-193b | 0.069 | −0.052 | −0.027 | −0.178 | −0.242 | −0.209 | 0.118 |
| miR-221 | −0.383a | −0.251b | −0.272b | 0.018 | −0.053 | −0.169 | 0.034 |
| miR-324-3p | −0.299a | −0.011 | −0.061 | −0.196 | −0.277b | −0.254b | 0.265b |
| miR-340 | −0.160 | −0.303a | −0.407c | 0.023 | −0.166 | −0.165 | 0.031 |
| miR-370 | −0.155 | −0.136 | −0.056 | −0.172 | −0.175 | −0.150 | −0.039 |
| miR-375 | −0.003 | −0.152 | −0.062 | −0.336a | −0.413c | −0.332a | 0.251b |
| miR-423–5p | −0.152 | −0.273b | −0.118 | −0.266b | −0.167 | −0.154 | 0.074 |
| miR-625 | −0.012 | −0.058 | −0.022 | −0.027 | −0.030 | 0.087 | 0.023 |
| miR-652 | −0.317a | −0.252b | −0.317a | −0.159 | −0.299a | −0.295a | 0.201 |
| miR-885–5p | 0.170 | −0.038 | 0.148 | −0.185 | −0.084 | −0.052 | 0.112 |
Data are obtained by Person correlation analysis.
P ≤ .01.
P ≤ .05.
P ≤ .001.
Multivariate Regression Analyses of Obesity-Related Traits as Dependent Variables in All Pregnant Women Enrolled in this Study.
| Pregnancy Weight Gain | Glucose | HbA1c | HOMA-IR | C-Peptide | TG | |||||||
|---|---|---|---|---|---|---|---|---|---|---|---|---|
| β | P Value | β | P Value | β | P Value | β | P Value | β | P Value | β | P Value | |
| miR-30a-5p | 0.234 | 0.01 | ||||||||||
| Pregestational BMI | −0.688 | 0.000 | ||||||||||
| HOMA-IR | 0.315 | 0.001 | ||||||||||
| Adjusted Rb | 0.544 | |||||||||||
| miR-99b | −0.283 | 0.001 | ||||||||||
| Pregestational BMI | −0.761 | 0.000 | ||||||||||
| HOMA-IR | 0.321 | 0.001 | ||||||||||
| Adjusted Rb | 0.586 | |||||||||||
| miR-103 | −0.264 | 0.003 | ||||||||||
| Pregestational BMI | −0.711 | 0.000 | ||||||||||
| HOMA-IR | 0.284 | 0.002 | ||||||||||
| Adjusted Rb | 0.574 | |||||||||||
| miR-122 | −0.269 | 0.01 | −0.242 | 0.02 | −0.267 | 0.03 | ||||||
| Pregestational BMI | 0.587 | 0.000 | 0.691 | 0.000 | ||||||||
| Weight gain | 0.408 | 0.006 | 0.361 | 0.01 | ||||||||
| Adjusted Rb | 0.314 | 0.381 | 0.071 | |||||||||
| miR-128-a | −0.196 | 0.03 | ||||||||||
| Pregestational BMI | −0.695 | 0.000 | ||||||||||
| HOMA-IR | 0.298 | 0.002 | ||||||||||
| Adjusted Rb | 0.541 | |||||||||||
| miR-130a | 0.211 | 0.02 | ||||||||||
| Pregestational BMI | −0.682 | 0.000 | ||||||||||
| HOMA-IR | 0.306 | 0.002 | ||||||||||
| Adjusted Rb | 0.546 | |||||||||||
| miR-221 | −0.203 | 0.02 | −0.358 | 0.003 | −0.290 | 0.02 | ||||||
| Pregestational BMI | −0.693 | 0.000 | 0.457 | 0.000 | ||||||||
| HOMA-IR | 0.297 | 0.002 | ||||||||||
| Adjusted Rb | 0.544 | 0.249 | 0.084 | |||||||||
| miR-324–3p | −0.244 | 0.007 | ||||||||||
| Pregestational BMI | −0.733 | 0.000 | ||||||||||
| HOMA-IR | 0.258 | 0.007 | ||||||||||
| Adjusted Rb | 0.563 | |||||||||||
| miR-340 | −0.315 | 0.007 | −0.461 | 0.000 | ||||||||
| Pregestational BMI | 0.362 | 0.002 | ||||||||||
| Adjusted Rb | 0.226 | 0.213 | ||||||||||
| miR-375 | −0.199 | 0.05 | −0.252 | 0.02 | −0.348 | 0.005 | ||||||
| Pregestational BMI | 0.553 | 0.001 | 0.627 | 0.000 | ||||||||
| Weight gain | 0.416 | 0.007 | 0.344 | 0.01 | ||||||||
| Adjusted Rb | 0.280 | 0.381 | 0.121 | |||||||||
| miR-423–5p | −0.316 | 0.007 | −0.244 | 0.02 | ||||||||
| Pregestational BMI | 0.383 | 0.001 | 0.634 | 0.000 | ||||||||
| Weight gain | 0.433 | 0.004 | ||||||||||
| Adjusted Rb | 0.229 | 0.303 | ||||||||||
| miR-652 | −0.182 | 0.04 | −0.312 | 0.008 | −0.364 | 0.003 | −0.287 | 0.01 | ||||
| Pregestational BMI | −0.715 | 0.000 | 0.400 | 0.001 | 0.704 | 0.000 | ||||||
| HOMA-IR | 0.271 | 0.006 | 0.301 | 0.03 | ||||||||
| Adjusted Rb | 0.537 | 0.226 | 0.132 | 0.396 | ||||||||
Data are obtained by independent multiple regression analysis in a stepwise manner. Nonpredicted variables include the following: newborns' gender, maternal age, and lipids.
Decreased levels of miR-221 (r = −0.251, P = .04 and r = −0.272, P = .02), miR-340 (r = −0.303, P = .01 and r = −0.407, P = .001), and miR-652 (r = −0.252, P = .04 and r = −0.317, P = .01) were associated with more impaired glucose tolerance, including higher levels of glucose and HbA1c, respectively (Table 2 and Supplemental Figure 4). Decreased levels of miR-122 (r = −0.344, P = .005 and r = −0.327, P = .008) and miR-375 (r = −0.336, P = .006 and r = −0.413, P = .001) were associated with lower insulin sensitivity consisting of higher HOMA-IR and C-peptide, respectively (Table 2 and Supplemental Figure 5). Decreased levels of miR-122 (r = −0.275, P = .02 and r = −0.250, P = .05), miR-324–3p (r = −0.254, P = .04 and r = −0.265, P = .03), and miR-375 (r = −0.332, P = .007 and r = −0.251, P = .02) were associated with higher triglycerides (TG) and lower HDL-cholesterol (Table 2 and Supplemental Figure 5). Some of these associations remained significant in a multiple regression analysis adjusting for confounding variables including pregestational BMI, HOMA-IR, lipids, newborns' gender, and maternal age (Table 3).
Association with growth parameters
Plasma concentrations of a number of miRNAs were significantly associated with growth parameters at birth and thereafter during the 6-month follow-up (Table 4).
Correlation Between miRNA Relative Expression and Infants' Growth Parameters in All Pregnant Women Enrolled in this Study.
| Placental Weight | Birth Weight SDS | Birth Height SDS | Weight 1 Montha | Weight 4 Monthsa | Weight 6 Monthsa | |
|---|---|---|---|---|---|---|
| miR-29c | −0.117 | −0.077 | 0.012 | −0.219 | −0.309b | −0.419c |
| miR-30a-5p | −0.053 | 0.095 | −0.044 | 0.023 | −0.002 | 0.154 |
| miR-99b | 0.112 | 0.011 | 0.092 | −0.036 | −0.019 | −0.069 |
| miR-103 | −0.055 | −0.163 | 0.004 | −0.156 | −0.220 | −0.238 |
| miR-122 | −0.040 | −0.163 | 0.002 | 0.014 | −0.126 | −0.089 |
| miR-128a | 0.020 | −0.069 | 0.014 | −0.312b | −0.296b | −0.332b |
| miR-130a | −0.127 | −0.126 | −0.006 | −0.017 | −0.159 | −0.160 |
| miR-150 | 0.088 | 0.189 | 0.126 | 0.104 | 0.092 | −0.014 |
| miR-193b | 0.168 | 0.039 | 0.099 | −0.075 | −0.169 | −0.182 |
| miR-221 | −0.006 | −0.140 | −0.162 | −0.140 | −0.230 | −0.307b |
| miR-324-3p | −0.144 | −0.125 | 0.008 | −0.094 | −0.111 | −0.215 |
| miR-340 | −0.245b | −0.107 | −0.218 | 0.041 | −0.096 | −0.173 |
| miR-370 | 0.235 | −0.031 | 0.025 | 0.020 | 0.132 | 0.094 |
| miR-375 | −0.051 | −0.132 | −0.064 | 0.078 | −0.128 | −0.180 |
| miR-423-5p | −0.122 | −0.248b | −0.081 | −0.125 | −0.210 | −0.157 |
| miR-625 | 0.001 | 0.088 | 0.057 | −0.033 | −0.166 | −0.113 |
| miR-652 | −0.287b | −0.267b | −0.179 | −0.095 | −0.227 | −0.246 |
| miR-885-5p | 0.040 | −0.064 | 0.036 | −0.113 | −0.170 | −0.125 |
Data are obtained by Person Correlation analysis.
n = 42.
P ≤ .05.
P ≤ .01.
Decreased levels of miR-340 (r = −0.245, P = .05) and miR-652 (r = −0.287, P = .02) associated with higher placental weight. Decreased levels of miR-423–5p (r = −0.248, P = .04), miR-652 (r = −0.267, P = .03) associated with higher birth weight SD score (SDS).
On infants' follow-up, decreased levels of miR-29 associated with increased weight at 4 months (r = −0.309, P = .03) and 6 months (r = −0.419, P = .002). Decreased levels of miR-128a associated with increased weight at 1 month (r = −0.312, P = .02), 4 months (r = −0.296, P = .03), and 6 months of age (r = −0.332 P = .01). Decreased levels of miR-221 (r = −0.307, P = .007) associated with decreased weight at 6 months of age.
In a multiple regression analysis adjusting for gestational age, maternal age, pregestational BMI, maternal weight gain, and newborn's gender, miR-340 (B = −0.270, P = .01) and miR-652 (B = −0.274, P = .02) were independent predictors of placental weight and together with birth weight explained nearly 35% of its variance. Both miR-652 (B = −0.288, P = .01) and miR-423–5p (B = −0.269, P = .02) were independent predictors of birth weight and together with gestational age explained nearly 20% of its variance. In a similar analysis, miR-128a (B = −0.474, P = .001) and miR-221 (B = −0.302, P = .05) were independent predictors of weight at 6 months and together with birth weight explained 29.3% and 17.2% of its variance, respectively (Table 5).
Multivariate Regression Analyses of Growth Parameters as Dependent Variables in All Pregnant Women Enrolled in This Study.
| Placental Weight | Birth Weight | Weight 6 Months# | ||||
|---|---|---|---|---|---|---|
| β | P Value | β | P Value | β | P Value | |
| miR-128-a | −.474 | .001 | ||||
| Birth weight | −.322 | .023 | ||||
| Adjusted Rb | .293 | |||||
| miR-221 | −.302 | .05 | ||||
| Birth weight | .414 | .006 | ||||
| Adjusted Rb | 0.172 | |||||
| miR-340 | −.270 | .01 | ||||
| Birth weight | .501 | <.0001 | ||||
| Adjusted Rb | .350 | |||||
| miR-423–5p | −.269 | .02 | ||||
| EG | .262 | .03 | ||||
| Adjusted Rb | .169 | |||||
| miR-652 | −.274 | .02 | −.288 | .01 | ||
| EG | .440 | <.0001 | .253 | .03 | ||
| Adjusted Rb | .353 | .179 | ||||
Nonpredicted variables include the following: gestational age, maternal age, newborn's gender, pregestational BMI, and maternal weight gain.
Discussion
We have previously described the pattern of circulating miRNAs in human obesity in children (20) and in adults with different degree of obesity (21). We herein provide the first evidence, to our knowledge, of specific plasma miRNA profiles in pregnant women with pregestational and gestational obesity compared with control pregnancy. We identified 13 circulating miRNAs up- and down-regulated in pregestational and gestational obesity among which miR-30a-5p, miR-103, miR-130a, miR-221, miR-324–3p, and miR-652 also associated with pregnancy weight gain. Several of these miRNAs including miR-122, miR-221, miR-340, miR-375, miR-423–5p, and miR-652 closely associated with metabolic parameters during gestation. We also report that miR-29c, miR-128a, miR-221, miR-340, miR-423–5p, and miR-652 were independent predictors of pre- and/or postnatal growth.
Altered circulating miRNA profile in maternal obesity
Our results showed nine miRNAs differentially expressed in GestOB and four miRNAs differentially expressed in both GestOB and PregestOB. Among them, miR-30a-5p and miR-130a were increased in GestOB, were associated with weight gain, and were found to have good or acceptable discriminatory accuracy for gestational obesity. Instead, miR-103 and miR-221 were decreased in GestOB, and miR-324–3p and miR-652 were decreased in both GestOB and PregestOB, were associated with lower weight gain, and were found to have good or acceptable discriminatory accuracy for gestational obesity. No miRNAs were exclusively differentially expressed in PregestOB, suggesting that it is gestational obesity and pregnancy weight gain which play preeminent roles in the regulation of circulating miRNAs during gestation.
A link between some of the herein identified miRNAs (miR-30a-5p, miR-103, miR-130a, and miR-221) and obesity has been previously reported. miR-30a-5p is known to be a proangiogenic miRNA and to be down-regulated after high-fat diet-induced obesity in mice (23). miR-103 was reduced in both obese women and men (24) and was associated with insulin signaling regulatory pathways (25). miR-130a was reported to be an important regulator of adipogenesis by targeting peroxisomal proliferator-activated receptor-γ mRNA and to be a miRNA that is induced during the proinflammatory response (26). miR-221 was decreased in prepubertal children (20) and morbid obese patients (21) and was associated with obesity-related inflammatory status (27). The remaining of the differentially expressed miRNAs have not been previously reported to be related to either adipogenesis or obesity. These include miR-324–3p and miR-652. miR-324–3p has been reported as a inducer of proinflammatory transcription factor nuclear factor-κB and was related to inflammation and cell death in the central nervous system (28). miR-652 has a role in the mediation of inflammatory processes in distinct cellular compartments involved in the pathogenesis of liver cirrhosis (29). The fact that these miRNAs were decreased in both GestOB and PregestOB and their relationship with inflammation might represent a response mechanism related to inflammatory conditions and might have a predictive value in acute and chronic inflammatory disease states. Thus, the importance of our study is that it suggests new miRNA players in the field of obesity. Further experimental investigation is warranted in order to describe them as potential pharmaceutical targets in this condition.
miRNAs in metabolism and energy homeostasis
miRNAs have been recognized as a class of epigenetic regulators of metabolism and energy homeostasis. Our results showed that several of the studied miRNAs including miR-122, miR-221, miR-340, miR-375, miR-423–5p, and miR-652 closely associated with metabolic parameters during gestation. Some of these associations are in accordance with previous studies. The liver specific miR-122 is a significant regulator of hepatic lipid metabolism (30). In addition to be linked to measures of fat mass (21), as we discussed before, miR-221 plays a role in diabetes-induced endothelial dysfunction (31). miR-340 was identified in pathophysiological heart conditions and was predicted to target genes of IGF-1 receptor signaling, which activates two pathways related to glucose regulation (32). The pancreatic islet-specific miR-375 has been heralded as a riboregulator of glucose homeostasis (33). miR-423–5p was decreased in type 2 diabetes patients and independently associated with fasting glucose tolerance (34). Again, the association of miR-652 and metabolic parameters has not been previously reported; however, its relationship with chronic liver disease (29) suggest a possible role in energy homeostasis.
miRNAs in pre- and postnatal growth
There is now considerable evidence that maternal overnutrition strongly influences the risk of developing obesity in later life. This influence cannot be explained solely by genetic and lifestyle factors but possibly also by epigenetic modifications during pregnancy (7). We herein identified six miRNAs that to our knowledge have not previously been related to pre- or postnatal growth in humans or rodents. Among them, miR-340, miR-423–5p, and miR-652 were independent predictors of placental weight or birth weight. As seen before, all these miRNAs associated with metabolic parameters in pregnancy. It is well known that maternal obesity has a significant impact on the placenta, inducing insulin resistance and a low-grade inflammatory response, which may impact also on placental and fetal growth (35). We hypothesize that miR-340, miR-423–5p, and miR-652 could be involved in placental and fetal growth through the regulation of placental function.
In addition, miR-29c, miR-128a, and miR-221 were independent predictors of weight during the postnatal 6-month follow-up. Further supporting our results is the fact that the miR-29 family was shown to modulate intracellular insulin signaling in 3T3-L1 adipocytes (36), and miR-29c was associated with spontaneous fetal arrest (37) and regulated growth in nasopharyngeal carcinoma (38). miR-128 has been described as a brain-enriched miRNA with a wide spectrum of targets in which the insulin/IGF signaling pathway and chemokine signaling pathway were the enriched categories (39). miR-211 decreased cell proliferation in liver cancer cells (40). The relationship of these miRNAs with cell proliferation and growth could suggest a possible role of these miRNAs in postnatal growth.
We acknowledge the limitations of our study. The cross-sectional nature of our study does not allow us to derive a causal relationship between circulating miRNAs and metabolism during pregnancy. However, the recognition of new biomarkers of metabolic diseases is also relevant from a clinical and public health perspective. Further evaluation in larger prospective trials is warranted to assess the potential diagnostic or prognostic value of these miRNAs, mainly in postnatal follow-up that was limited to 42 newborns (60% of the original study population) implying a risk for bias.
In conclusion, using a miRNA array approach in plasma samples from pregestational and gestational obese pregnant women compared with control pregnant women, we identified altered levels of 13 circulating miRNAs, some of which were related to metabolism and energy homeostasis and others associated with newborn's growth parameters. Our results lead to the identification of novel altered regulatory miRNAs in gestational obesity and to the description of circulating miRNAs as early markers for pre- and postnatal growth. It opens the possibility that interventions that modify these miRNAs may modify the deleterious effect of gestational obesity on either the mother or her offspring.
Acknowledgments
We are grateful to all the women and their newborns who took part in the study. J.M.-M. is an investigator of the Sara Borrell Fund from Instituto de Salud Carlos III National Institute of Health (Madrid, Spain). M.G-M. is a European Foundation for the Study of Diabetes/Lilly researcher fellow. F.d.Z. is a Senior Investigator of the Clinical Research Fund of the Leuven University Hospital, Belgium. L.I. is a Clinical Investigator of Centro de Investigación Biomédica en Red de Diabetes y Enfermedades Metabólicas (Spanish Biomedical Research Centre in Diabetes and Associated Metabolic Disorders) from Instituto de Salud Carlos III National Institute of Health (Madrid, Spain). A.L.-B. is an Investigator of the I3 Fund for Scientific Research (Ministry of Economy and Competitiveness, Spain). J.B. is an investigator of the Miguel Servet Fund from Instituto de Salud Carlos III National Institute of Health (Madrid, Spain; MS12/03239).
This work was supported by grants from the Ministerio de Ciencia e Innovación, Instituto de Salud Carlos III, Madrid, Spain (Grants MS12/03239 and PI14/01625 [to J.B.] and Grant PI13/01257 [to A.L.-B.]), projects cofinanced by the Fondo Europeo de Desarrollo Regional.
Disclosure Summary: The authors have nothing to disclose.
Abbreviations
- AUC
area under the curve
- BMI
body mass index
- HbA1c
glycated hemoglobin
- HDL
high-density lipoprotein
- HOMA-IR
homeostasis model assessment index of insulin resistance
- miRNA
microRNA
- SDS
SD score
- TG
triglyceride.
