


GH stimulation testing is limited by poor specificity and reproducibility in identifying GH deficiency. Intravenous line placement (IVP) in pediatrics may be a stimulus for GH secretion.
The objective of the study was to determine whether the measurement of GH at baseline as well as 15 and 30 minutes after IVP detects additional patients with sufficient peak GH concentrations who are not identified by a subsequent insulin tolerance test (ITT).
The ITT protocol was modified to include GH measurement at the time of IVP (t = 0) and 15 (t = 15) and 30 (t = 30) minutes later. Insulin was administered at t = 30, and an ITT was performed as per standard protocols. Children were grouped according to the indication for ITT: initial evaluation of GH deficiency (group 1); and GH deficiency at transition to adulthood (group 2).
Ninety-seven patients were included (76 in group 1, 21 in group 2). Of these, 27 (28%) had a peak GH concentration of 7 ng/mL or greater (19 in group 1, eight in group 2) either after IVP or ITT. Thirteen subjects (11 in group 1, two in group 2) had GH concentrations of 7 ng/mL or greater after IVP, without exceeding this on a subsequent ITT. Among the 11 group 1 patients, three of these GH peaks of 7 ng/mL or greater occurred at t = 0, 5 at t = 15, and 5 at t = 30, including one patient who had a peak GH of 7 ng/mL or greater at all three time points.
Some children will not have a sufficient GH response to pharmacological stimuli but will have a robust response to IVP. We recommend GH measurement after IVP in children undergoing GH stimulation testing, particularly when there is a delay between IVP and the administration of the pharmacological stimulus.
The clinical presentation of faltering growth can overlap with diseases affecting most pediatric systems, (1), and isolated GH deficiency (GHD) is one potential diagnosis associated with this presentation. Current consensus guidelines for diagnosing GHD include the interpretation of height both absolutely and relative to the heights of the parents and siblings, height velocity, bone age, serum IGF-1 and serum IGF binding protein 3 (IGFBP-3), and GH stimulation tests (GHSTs) (2, 3). Variations in the diagnostic criteria used for GHD have resulted in the reported prevalence ranging widely from between 1 in 1800 to 1 in 30 000 (4–6).
Limitations in the interpretation and reproducibility of GHSTs represent a significant challenge in the diagnosis of GHD (7). The arbitrary cutoff of stimulated GH secretion that is used to signify an appropriate response is generally between 5 and 10 ng/mL. These thresholds were developed using GH measurements by polyclonal assays, and there is variability between these measurements and modern monoclonal assays (8). There is also assay variability in GH measurements between monoclonal assays (9). The peak GH concentration threshold for treatment also has increased with the development of recombinant human GH (10). There is also significant interindividual variation in GH pharmacokinetics, resulting in measured serum GH concentrations not necessarily reflecting secreted GH (11). The sensitivity of a stimulated GH peak below 10 ng/mL for detecting prepubertal children who will have a response of height increasing by 0.5 SD score within 1 year is 82%. However, the specificity for these parameters is 24% (12). Consequently, many children who receive GH therapy do not have a significant growth response to treatment.
Various stimuli of GH secretion are used in the clinical evaluation of GH reserve, of which insulin-induced hypoglycemia is considered to be the gold standard (13). There are variations in protocols used for the timing of GH and cortisol measurement during the insulin tolerance test (ITT), with most recommending the measurement of GH, cortisol, and glucose at baseline and 30, 60, and 90 minutes after insulin administration and some recommending additional measurements within the first 40 minutes (14–16). Serious adverse events have been reported with the inappropriate management of hypoglycemia associated with these GHSTs (17), and insulin is less frequently used as a result. Only one-fifth of clinicians in the United States currently use the ITT routinely (18), whereas two-thirds of pediatric endocrinologists in Europe use this as either their first- or second-choice GHST (19). Like other GHSTs, the ITT has poor specificity for GHD. Almost a quarter of normally growing children without clinical features of GHD have a peak GH concentration of less than 7 ng/mL during this test, and almost half have a peak serum GH concentration of less than 10 ng/mL (20).
Nonpharmacological stimuli of GH secretion at the time of GHST have also been identified. As early as 1968, Kaplan et al (21) identified “excitement alone” as a stimulus for GH secretion that can complicate provocative testing. In their study of 134 children, 53 of whom had hypopituitarism, 18 (22%) of the children without GHD had a fasting GH concentration of greater than 9 ng/mL prior to receiving insulin. The GH concentration prior to insulin administration was higher than that achieved by insulin induced hypoglycemia in eight of these. Of note, none of the children with hypopituitarism had a stimulated peak GH concentration of greater than 2.2 ng/mL in this study.
We hypothesized that iv line placement (IVP) stimulates GH secretion and may deplete GH reserve in some children undergoing a subsequent ITT. The aim of this study was to determine whether the measurement of GH at baseline as well as 15 and 30 minutes after IVP would identify additional GH-sufficient patients, not identified by subsequent ITT. As a secondary aim, we determined whether this were also relevant for cortisol response to ITT.
Materials and Methods
The ITT protocol was modified at Our Lady's Children's Hospital Crumlin (Dublin, Ireland) in 2012 to include additional serum GH measurements in the 30 minutes after IVP but prior to insulin administration. A retrospective chart review was performed including all children undergoing an ITT at this center between January 2013 and December 2014. This study was performed in accordance with the policies and procedures of the Institutional Review Board of Our Lady's Children's Hospital (Dublin, Ireland) for a retrospective chart review.
Baseline evaluation
IGF-1 was measured by an enzyme-labeled chemiluminescent immunometric assay (Immulite 2000 Xpi; Siemens Healthcare Diagnostics). Z-scores were reported according to laboratory standards using chronological age and gender reference data. GH, cortisol, and IGFBP-3 were also measured by enzyme-labeled chemiluminescent immunometric assays (Immulite 2000 Xpi; Siemens Healthcare Diagnostics). Bone age was performed and read by radiologists using the standards of Greulich and Pyle (22).
Insulin tolerance test protocol
According to the protocol in this institution, all prepubertal patients with a bone age over 10 years underwent sex steroid priming prior to an ITT. Variations in practice regarding sex steroid priming have been reported, and similar criteria to those used in this study for sex steroid priming are used in many centers internationally (19). Sex steroid priming for males consisted of one 100-mg dose of im T 10 days prior to the test and for females consisted of oral ethinyl estradiol 10 μg daily for 3 days prior to the test.
Children fasted for 12 hours prior to undergoing the ITT. Ethyl chloride topical analgesia spray was used prior to insertion of an iv catheter. If placement was unsuccessful, this procedure was repeated with the repeat use of analgesia spray. One iv line was placed 30 minutes prior to insulin administration, and this was used for insulin administration as well as GH and cortisol sampling.
Serum GH and cortisol were measured at the time of IVP and again 15 and 30 minutes later (t = −30, −15, and 0). Insulin (0.1 μ/kg) was administered 30 minutes after IVP (t = 0), and GH, cortisol, and glucose concentrations were measured at 15, 25, 35, 60, and 90 minutes after the insulin administration. A glucose concentration of less than 45 mg/dL after the insulin administration was required for the test to be included in this study.
Retrospective chart review procedure
Medical records were reviewed and weights, heights, pubertal stages, parental heights, and comorbidities were recorded. IGF-1, IGFBP-3, and bone age results were recorded. Puberty was defined as breast Tanner stage of 2 or greater in females or testicular volume of 4 mL in males. Patient information was tabulated anonymously and maintained on a password-protected file on a secure server.
Statistical analysis
Patients were categorized according to the indication for ITT. Children undergoing an initial evaluation of possible GHD were assigned to group 1. Patients treated with GH who had completed linear growth and were undergoing ITT to determine whether they had persistent GHD were assigned to group 2. Peak stimulated GH concentrations of groups 1 and 2 were analyzed separately, but peak-stimulated cortisol was analyzed in both groups together. This distinction was made because many guidelines use different cutoff thresholds for stimulated peak GH in these two patient groups (2, 13, 23), whereas the thresholds for peak-stimulated cortisol concentrations is similar in both groups.
The height and weight Z-scores at the time of stimulation test were generated using the World Health Organization standards (24), using STATA/SE version 12.0 (StataCorp). All data analyses were performed using SPSS version 22.0 (IBM). Figures were generated using Prism 5.0 (GraphPad Software Inc) and Adobe Illustrator 16.0 (Adobe Systems Inc).
Results
During the study period, 97 patients underwent 99 ITTs. Two tests were repeated because the initial test did not induce hypoglycemia below 45 mg/dL and were not included in the analysis. Of the 97 patients, 76 were evaluated for a possible new diagnosis of GHD (group 1), and 21 had been treated for pediatric GHD, completed linear growth, and were evaluated at transition for adult GHD (group 2). The demographics of the patients who underwent testing are shown in Table 1. In the children in group 1, the mean (SD) baseline IGF-1 Z-score was −1.2 (0.9) and bone age was delayed by 1.4 (1.9) years.
Demographics of the Patients Undergoing Insulin Tolerance Testing in This Study
| Group 1 (Initial Evaluation) (n = 76) | Group 2 (Transition) (n = 21) | |
|---|---|---|
| Age, y | 10.9 (3.7) | 17.1 (1.2) |
| Male, % | 58 (76.3%) | 16 (76.2%) |
| Pubertal, % | 24 (31.6%) | 21 (100%) |
| Comorbidity | ||
| None | 48 (63.2%) | 11 (52.4%) |
| Hypopituitarisma | 4 (5.3%) | 1 (4.8%) |
| CNS mass or malignancy diagnosis | 4 (5.3%) | 5 (23.8%) |
| SGA | 3 (3.9%) | 0 |
| Genetic syndrome or dysmorphism | 8 (10.5%) | 0 |
| Other Dx (not associated with GHD) | 7 (9.2%) | 4 (19%) |
| Height Z-score | −2.46 (0.96) | −0.73 (0.88) |
| Weight Z-score | −1.75 (1.37) | −0.08 (1.27) |
| Midparental height Z-score | −0.29 (0.78) | 0.22 (0.73) |
| Midparental height Z-score minus height Z-score | 2.18 (0.85) | 0.22 (0.73) |
Abbreviation: Dx, diagnosis; SGA, small for gestational age. Continuous variables are presented as mean (SD).
Children classified as having hypopituitarism have two or more anterior pituitary hormone deficiencies.
Serial GH measurement after the IVP and prior to the insulin administration increased the number of children passing the stimulation test from 8 of 76 (10.5%) to 19 of 76 (25%) if a threshold of 7 ng/mL was used (Table 2). Many patients in group 1 had peak stimulated GH concentrations above thresholds of 3 ng/mL, 5 ng/mL, and 7 ng/mL 15 minutes after the IVP (Figure 1), demonstrating that this measurement might identify additional children with sufficient GH secretion.
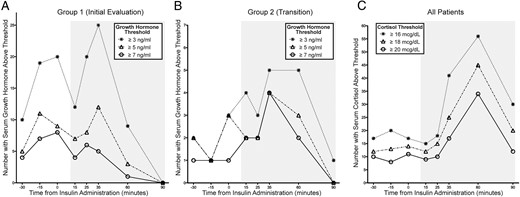
The number of patients with GH (A and B) or cortisol concentrations above the defined thresholds in the 30 minutes after iv line placement (time −30 to 0) and after insulin administration (time 15–90 min, shown with a gray background).
The iv line was placed at time −30 minutes, and insulin was administered at time 0 minutes.
The Number of Tests With Peak-Stimulated GH Concentrations Greater Than 3 ng/mL, 5 ng/mL, and 7 ng/mL After iv Line Placement, Insulin Administration, or Both
| Group 1 (Initial Evaluation) (n = 76) | Group 2 (Transition) (n = 21) | All (n = 97) | |
|---|---|---|---|
| Peak GH ≥ 3 ng/mL | |||
| None | 30 | 11 | 41 |
| Intravenous line only | 13 | 1 | 14 |
| Insulin-induced hypoglycemia only | 18 | 7 | 25 |
| Both | 15 | 2 | 17 |
| Peak GH ≥ 5 ng/mL | |||
| None | 48 | 12 | 60 |
| Intravenous line only | 10 | 3 | 13 |
| Insulin-induced hypoglycemia only | 11 | 6 | 17 |
| Both | 7 | 0 | 7 |
| Peak GH ≥ 7 ng/mL | |||
| None | 57 | 13 | 70 |
| Intravenous line only | 11 | 2 | 13 |
| Insulin-induced hypoglycemia only | 5 | 6 | 11 |
| Both | 3 | 0 | 3 |
| Peak Cortisol ≥ 18 μg/dL | |||
| None | 31 | 9 | 40 |
| Intravenous line only | 2 | 2 | 4 |
| Insulin-induced hypoglycemia only | 33 | 7 | 40 |
| Both | 10 | 3 | 13 |
Of the 11 children with peak GH concentrations of 7 ng/mL or greater after the IVP only, all were being investigated for isolated GHD and none had a coexisting risk factor for deficiency such as central nervous system (CNS) malignancy or hypopituitarism. Three of these children had peak GH concentrations at the time of the IVP, five peaked 15 minutes later, and five peaked 30 minutes later (Figure 2). Only one of these children had peak GH concentrations of 7 ng/mL or greater at more than one of these time points. This group had a mean (SD) age of 11.6 (3.9) years, an IGF-1 Z-score of −1.3 (1.0), IGFBP-3 Z-score of 0.8 (1.3), midparental height Z-score of −0.04 (0.8), height Z-score of −2.4 (0.9), weight Z-score of −2.1 (0.8), bone age delay of 0.6 (2.1) years, and peak cortisol on ITT of 20.6 (3.5) μg/dL. These were not significantly different from the age (10.2 [3.8], P = .4), IGF-1 Z-score (−1.2 [0.9], P = .6), IGFBP-3 Z-score (1 [1], P = .9), midparental height Z-score (−0.3 [0.8], P = .3), height Z-score (−2.5 [1], P = .9), weight Z-score (−1.7 [1.4], P = .6), bone age delay (1.6 [1.9] years, P = .2), or peak cortisol on an ITT (18.7 [5.7] μg/dL, P = .2) of the other children in group 1.

The serum GH concentration profiles in children in group 1 whose peak GH concentration was 7 ng/mL or greater at 0 (A), 15 (B), and 30 (C) minutes from the iv line insertion without a subsequent peak of 7 ng/mL or greater after insulin administration.
Each symbol and line represent the GH profile in one patient. Note that one patient had GH concentrations of 7 ng/mL or greater at each of these time points and is represented in each diagram.
Serial measurement of GH concentrations after the IVP in group 2 had a less significant effect on the number of patients reaching a predefined threshold GH concentration. The number of patients passing the test increased from 9 of 21 (42.9%) to 10 of 21 (47.6%) if a threshold of 3 ng/mL was used or from 6 of 21 (28.6%) to 8 of 21 (38.1%) if a threshold of 7 ng/mL was used (Figure 1 and Table 2). The total number of patients in both groups 1 and 2 combined with a peak stimulated cortisol concentration of 18 μg/dL or greater increased from 57 of 97 (58.8%) to 61 of 97 (62.9%) with serial measurement before the insulin administration. This represents an increase in specificity of 6.5%.
Peak GH concentration after the IVP did not correlate closely with peak GH after ITT (group 1, R2 = 0.05; group 2, R2 = 0.002). In contrast, the peak cortisol concentration prior to insulin administration was more closely related to the peak cortisol concentration during ITT (group 1, R2 = 0.26; group 2, R2 = 0.41) (Figure 3).
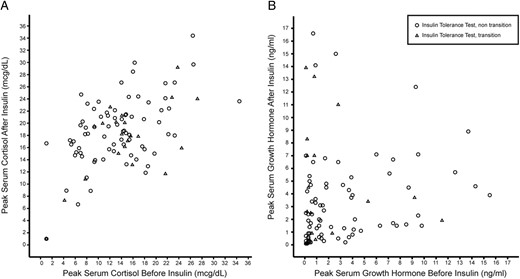
Peak cortisol (A) or GH (B) in the 30 minutes prior to insulin administration plotted against the peak after administration of insulin.
Discussion
We have demonstrated that many children undergoing an evaluation for GHD can have a peak GH concentration greater than 7 ng/mL within 30 minutes of the IVP, even without pharmacological stimulation. The subsequent insulin-induced hypoglycemia during the ITT does not always replicate this peak-stimulated GH concentration. As a result, the serial measurement of GH concentration after the IVP may identify additional children with GH sufficiency who would not have been detected by a subsequent ITT alone. Similar additional serial measurements of cortisol do not add significantly to the identification of children with adrenal sufficiency using the ITT.
The hospital environment and IVP may represent stressors to the child undergoing GHSTs, and stress may be a stimulus for GH secretion (25). Some authors have recommended that patients be admitted the night before a GHST to acclimatize to the environment and optimize the utility of the test (26). However, this is often impractical due to limited hospital resources, and most centers perform these tests in the outpatient setting, often completing two separate tests on the same day (27). We have shown that frequent GH measurement after an IVP should be considered in the context of GHSTs being performed as a day procedure.
Thirteen children in this study (11 of 76 in group 1 and 2 of 21 in group 2) had a peak GH concentration greater than 7 ng/mL after the IVP without a subsequent response of similar magnitude to insulin-induced hypoglycemia. Although we have performed this analysis only in children undergoing an ITT, it is likely that this phenomenon is seen with IVP prior to the administration of alternative GH secretagogues. It is not clear whether a peak-stimulated GH prior to the ITT will reduce the likelihood of a subsequent response to the ITT, and there are children in this study with the peak GH concentrations above the thresholds after both of the sequential stimuli. However, it is possible that a GH peak can have a negative effect on subsequent stimuli. In adult volunteers, sequential stimuli of GH secretion can result in an attenuated response to the second stimulus, although this is less pronounced when insulin-induced hypoglycemia is the second stimulus (25). Similarly, the GH response to frequent bouts of heavy exercise is attenuated when the duration between these is reduced to less than 1 hour (28). Possible mechanisms for the reduction in GH response to a second stimulus include depletion of immediately releasable pituitary GH by the first stimulus or an effect of GH autoregulation. GH inhibits GHRH production through direct negative feedback and through the production of somatostatin and IGF-1 (29), both of which exert negative feedback on hypothalamic GHRH production and pituitary GH exocytosis (30).
Many of the limitations of this study are due to the nature of retrospective chart review. Whereas a large proportion of children categorized as having GH insufficiency on a GHST will not respond to GH treatment, there are also children who have sufficient GH secretion and respond well to GH treatment. It seems likely that the children who responded to the IVP with a GH value greater than 7 ng/mL are truly GH sufficient, but this assumption cannot be verified because there is no gold standard test for GHD. In this center, a stimulated GH threshold of greater than 7 ng/mL was used to determine whether GH was prescribed. Thus, we cannot determine whether additional GH measurement reduced the sensitivity of the provocative test for GH-responsive short stature. We also note that 37% of the children in this study did not have a peak cortisol concentration greater than 18 μg/dL. This may be due to the heterogenous group of patients included, many of whom had hypopituitarism or a CNS malignancy. In addition, we note that many children without adrenal insufficiency will have a peak-stimulated cortisol of less than 18 μg/dL on the ITT (31).
The additional benefit of serial GH measurement after the IVP shown in this study may be ameliorated by variations in practice elsewhere. As previously mentioned, the specificity of a single GHST for GHD is poor, and many centers perform two tests to improve this specificity. The use of a second stimulation test in the patients described in this study may have detected more of the children with peak GH concentrations above the threshold after the IVP. There is no consensus regarding sex steroid priming prior to a GHST in prepubertal children, but the practice of using this for children with bone ages greater than 10 years is consistent with many centers (19). Sex steroid priming in younger prepubertal children may increase the specificity of the GHST for GHD (32), and it is possible that serial GH measurement after the IVP would provide less additional benefit if sex steroid priming was used in all prepubertal children undergoing a GHST. Thus, the results of this study should be interpreted in the context of serial measurements after an IVP with a single stimulation test in a center at which sex steroid priming is used only in limited circumstances. Specifically, we report that serial GH measurement after an IVP detected 13 children (13.4%) with a peak-stimulated GH concentration of greater than 7 ng/mL, but it is not known whether these children would have otherwise been detected in combination with a second GHST or sex steroid priming.
In conclusion, we advise caution when performing GHSTs because delays in GH measurement may increase the number of patients misclassified as having insufficient GH secretion. If the GH secretagogue or stimulus is administered immediately after an IVP, it is important to ensure that there are frequent additional measurements in the first 30 minutes after the placement and administration of the GH provocative test substance. Also, if there is any delay in administering the iv stimulus after the IVP, the frequent sampling of GH in the first 30 minutes after the IVP should be performed.
Acknowledgments
We are grateful to Mary Molloy and Emer Lawlor (Department of Clinical Biochemistry, Our Lady's Children's Hospital, Crumlin, Ireland) for advice regarding assays used in the clinical care of these patients.
C.P.H. is supported by a PhD grant from the National Children's Research Centre (Dublin, Ireland).
Disclosure Summary: A.G. serves on the Steering Committee of the Pfizer International Growth Study Database. The other authors have nothing to disclose.
Abbreviations
- CNS
central nervous system
- GHD
GH deficiency
- GHST
GH stimulation test
- IGFBP-3
IGF binding protein 3
- ITT
insulin tolerance test
- IVP
iv line placement.
