


Thyroid carcinoma is a frequent complication of childhood cancer radiotherapy. The dose response to thyroid radiation dose is now well established, but the potential modifier effect of other factors requires additional investigation.
This study aimed to investigate the role of potential modifiers of the dose response.
We followed a cohort of 4338 5-year survivors of solid childhood cancer treated before 1986 over an average of 27 years. The dose received by the thyroid gland and some other anatomical sites during radiotherapy was estimated after reconstruction of the actual conditions in which irradiation was delivered.
Fifty-five patients developed thyroid carcinoma. The risk of thyroid carcinoma increased with a radiation dose to the thyroid of up to two tenths of Gy, then leveled off for higher doses. When taking into account the thyroid radiation dose, a surgical or radiological splenectomy (>20 Gy to the spleen) increased thyroid cancer risk (relative risk [RR] = 2.3; 95% confidence interval [CI], 1.3–4.0), high radiation doses (>5 Gy) to pituitary gland lowered this risk (RR = 0.2; 95% CI, 0.1–0.6). Patients who received nitrosourea chemotherapy had a 6.6-fold (95% CI, 2.5–15.7) higher risk than those who did not. The excess RR per Gy of radiation to the thyroid was 4.7 (95% CI, 1.7–22.6). It was 7.6 (95% CI, 1.6–33.3) if body mass index at time of interview was equal or higher than 25 kg/m2, and 4.1 (95% CI, 0.9–17.7) if not (P for interaction = .1).
Predicting thyroid cancer risk following childhood cancer radiation therapy probably requires the assessment of more than just the radiation dose to the thyroid. Chemotherapy, splenectomy, radiation dose to pituitary gland, and obesity also play a role.
Thyroid tissue is one of the most radiosensitive of human tissues (1). After acute external irradiation before age 15 years, the excess relative risk (RR) per Gy to the thyroid (ERR/Gy) is approximately 7 (2), decreasing with increasing age at the time of irradiation (2, 3). The risk for doses lower than 0.1 Gy could be higher than that extrapolated from higher doses. For example, in patients treated for tinea capitis, who received tens of cGy (4.5–49.5 cGy) to the thyroid in one or a few fractions, the estimated ERR/Gy is 20.2 (95% confidence interval [CI], 11.8–32.3) (4).
In a pooled analysis including 187 primary thyroid cancers following childhood cancer from two cohorts and two nested case-control studies, among which the large-scale U.S. Childhood Cancer Survivor Study (CCSS) (5, 6), radiation dose–related RR increased approximately linearly for <10 Gy, leveled off at 10–15-fold for 10–30 Gy, and then declined (7). This relative risk increased with decreasing age at exposure but did not vary with attained age or time since exposure and remained elevated 25+ years after childhood cancer. In this analysis, sex and number of treatments did not modify radiation effects. Another important result of this pooled analysis was a 3–4-fold increase in thyroid cancer risk after chemotherapy (alkylating agents, anthracyclines, or bleomycin) in patients without radiotherapy. In addition, the risk ascribable to chemotherapy decreased in patients treated with radiation as the thyroid dose increased.
We report here the incidence of thyroid cancer and its risk factors in the French/United Kingdom Euro2K cohort of childhood cancer survivors, which was included in the pooled analysis (7). Our aim was to investigate the potential modifier effect of irradiation of organs other than the thyroid, and of anthropometric factors and smoking habits on the risk of thyroid cancer occurrence associated with childhood cancer treatment.
Materials and Methods
Patients
A retrospective cohort of children treated in eight centers in France and the United Kingdom was set up between 1985 and 1995, comprising patients who were alive 2 (France) or 3 (UK) years after a first solid cancer diagnosed before the age of 16 years (before 15 years in UK centers) and before the year 1986. The method for compiling the cohort was first described in 1995 (8). In this first publication, the cohort included 4567 patients. From 1995 until 2009, some French patients were excluded because of diagnostic errors and duplicates, and some others were added who were initially missed because some medical records were not available at the time of the initial cohort constitution, but were discovered during a systematic investigation in Gustave Roussy archives performed afterward. The final database includes 4389 5-year survivors, of whom 3172 were treated in France.
Of these 4389 patients, 51 had been treated for thyroid cancer as a first cancer (45 in France; 6 in the UK) and were also excluded from the present analysis. The 4338 remaining patients were included in the present analysis, 3127 treated in France and 1211 in the United Kingdom (Supplemental Figure 1). Information on the treatments received for the initial cancer was abstracted from the clinical chart and radiotherapy files of the participating centers.
Followup of the 3127 French patients was initially assessed using medical records from treatment centers, and also via a self-completed questionnaire beginning September 1, 2005. This questionnaire, based on the British Childhood Cancer Survivor Study (BCCSS) (9), investigated most of the aspects of the medical, social, and economic outcomes of childhood cancer treatment, and was elaborated by a group of 10 specialists, including epidemiologists, pediatric oncologists, medical generalists, and sociologists. A total of 2480 patients were still alive and were therefore considered eligible for the questionnaire. A questionnaire was sent by regular mail to the 2195 patients for whom we had obtained the most recent address from the National Health Insurance System and who had sent back a signed consent agreement. This agreement included an authorization to contact the medical practitioner and medical facilities. A total of 1899 patients returned the completed questionnaire by December 31, 2012.
The 1211 United Kingdom patients also included in the BCCSS, which was later created (9), were monitored for the occurrence of thyroid cancer and death using the National Health Service Central Registers. Of these, 667 sent back a self questionnaire administered by their general practitioner.
All the second thyroid neoplasms were histologically confirmed, whatever the origin of their first registration (medical records or self questionnaire). Only clinical thyroid tumors requiring surgery were taken into account in the present analysis.
Radiation dosimetry
Only radiation therapy received 2 years or more before the end of followup or of thyroid cancer was considered. External radiotherapy was administered to 2692 patients, and 65 patients received brachytherapy ± external radiotherapy. The retrospective dosimetric estimation for external radiotherapy was calculated by reconstructing the radiation therapy conditions, from technical records of radiotherapy for 2608 patients, and from typical treatment for the remaining 84 (6% of patients treated by radiotherapy) for whom the technical records were either missing or incomplete. For each of these patients, the absorbed doses to anatomical organs/sites were estimated according to the patients' sex, age, and height at radiation and prescribed radiation therapy, using the homemade Dos_Eg_Software that we developed for retrospective dosimetry (10–13). All information on data, reliability, and validity of the methods used in this software to estimate the doses of radiotherapy absorbed to any organ located in or outside the radiation fields can be found in previous publications (10–13).
To establish fractionation effects, we considered all treatments administered on the same day as one fraction. This definition was acceptable because there was no hyperfractionated radiation therapy in the cohort. Among the 2608 patients who received radiotherapy and for whom the technical radiation therapy record was available, 69% had received one treatment course, 22% two, 6% three, and 3% received between four to eight courses.
Only doses received from external beam radiotherapy to the thyroid gland, the pituitary gland, the ovaries, and the spleen were considered in this analysis. The radiation dose to the thyroid was defined as the average of the radiation dose received by the center of the isthmus and of each of the two lobes. The mean dose of radiation to the thyroid for the 2692 patients who received external radiotherapy was 6.4 Gy whereas the median was 0.7 Gy (range, <0.001–72 Gy).
Chemotherapy quantification
Drugs were grouped into five classes according to their known mechanisms of action in the cell: vinca-alkaloids, antimetabolites, alkylating agents, anthracyclines, cytotoxic antibiotics, epipodophyllotoxins, and other drugs. Chemotherapy information could not be found for 18 patients. Analysis of the potential role of each type of drug within these classes was also performed. A detailed description of the chemotherapy received by the cohort is available in Supplemental Table 1.
Statistical methods
French patients were followed until the occurrence of thyroid cancer, return of the self questionnaire, or the date of last medical contact. British center patients were followed until the occurrence of thyroid cancer, death, or January 1, 2014.
Risk factors for thyroid carcinomas were first identified using Cox proportional hazard regression model (15). We performed also an external analysis to quantify the excess of thyroid cancer compared with that observed in the general population. The expected number of thyroid cancers was obtained for each sex, 5-year age group, and 5-year calendar period, by multiplying the reference incidence rates by the number of person-years at risk. As reference rates, we used estimates of the French national cancer incidence rates for patients treated at French centers (16) and the United Kingdom national cancer incidence rates for those treated in the United Kingdom (17). The standardized incidence ratio (SIR), calculated as the ratio of the observed number of thyroid cancers to the expected number, was assessed statistically by considering the observed number following a Poisson distribution (18). The absolute excess risk (AER) was calculated as the difference between the observed and expected number of thyroid cancers, divided by the number of person-years of followup and multiplied by 1000. Ratio of SIR adjusted for the previous identified risks of thyroid cancer were also calculated (multivariate analysis).
Standard radiobiological models were used to model variation in the excess relative risk per Gy (ERR/Gy) across varying doses of radiation using Epicure (19). Ninety-five percent confidence intervals (95% CIs) were estimated for parameters using the method of maximum likelihood (20). Dose-response modification (interaction) factors were tested with nested models. Analyses were systematically adjusted on the calendar year of childhood cancer diagnosis, to control for variations in the levels of ascertainment of thyroid cancer.
Results
The mean followup of the 4338 patients was 27 years after first cancer and 1560 were followed up for 30 years or more, of whom 1189 had received radiotherapy. Between 8 and 47 years after the first cancer, 55 patients developed a thyroid carcinoma requiring surgery. Of these, 39 occurred in French and four in United Kingdom patients who had sent back the self questionnaire, 11 were assessed from French medical records and one from the United Kingdom cancer registry (Supplemental Figure 1). The size (main diameter of the larger nodule) of the carcinomas ranged from 1–50 mm. Eight carcinomas were nonaggressive thyroid microcarcinomas (<10 mm without locoregional involvement or distant metastasis), of which three had a histological size of 1 mm but a clinical size of 10 mm or more. Of the 55 carcinomas, 25 presented lymph node metastases and one presented distant metastases at the time of discovery while one patient presented with both lymph node and distant metastases. The histology of the carcinomas was papillary (51 cases) or well-differentiated follicular (four cases).
The incidence of thyroid cancer was 20.0 times higher (95% CI, 15.2–25.8) than expected from the general population (Table 1) with a cumulative incidence of 2.4% (95% CI, 1.7–3.5%) 40 years after childhood cancer treatment. This very high increase compared with the general population was observed mainly 10–20 years after childhood cancer treatment (SIR = 35.3; 95% CI, 21.4–53.2) and decreased thereafter (SIR = 16.7; 95% CI, 11.8–22.7). However, the AER remained stable during followup (results not shown). Forty-nine carcinomas occurred in patients who had received radiotherapy for their first cancer, the 40-year cumulative incidence being 3.0% (95% CI, 2.1–4.2) 40 years after radiotherapy.
Multivariate Analysis of the Thyroid Carcinoma Risk in a Cohort of 4338 5-Year Childhood Cancer Survivors
| Characterisitc | No. Thyroid Carcinomas/Patients | Average Thyroid Radiation Dose, Gy | SIRa (95% CI) | Absolute Excess Risk per 1000 People per Year (95% CI) | RR (95% CI)b |
|---|---|---|---|---|---|
| All cohort | 55/4338 | 3.8 | 20.0 (15.2–25.8) | 0.43 (0.31–0.57) | |
| Sex | |||||
| Female | 30/1919 | 3.4 | 14.6 (10.0–20.5) | 0.49 (0.30–0.73) | 1.5 (0.9–2.5) |
| Male | 25/2429 | 4.1 | 35.7 (25.3–51.6) | 0.38 (0.25–0.56) | 1 (ref) |
| Nitrosoureas (BCNU or CCNU) | |||||
| No | 46/4089 | 3.6 | 17.5 (13.0–23.1) | 0.36 (0.26–0.51) | 1 (ref) |
| Yes | 9/249 | 7.2 | 67.9 (32.7–122.5) | 1.5 (0.70–2.8) | 6.6 (2.5–15.7) |
| Dose to pituitary gland >10 Gy | |||||
| No | 47/3497 | 3.1 | 21.3 (15.8–28.0) | 0.45 (0.32–0.62) | 1 (ref) |
| Yes | 8/841 | 6.3 | 14.5 (6.7–27.2) | 0.32 (0.12–0.64) | 0.2 (0.1–0.6) |
| Splenectomy or Rx dose to the spleen >20 Gy | |||||
| No | 33/3787 | 3.1 | 13.9 (9.7–19.2) | 0.28 (0.17–0.41) | 1 (ref) |
| Yes | 22/551 | 8.9 | 58.2 (37.2–86.1) | 1.4 (0.90–2.2) | 2.3 (1.3–4.0) |
| Average thyroid radiation dose, Gy | |||||
| No Rt | 6/1646 | 0 | 8.6 (3.4–17.5) | 0.12 (0.02–0.29) | 1 (ref) |
| >0–0.9 Gy | 9/1529 | 0.3 | 7.2 (3.3–13.5) | 0.14 (0.04–0.30) | 1.3 (0.5–4.2) |
| 1–4.9 Gy | 12/471 | 2.3 | 32.9 (17.6–55.1) | 0.80 (0.39–1.4) | 6.9 (2.4–21.4) |
| 5–19.9 Gy | 16/362 | 11.7 | 58.0 (34.2–109.5) | 1.6 (0.89–2.5) | 8.7 (3.2–26.4) |
| 20–39.9 Gy | 11/263 | 28.6 | 63.9 (33.2–109.5) | 1.6 (0.79–2.8) | 13.8 (4.5–45.5) |
| ≥40 Gy | 1/67 | 48.8 | 23.5 (1.3–103.7) | 0.59 (?-2.6) | 4.9 (0.3–32.0) |
Abbreviations: BCNU, bis-chloroethylnitrosourea [carmustine]; CCNU, 1-(2-Chloroethyl)-3-Cyclohexyl-1-Nitrosourea [lomustine].
Number of observed thyroid carcinoma divided by the expected number of thyroid carcinoma in the cohort, from the incidence in French and United Kingdom populations.
RR in a Poisson Regression adjusted for sex, date and age of diagnosis, country of treatment (UK/France), surgical or radiological (>20 Gy to the spleen) splenectomy, radiation dose to the pituitary and thyroid glands, nitrosourea administration, and attained age, compared with the SIR for nephroblastoma patients.
In a multivariate analysis (Table 1), women were at a nonsignificantly higher risk of thyroid cancer than men (RR = 1.5; 95% CI, 0.9–2.5), with this higher relative risk corresponding nevertheless to a lower increase of risk compared with the general population (Table 1). Thyroid carcinoma incidence strongly varied according to the type of first cancer with the SIR ranging from 7.3 (95% CI, 1.8–19.0) for brain tumors to 72.9 (95% CI, 43.5–113.2) for Hodgkin's disease. However, these differences did not remain significant when adjusting for age at first cancer, sex, country of treatment, splenectomy, radiation dose to the pituitary and to the thyroid gland, nitrosourea administration, and attained age (Table 2).
Thyroid Carcinoma Risk According to the Type of First Cancer, in a Cohort of 4338 5-Year Childhood Cancer Survivors
| First Cancer Type | No. Thyroid Carcinomas/Patients | Radiation Therapy, % | Thyroid Dose in Gy | SIR (95% CI) | Absolute Excess Risk per 1000 People per Year (95% CI) | Adjusted Ratio of SIR (95% CI)a | ||
|---|---|---|---|---|---|---|---|---|
| Mean | Median | Range | ||||||
| Nephroblastoma | 8/866 | 68 | 2.0 | 0.3 | <0.001–34.9 | 13.1 (6.0–24.3) | 0.29 (0.11–0.56) | 1 (ref) |
| Neuroblastoma | 8/580 | 49 | 3.2 | 0.3 | <0.001–54.1 | 25.5 (11.6–47.3) | 0.45 (0.17–0.91) | 2.4 (0.8–11.3) |
| Hodgkin's disease | 17/383 | 83 | 22.8 | 21.7 | <0.001–72.1 | 72.9 (43.5–113.2) | 1.77 (1.03–2.79) | 2.9 (1.0–14.8) |
| Non-Hodgkin lymphoma | 10/468 | 54 | 6.1 | 1.7 | <0.001–67.6 | 38.9 (19.5–68.2) | 0.81 (0.36–1.49) | 2.1 (0.5–6.9) |
| Soft tissue sarcoma | 3/547 | 63 | 3.8 | 0.3 | <0.001–71.7 | 8.2 (2.0–21.2) | 0.17 (0.03–0.49) | 1.3 (0.2–3.5) |
| Bone sarcoma | 2/274 | 62 | 3.0 | 0.2 | <0.001–61.7 | 9.3 (1.5–28.7) | 0.27 (0.03–0.93) | 0.8 (0.1–1.5) |
| CNS tumor | 3/707 | 70 | 5.6 | 1.2 | 0.1–55.9 | 7.3 (1.8–19.0) | 0.12 (0.03–0.90) | 0.7 (0.3–3.8) |
| Gonadal tumor | 3/233 | 35 | 5.1 | 0.6 | 0.1–51.7 | 16.0 (4.0–41.4) | 0.41 (0.13–1.22) | 1.4 (0.3–3.6) |
| Retinoblastoma | 0/147 | 65 | 1.0 | 0.2 | <0.001–38.4 | — | — | — |
| Other 1st cancers | 1/133 | 47 | 11.0 | 1.4 | <0.001–57.3 | 11.3 (0.6–49.7) | 0.07 (0.01–1.25) | 2.3 (0.3–20.5) |
Abbreviation: CNS, central nervous system.
Adjusted ratio of SIR: ratio of SIR, adjusted for sex, age in years for first cancer, country of treatment (UK/France), surgical or radiological (>20 Gy to the spleen) splenectomy, radiation dose to the pituitary and thyroid glands, nitrosourea administration, and attained age, compared with the SIR for nephroblastoma patients.
Chemotherapy as a whole did not increase the risk of thyroid cancer (RR = 1.0; 95% CI, 0.5–2.0), and did not modify thyroid radiation dose response (P = .8). None of the five classes of chemotherapy modified the risk of thyroid cancer nor modified thyroid radiation dose response (results not shown). However, the administration of nitrosoureas, belonging to the alkylating agents, was associated with a thyroid carcinoma relative risk of 6.6 (95% CI, 2.5–15.7) (Table 1).
As compared with patients who had not received radiation therapy, a higher risk was observed in those who had received between 20 and 39.9 Gy to the thyroid with the risk declining for higher radiation doses (Table 1, Figure 1). When modeling these variations in RR, a model including a linear term plus a negative exponential term of the square of the dose, for cell killing due to high radiation doses to the thyroid, fit the data more adequately than a purely linear model (P < .001). In this linear-exponential model, the linear coefficient of dose was 4.7 (95% CI, 1.7–22.6) (Figure 2). Adding a quadratic term to take into account such departures from the linear-exponential model did not improve the fit of the data (P = .6). No reduction in the risk, for a given total radiation dose to the thyroid, was observed when increasing the number of fractions (P = .5, whatever the threshold).
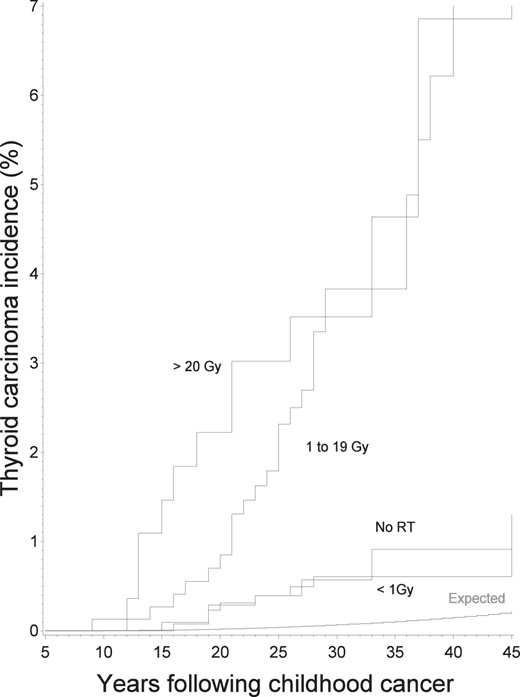
Expected and observed cumulative incidence of thyroid carcinomas according to time since first cancer and to radiation dose to the thyroid.
Expected represents the expected incidence in the cohort, according to incidence rates in general French and United Kingdom populations. Vertical bars represent the 95% CIs.
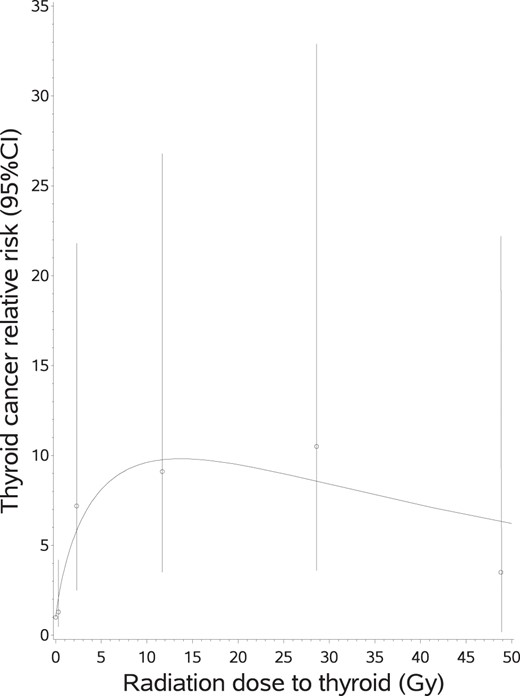
RR of thyroid cancer, and 95% CIs, according to radiation dose to the thyroid.
The curve is the equation: Relative risk = (1 + [4.75 × thyroid dose]) × (exp [−0.54 × sqrt (thyroid dose)]). Both observed and fitted RRs were adjusted for age in years for first cancer, sex, country of treatment (United Kingdom/France), surgical or radiological (>20 Gy to the spleen) splenectomy, radiation dose to the pituitary gland, nitrosourea administration, and attained age.
Radiation dose received by ovaries was not an independent risk factor for thyroid carcinoma, and to have received high radiation (> 5 Gy) to these organs did not modify the dose response between the radiation dose to the thyroid and the risk of thyroid carcinoma (P = .7).
Of the 551 patients who had received more than 20 Gy to the spleen (radiological splenectomy, 459 patients, 17 thyroid carcinomas) and/or who had a surgical splenectomy (124 patients, 7 thyroid carcinomas), 22 developed a thyroid carcinoma. Having had a surgical or a radiological splenectomy was an independent risk factor for thyroid carcinoma (Table 1). After taking this into account, splenectomy did not significantly modify (P = .5 for interaction) the dose response for thyroid radiation dose (Figure 3). Similar results were obtained when considering higher threshold for radiological splenectomy: RR = 2.7 (95% CI, 1.6–5.1) if using threshold of 40 Gy to the spleen (13 thyroid carcinomas among 22 patients).
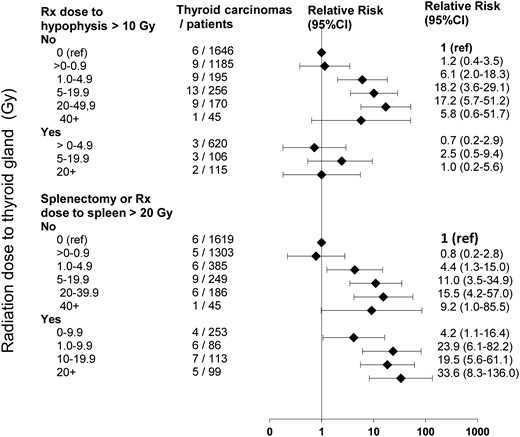
RR of thyroid carcinoma and 95% CIs according to radiation dose to thyroid for patients having experienced, or not, high radiation dose (10 Gy) to the pituitary gland radiation dose (upper) and surgical or radiological (20 Gy to the spleen) splenectomy (lower).
Adjusted for age in years for first cancer, sex, country of treatment (United Kingdom/France), nitrosourea administration, and attained age.
Regardless of the radiation dose received to the pituitary gland (± 10 Gy) the risk of thyroid cancer occurrence was significantly higher than expected in the general population. Overall, irradiation of the pituitary gland was found to be associated with a lower thyroid cancer risk and remained significant in the multivariate analysis; the risk for patients having received 10 Gy or more to the pituitary gland was 4.1 (95% CI, 1.8–10.6) times lower than the risk for the others (Table 1). In fact, pituitary gland irradiation did not decrease thyroid cancer incidence, but annihilated (P for interaction = .001) the effect of thyroid irradiation on thyroid carcinoma risk (Figure 3). Similar results were obtained for thresholds higher than 10 Gy.
A total of 196 patients treated in France (this information was not available for the United Kingdom) received GH, of whom one later developed a thyroid carcinoma.
Of the 2566 subjects who sent back their questionnaire, 43 developed a thyroid carcinoma. When adjusting on thyroid radiation dose and other factors listed in Table 1, thyroid cancer was 1.4 (95% CI, 0.7–2.7) fold less frequently reported in patients who sent back their questionnaire than in the others (P = .4). Among these former patients, the dose response to the radiation dose to the thyroid was very similar to the one in the whole cohort, with the linear coefficient being ERR/Gy = 4.9 (95% CI, 1.1–20.7). Being a current, former, or ever smoker did not significantly modify the thyroid cancer risk (P = .6), nor the dose response for radiation (P for interaction = .8) (Table 3). When analyzing body mass index (BMI) as a continuous variable, no significant relation between BMI and thyroid cancer risk was found (P = .3). Having a large body surface area (BSA) at time of self questionnaire was also not associated (P = .2) with a significant increase in thyroid cancer risk, but BMI and BSA modified, near from significantly, the dose response to thyroid radiation dose, which was approximately 2 times stronger in patients having BMI >= 25 (P for interaction = .1) and in those having a BSA larger than the median (P for interaction P = .08) (Table 3). Because only 25 thyroid carcinomas occurred in women who returned the self questionnaire, we were not able to investigate the potential role of hormonal and reproductive history.
Thyroid Carcinoma Risk Factors, According to Anthropometric Parameters in a Cohort of 2566 Patients Treated for Cancer During Childhood, Who Returned a Self Questionnaire
| Parameter | Thyroid Carcinomas/Patients | Average Radiation Dose to Thyroid in Gy | Own Effect on Thyroid Carcinoma Risk | Effect as Modifier of the Thyroid Radiation Dose Effect Modifier | ||
|---|---|---|---|---|---|---|
| Own Effect on Thyroid Carcinoma Risk | Modifier Effect on the Dose-effect Thyroid Radiation Dose Effect Modifier | |||||
| RRb (95% CI) | P Value | Interaction P Valuec | ||||
| All cohort | 43/2566 | 3.6 | — | — | 4.9 (1.1–20.7) | |
| Current smoker | ||||||
| No | 35/1830 | 4.2 | 1 (ref) | 5.2 (1.0–23.0) | .8 | |
| Yes | 8/736 | 2.4 | 0.75 (0.32–1.6) | 0.6 | 4.6 (1.0–20.7) | |
| BMI | ||||||
| <25 | 30/1789 | 3.4 | 1 (ref) | 4.1 (0.9–17.7) | .1 | |
| ≥25 | 13/777 | 4.1 | 1.4 (0.7–2.8) | 0.3 | 7.6 (1.6–33.3) | |
| Body surface area | ||||||
| < Mediana | 23/1335 | 4.0 | 1 (ref) | 3.3 (0.5–15.4) | .08 | |
| ≥ Median | 20/1231 | 3.2 | 1.5 (0.8–2.9) | 0.2 | 6.5 (1.3–28.0) | |
Median value: 3.0 m2 for women and 3.5 m2 for men.
RR and ERR per Gy of average radiation dose to the thyroid gland (ERR/Gy) adjusted for age in years for first cancer, sex, country of treatment (UK/France), surgical or radiological (>20 Gy to the spleen) splenectomy, radiation dose to the pituitary and thyroid glands, nitrosourea administration, and attained age.
P value for a significant difference in the linear coefficient of the radiation dose response to thyroid dose.
Lastly, only five thyroid carcinomas were diagnosed in patients treated in the United Kingdom. When adjusting on thyroid radiation dose and other factors listed in Table 1, thyroid carcinomas were 4.5 (95% CI, 1.9–13.0) fold less frequent in patients treated in the United Kingdom than in France (P = .005), ratio not dependent from calendar year (P = .5) or duration (P = .6) of followup.
Discussion
Based on a cohort of 4338 5-year survivors of childhood cancer followed for an average of 27 years, this study confirms previous findings concerning the relation between cumulative radiation dose to the thyroid and the risk of thyroid cancer, which increases with moderate doses, but plateaus or decreases after higher doses, probably due to cell killing. We also confirmed previous findings according to which the very high SIR, compared with the general population, observed 10–20 years after childhood cancer irradiation, may not be extrapolated for further followup; indeed, when increasing followup, AER remained stable but SIR decreased. Our new findings, which were not addressed in the pool analysis (7), concerned the increase in thyroid cancer risk after surgical or radiological splenectomy or nitrosourea administration, and its decrease after high radiation dose to the pituitary gland. In addition, thyroid carcinoma risk per unit of radiation dose to the thyroid was near from significantly higher in survivors with a BMI at least 25 or a larger BSA than the others.
Physicians are well aware that long-term survivors treated with radiotherapy (which exposes the thyroid) during childhood are at a high risk of developing thyroid cancer. Such childhood cancer survivors are thus followed up more carefully than the general population. This surveillance bias is likely to artifactually increase the observed incidence of thyroid cancer among survivors (21), although this artifact is hard to separate from the true increase (22). We suspect that this bias is not substantial given that the size and the extent of the 55 thyroid carcinomas diagnosed in our cohort were similar at the time of their diagnosis to that generally observed in the cancer registry in France (23). Another weakness of our study is the unexplained ratio of 4.5 (95% CI, 1.9–13.0) between thyroid carcinoma risk among patients treated in France and in United Kingdom. We do not have any explanation for this result, which is not due to a bias of selection during followup of French patients.
Our findings concerning the shape of the dose response relating to the thyroid radiation dose is coherent with results of the pooled analysis (7), and the other cohorts and case-control studies previously examined (5, 6, 24). This could be due to the mechanism of cell killing and could explain why some strategies aiming to reduce doses of radiation therapy may not necessarily produce the expected reduction in secondary thyroid cancer incidence (25). Nevertheless, more precise knowledge regarding the role of the dose distribution within the thyroid is needed to better quantify this mechanism. Indeed, in all the published studies up to now, the considered thyroid radiation dose is a unique value supposedly representative of the distribution of the dose into the thyroid gland. In fact, except in cases where the thyroid gland is fully within or clearly far from any radiation therapy field, dose distribution in the thyroid during radiation therapy is highly heterogeneous. Therefore, whatever the chosen parameter (unique anatomical site in the thyroid isthmus, average three sites located in the isthmus and the two lobes, average thyroid dose estimated using treatment planning system), a unique parameter cannot summarize the heterogeneity of dose distribution. New methods permitting the dose-volume effect to be taken into account are needed (26). Also importantly, in studies based on retrospective dosimetry, there are the uncertainties on organ volumes inherent with the use of representative phantoms. Indeed, each individual is unique and can have a thyroid volume different from their age-specific average, especially for patients who undergo aggressive treatments (27). The poor ability of retrospective studies, not based on individual radiological documents, to accurately take into account the variability of organ volumes in radiation dose-volume metric reconstructions may be the weakest link in such approaches.
The decrease we observed in thyroid cancer SIR, with time since first cancer treatment and with attained age, is consistent with what was observed in all the other childhood cancer survivor cohorts (5–7, 28) and in line with the fact that the slope of the dose effect for thyroid cancers, which occurred before 35 years of age, in the CCSS (5), our cohort and in the pooled analysis (7), was steeper than the one observed for thyroid cancers that occurred after.
We did not confirm the previous finding of an excess of thyroid carcinoma in neuroblastoma survivors, which was observed in the same cohort with a shorter followup (29). This could be due to confounding between the type of first cancer and other risk factors for thyroid cancer, in particular the young age at diagnosis of neuroblastoma. Nevertheless, a common etiological mechanism between neuroblastoma and thyroid cancer occurring early after radiation therapy could not be excluded because this finding has also been observed in a systematic screening of thyroid carcinoma in childhood cancer survivors, with a mean followup of 13 years (30).
We observed a decrease in thyroid cancer risk when increasing the radiation dose received by the pituitary gland, which was not observed in the CCSS (5). We do not have any explanation for this discrepancy with our data. It is well established that high radiation doses to the pituitary gland are known to induce long-term permanent multiple endocrinological pathologies, including deficiency in TSH (31). Therefore, it could be hypothesized that such high radiation doses might decrease the risk of thyroid cancer by lowering the stimulation of thyroid cell growth. However, no dosage of TSH was performed in our study that could support this hypothesis.
Splenectomy has been suggested to have an effect on immunological function, and subsequent development of cancer has recently been recognized as a possible adverse effect of splenectomy (32, 33). However, no other study has investigated the role of surgical or radiological splenectomy in the risk of thyroid carcinoma after childhood cancer. Therefore, our findings must be confirmed.
In our study, we did not evidence an increased risk with chemotherapy nor with alkylating agent, as reported in the pooled analysis (7) and in other studies. However, in our study, the administration of nitrosoureas belonging to the alkylating agents was associated with a thyroid carcinoma relative risk of 6.6. Only a few patients received this chemotherapy; consequently it was not possible to evaluate its modifier effect on the risk associated with the radiation dose to the thyroid. We have no explanation for this increase that has never been reported before.
High BMI and BSA are known risk factors of thyroid carcinoma (34–37), and obesity, either linked to the thyroid volume (35) or because of inflammation (38), has recently been shown to modulate epigenetic response to radiation in mice (39), but to our knowledge, up to now no other study has investigated obesity as a potential dose-response modifier for radiation-induced cancer. If confirmed, these results have to be taken into account in models aiming to predict individual risk of thyroid carcinoma following radiotherapy in childhood (40).
In conclusion, our study shows that to predict thyroid cancer risk following childhood cancer radiation therapy probably requires more than just the radiation dose to the thyroid to be assessed. Chemotherapy, splenectomy, radiation dose to pituitary gland, and obesity probably also play a role and must be considered.
Acknowledgments
We thank Angela Jackson and Martine Labbé for their help in data management, as well as all the physicians and physicists who participated in the elaboration of the study or data collection at the Gustave Roussy Institute, Jean Godinot Institute, Curie Institute, Claudius Regaud Institute, and Antoine Lacassagne Center.
This study was registered in ClinicalTrials.gov as trial number NCT01620372.
This work was supported by the Ligue Nationale Contre le Cancer, the Agence Nationale de la Recherche, the Institut de Recherche en Santé Publique, the Programme Hospitalier de Recherche Clinique, the Agence Française de Sécurité Sanitaire et Produit de Santé, Electricité de France, and the Fondation Pfeizer for the Childhood and Adolescent Health.
Disclosure Summary: The authors have nothing to disclose.
Abbreviations
- AER
absolute excess risk
- BCCSS
British Childhood Cancer Survivor Study
- BMI
body mass index
- BSA
body surface area
- CCSS
Childhood Cancer Survivor Study
- CI
confidence interval
- ERR/Gy
excess relative risk per Gy
- RR
relative risk
- SIR
standardized incidence ratio.
