


The objective of the study was to evaluate whether anti-Müllerian hormone (AMH) is associated with fecundability among women with proven fecundity and a history of pregnancy loss.
This was a prospective cohort study within a multicenter, block-randomized, double-blind, placebo-controlled clinical trial (clinicaltrials.gov, number NCT00467363).
The study was conducted at four US medical centers (2006–2012).
Participating women were aged 18–40 years, with a history of one to two pregnancy losses who were actively attempting pregnancy.
Time to human chorionic gonadotropin detected and clinical pregnancy were assessed using Cox proportional hazard regression models to estimate fecundability odds ratios (fecundability odds ratios with 95% confidence interval [CI]) adjusted for age, race, body mass index, income, low-dose aspirin treatment, parity, number of previous losses, and time since most recent loss. Analyses examined by preconception AMH levels: low (<1.00 ng/mL, n = 124); normal (referent 1.00–3.5 ng/mL, n = 595); and high (>3.5 ng/mL, n = 483).
Of the 1202 women with baseline AMH levels, 82 women with low AMH (66.1%) achieved an human chorionic gonadotropin detected pregnancy, compared with 383 with normal AMH (65.2%) and 315 with high AMH level (65.2%). Low or high AMH levels relative to normal AMH (referent) were not associated with fecundability (low AMH: fecundability odds ratios 1.13, 95% CI 0.85–1.49; high AMH: FOR 1.04, 95% CI 0.87–1.24).
Lower and higher AMH values were not associated with fecundability in unassisted conceptions in a cohort of fecund women with a history of one or two prior losses. Our data do not support routine AMH testing for preconception counseling in young, fecund women.
Increasing maternal age is closely linked to diminished oocyte quality and achieving pregnancy (1–4), yet fecundability varies considerably among women of similar age (5, 6). Currently there is no established biomarker to inform an individual's probability of becoming pregnant, limiting our ability to individualize care and guide family planning (7). Furthermore, after a pregnancy loss, concern for future fecundability may be heightened, and time to pregnancy after a loss may be lengthened (8).
Anti-Müllerian hormone (AMH), a dimeric glycoprotein produced by the granulosa cells of preantral and antral follicles (9), is widely used to predict ovarian response in assisted reproduction (10, 11). However, other than a decline of AMH with age (12), its relationship with fecundability in unassisted conceptions is poorly understood. Prior fecundability studies have been conflicted by inclusion of women with polycystic ovarian syndrome (PCOS) (13), which is associated with a higher AMH and risk of anovulation (14–16) and reduced fertility (17, 18). Furthermore, prior evidence indicates that the relationship between AMH and fecundability may be impacted by other reproductive traits and history, such as parity (19–21).
Therefore, our objective was to investigate the association of AMH and time to pregnancy with unassisted conceptions in a large cohort of premenopausal women with a wide reproductive age range, a history of pregnancy loss, no known pathology known to affect AMH (eg, PCOS), and well-characterized reproductive histories including information on prior live births and pregnancy losses.
Materials and Methods
Study design and population
This is a prospective, secondary cohort analysis within the Effects of Aspirin in Gestation and Reproduction trial, a multicenter, double-blind, block-randomized, placebo-controlled trial evaluating the effect of low-dose aspirin (LDA) on live birth in 1228 women with a history of one to two previous losses. The Effects of Aspirin in Gestation and Reproduction study was conducted from 2006 through 2012 at four US medical centers; the design and methods have been previously described (22). Women in this cohort were attempting pregnancy; were aged 18–40 years, with regular menstrual cycles of 21–42 days in length; and had a history of one to two prior pregnancy losses and no history of infertility, pelvic inflammatory disease, tubal occlusion, endometriosis, anovulation, uterine abnormality, or polycystic ovarian syndrome. Fertility monitors were used to assist with timing intercourse and scheduling clinic visits (Clearblue easy fertility monitor; Inverness Medical). Eligible participants reported their reproductive history which was classified by the following: 1) number of prior live births (none or any), 2) number of prior pregnancy losses (one or two), and 3) time since most recent loss (≤1 or > 1 y). Written informed consent was provided to all participants with institutional review board authorization at the data coordinating center and at all clinical centers. Patient safety was optimized by a Data Safety and Monitoring Board, and the trial was registered with clinicaltrials.gov (number NCT00467363).
AMH assessment
Preconception AMH levels were measured in serum samples collected prior to conception at the randomization visit scheduled to coincide with days 2–4 of the menstrual cycle. AMH was analyzed in 2014 on samples collected in 2007–2012 and promptly stored at −80°C, according to the GEN II ELISA assay protocol with correction for complement interference (Beckman Coulter) (23). AMH levels were available for 1202 of the 1228 women in the cohort. All machine observed concentrations were used without substitution of concentration below the limits of detection (0.006 ng/mL) to avoid bias (24). The interassay laboratory coefficients of variation were 6.2% and 6.6% at mean concentrations of 8.9 and 3.1 ng/mL, respectively, for lyophilized manufacturer's controls and 6.3% for an in-house pooled serum control. To maximize the measurement precision of AMH, we evaluated for any improper calibration curves or out-of-range values for manufacturer-provided control samples using a pooled standard curve and confirmed that sample recalibration was not required (25).
Outcome measures
Pregnancy outcomes were time (in menstrual cycles) to achieve a human chorionic gonadotropin (hCG)-detected pregnancy and a clinically confirmed pregnancy. A positive result on a urine pregnancy test sensitive to hCG level of 25 mIU/mL (Quidel Quickvue; Quidel Corp) was considered an hCG-detected pregnancy. These urine hCG pregnancy tests were conducted at home or at the clinic if a participant reported a missed menses. In addition to the urine hCG tests, free β-hCG was also measured in daily first-morning urine collected at home from the last 10 days of each woman's first and second cycle of study participation, and on spot urine samples collected at all postcycle visits to enable a more sensitive detection of very early pregnancy. Two laboratory assays for free β-hCG (catalog number RIS0011R; BioVendor; catalog number 4221–16; Diagnostic Automation Inc) were sequentially used to determine 21 additional pregnancies that were verified as positive tests for hCG-detected pregnancy. Clinically confirmed pregnancy was defined as an intrauterine pregnancy visible on ultrasound at approximately 6.5 weeks of gestation.
Statistical analysis
At present, international standards of AMH thresholds do not exist because there is no consensus regarding normal levels for the general, fertile population and because commercial assays do not yield similar results for AMH (26). We initially evaluated AMH levels using the continuous data and observed a potential nonlinear (U shaped) relationship between AMH and fecundability, thus suggesting that conventional linear regression would not be appropriate. Thus, our analyses were performed with cut points that best reflected the utility of AMH in a clinical setting by reporting low, normal, and high categories. We performed extensive, careful review of available data to define the AMH categories used. We also performed several sensitivity analyses, including tertile analyses, to determine the most appropriate cut points of AMH, all which demonstrated similar null findings. Our choice of cut points presented here was intended to best reflect cut points used in prior publications and in current clinical use, which reflect a reasonable distribution of women across the groups. Specifically, AMH levels were categorized using clinical thresholds based on data from infertile women (26–28). AMH levels were thus classified for this analysis as low (<1.00 ng/mL), normal (1.00–3.5 ng/mL), and high (>3.5 ng/mL). An ANOVA, χ2, or Fisher's exact test were used, as appropriate, to determine differences across low, normal, and high AMH categories for demographic and reproductive history characteristics.
The number of cycles to achieve pregnancy was calculated as the summation of the participant reported number of cycles of attempting conception before study entry and the number of cycles observed during the study needed to achieve either an hCG detected pregnancy (defined by date of positive hCG urinary test) and/or clinically confirmed pregnancy (defined by date of ultrasound). Discrete Cox proportional hazard regression models, confirmed to meet the proportionality assumption (29), were used to calculate fecundability odds ratios (FORs) of low and high AMH levels compared with normal AMH (reference group). FORs greater than 1 indicates a shorter time to pregnancy (ie, increased fecundability). All analyses accounted for left truncation and right censoring (30); specifically, because not all women were observed at the time of risk (ie, time of initiation of attempting conception), their delayed entry time was included to mitigate potential bias due to left truncation. To evaluate the role of parity (19–21) and, more specifically, of prior live birth and pregnancy losses, analyses were repeated among the following: 1) women with vs without a prior live birth, 2) women with one vs two prior pregnancy losses, and 3) women with the most recent pregnancy loss within the prior year vs 1 year or more prior to the pregnancy loss. In addition, we conducted an exploratory evaluation of fecundability stratified by age greater than 35 years, given the known effect of age on both AMH exposure (12) and fecundability outcome (4). The choice of covariates to include in fully adjusted models was determined by directed acyclic graphs and statistical testing for confounding identification. Final models adjusted for age, race, body mass index (BMI), income, and LDA treatment, with additional adjustment for parity, number of previous losses, and time since the most recent loss for analyses not stratified by these same characteristics. Models only adjusted for age also are presented.
Information was missing for AMH (n = 26), BMI (n = 20), education (n = 1), gestational age of most recent loss (n = 161), and time from last loss to randomization (n = 20). Multiple imputation was performed for missing exposure and covariate data for discrete Cox proportional hazard regression models, assuming data were missing at random (31). Analyses were conducted using SAS software (version 9.4; SAS Institute, Inc).
Results
The AMH range of participants was 0.07–22.1 ng/mL. Of the 1202 women with measured baseline AMH, most of the participants demonstrated a normal AMH level (n = 595, 49.5%) and high AMH level (n = 483, 40.2%), compared with 124 women who demonstrated a low AMH (10.3%). Subjects were predominantly white (94.6%), married (91.5%), and high school educated or above (86.2%), with a mean BMI of 26.4 kg/m2 (SD 6.6 kg/m2) and age of 28.7 years (SD 4.8) years (Table 1). As expected, the mean age was highest in the low AMH group and lowest in the high AMH group (P < .001). In parallel with age distribution across groups, women within the lower AMH levels also had higher income (P < .001, data not shown) and a greater proportion with history of prior births (P = .01). Race, LDA treatment, number of previous pregnancy losses, gestational age of last loss, and time from last loss to randomization were similar across AMH groups.
Demographics of Participants by AMH Level
| Characteristics | Total | Low AMH <1.0 ng/mL | Normal AMH 1.0–3.5 ng/mL | High AMH >3.5 ng/mL | P Value |
|---|---|---|---|---|---|
| n, % | 1202 | 124 (10.3) | 595 (49.5) | 483 (40.2) | |
| Age, y | 28.7 ± 4.8 | 32.8 ± 5.1 | 29.1 ± 4.6 | 27.3 ± 4.2 | <.001 |
| BMI, kg/m2 | 26.3 ± 6.6 | 27.2 ± 7.2 | 26.5 ± 6.5 | 25.9 ± 6.5 | .14 |
| Race | .79 | ||||
| White | 1138 (94.7) | 119 (96.0) | 563 (94.6) | 456 (94.4) | |
| Nonwhite | 64 (5.3) | 5 (4.0) | 32 (5.4) | 27 (5.6) | |
| Marital status | .28 | ||||
| Married | 1101 (91.6) | 109 (87.2) | 553 (92.9) | 439 (90.9) | |
| Living with partner | 72 (6.0) | 12 (9.7) | 30 (5.0) | 30 (6.2) | |
| Other | 29 (2.4) | 3 (2.4) | 12 (2.0) | 14 (2.9) | |
| More than high school education | 1038 (86.4) | 107 (86.3) | 514 (86.4) | 417 (86.5) | .99 |
| Treatment | |||||
| LDA | 602 (50.1%) | 67 (54.0) | 286 (48.1) | 249 (51.6) | |
| Placebo | 600 (59.9%) | 57 (46.0) | 309 (51.9) | 234 (48.4) | .34 |
| Previous live births | .01 | ||||
| 0 | 561 (46.7) | 55 (44.4) | 255 (42.9) | 251 (52.0) | |
| 1 or 2 | 641 (53.3) | 69 (55.6) | 340 (57.1) | 232 (48.0) | |
| Number of previous pregnancy losses | .67 | ||||
| 1 | 804 (66.9) | 82 (66.1) | 392 (65.9) | 330 (68.3) | |
| 2 | 398 (33.1) | 42 (33.9) | 203 (34.1) | 153 (31.7) | |
| Gestational age of most recent loss, wk | 9.2 ± 4.9 | 9.2 ± 4.5 | 9.1 ± 4.7 | 9.4 ± 5.3 | .58 |
| Time from last loss to randomization, mo | .34 | ||||
| ≤4 | 630 (53.3) | 69 (56.1) | 312 (53.4) | 249 (52.4) | |
| 5–8 | 211 (17.9) | 25 (20.3) | 90 (15.4) | 96 (20.2) | |
| 9–12 | 103 (8.7) | 8 (6.5) | 56 (9.6) | 39 (8.2) | |
| >12 | 238 (20.1) | 21 (17.1) | 126 (21.6) | 91 (19.2) |
P value from ANOVA or χb test, except for cases of cell size less than five (marital status only). Information was missing for AMH (n = 26), BMI (n = 20), education (n = 1), gestational age of most recent loss (n = 161), and time from last loss to randomization (n = 20).
There were no significant differences in percentage of women achieving pregnancy by AMH category, with 82 women with a low AMH (66.1%) achieving an hCG-detected pregnancy, compared with 383 with normal AMH (65.2%) and 315 with a high AMH level (65.2%). Similarly, there were no significant differences by AMH levels and percentage achieving a clinically confirmed pregnancy (Table 2). Low and high AMH compared with normal AMH was not significantly associated with hCG-detected fecundability in unadjusted analysis or adjusted models. Results were comparable for clinically confirmed pregnancy.
Association Between AMH and Fecundability Overall and by Reproductive History
| hCG Pregnancy | Clinical Pregnancy | |||||
|---|---|---|---|---|---|---|
| Low AMH <1.0 ng/mL | Normal AMH 1.0–3.5 ng/mL | High AMH >3.5 ng/mL | Low AMH <1.0 ng/mL | Normal AMH 1.0–3.5 ng/mL | High AMH >3.5 ng/mL | |
| Overall (n = 1202) | ||||||
| Achieved pregnancy, n, % | 82 (66.1) | 383 (64.4) | 315 (65.2) | 74 (59.7) | 348 (58.5) | 290 (60) |
| FOR, unadjusted | 1.05 (0.81,1.38) | Referent | 1.09 (0.92, 1.29) | 1.01 (0.77, 1.34) | Referent | 1.09 (0.92, 1.30) |
| FOR, adjusted model 1a | 1.11 (0.84,1.47) | Referent | 1.07 (0.90, 1.27) | 1.06 (0.80, 1.41) | Referent | 1.07 (0.90, 1.28) |
| FOR, adjusted model 2b | 1.14 (0.85,1.52) | Referent | 1.07 (0.90, 1.27) | 1.07 (0.80, 1.44) | Referent | 1.07 (0.90, 1.28) |
| History of no previous live births (n = 561) | ||||||
| Achieved pregnancy, n, % | 33 (60) | 147 (57.6) | 151 (60.2) | 30 (54.5) | 133 (52.2) | 137 (54.6) |
| FOR, unadjusted | 1.02 (0.68, 1.54) | Referent | 1.23 (0.96, 1.58) | 1.03 (0.67, 1.57) | Referent | 1.22 (0.94, 1.59) |
| FOR, adjusted model 1a | 1.14 (0.74, 1.77) | Referent | 1.19 (0.93, 1.54) | 1.15 (0.73, 1.81) | Referent | 1.18 (0.91, 1.54) |
| FOR, adjusted model 2c | 1.18 (0.75, 1.84) | Referent | 1.14 (0.88, 1.47) | 1.19 (0.75, 1.88) | Referent | 1.12 (0.86, 1.47) |
| History of live birth (n = 641) | ||||||
| Achieved pregnancy, n, % | 49 (71) | 236 (69.4) | 164 (70.7) | 44 (63.8) | 215 (63.2) | 153 (65.9) |
| FOR, unadjusted | 1.11 (0.78, 1.60) | Referent | 1.00 (0.80, 1.27) | 1.02 (0.70, 1.48) | Referent | 1.02 (0.80, 1.29) |
| FOR, adjusted model 1a | 1.17 (0.81, 1.69) | Referent | 0.98 (0.77, 1.23) | 1.06 (0.72, 1.54) | Referent | 1.00 (0.78, 1.27) |
| FOR, adjusted model 2c | 1.17 (0.81, 1.70) | Referent | 0.97 (0.77, 1.23) | 1.05 (0.72, 1.54) | Referent | 0.99 (0.78, 1.26) |
| History of one previous loss (n = 804) | ||||||
| Achieved pregnancy, n, % | 54 (65.9) | 244 (62.2) | 214 (64.8) | 51 (62.2) | 223 (56.9) | 196 (59.4) |
| FOR, unadjusted | 1.03 (0.74, 1.44) | Referent | 1.14 (0.93, 1.40) | 1.06 (0.75, 1.49) | Referent | 1.12 (0.91, 1.39) |
| FOR, adjusted model 1a | 1.12 (0.79, 1.59) | Referent | 1.07 (0.90, 1.27) | 1.16 (0.81, 1.67) | Referent | 1.09 (0.88, 1.36) |
| FOR, adjusted model 2c | 1.13 (0.79, 1.60) | Referent | 1.08 0.88, 1.34) | 1.17 (0.81, 1.67) | Referent | 1.06 (0.85, 1.32) |
| History of two previous losses (n = 398) | ||||||
| Achieved pregnancy, n, % | 28 (66.7) | 139 (68.5) | 101 (66) | 23 (54.8) | 125 (61.6) | 94 (61.4) |
| FOR, unadjusted | 1.09 (0.68, 1.74) | Referent | 1.00 (0.74, 1.34) | 0.90 (0.55, 1.47) | Referent | 1.02 (0.75, 1.38) |
| FOR, adjusted model 1a | 1.10 (0.69,1.77) | Referent | 0.99 (0.73,1.33) | 0.90 (0.55,1.47) | Referent | 1.02 (0.75,1.39) |
| FOR, adjusted model 2c | 1.13 (0.70, 1.82) | Referent | 0.96 (0.71, 1.30) | 0.89 (0.54, 1.47) | Referent | 0.99 (0.72, 1.35) |
| Last loss within prior 1 year (n = 946) | ||||||
| Achieved pregnancy, n, % | 10 (47.6) | 68 (54) | 40 (44.4) | 8 (38.1) | 58 (46) | 37 (41.1) |
| FOR, unadjusted | 1.09 (0.81, 1.46) | Referent | 1.18 (0.98, 1.42) | 1.05 (0.78, 1.42) | Referent | 1.05 (0.78, 1.42) |
| FOR, adjusted model 1a | 1.11 (0.82, 1.5) | Referent | 1.17 (0.97, 1.41) | 1.05 (0.77, 1.43) | Referent | 1.15 (0.95, 1.4) |
| FOR, adjusted model 2c | 1.13 (0.84, 1.53) | Referent | 1.14 (0.94, 1.37) | 1.05 (0.77, 1.44) | Referent | 1.12 (0.92, 1.36) |
| Last loss ≥ 1 year prior (n = 237) | ||||||
| Achieved pregnancy, n, % | 71 (69.6) | 306 (66.7) | 270 (70.1) | 65 (63.7) | 282 (61.4) | 248 (64.4) |
| FOR, unadjusted | 0.85 (0.41, 1.77) | Referent | 0.70 (0.46, 1.07) | 0.8 (0.36, 1.77) | Referent | 0.82 (0.52, 1.27) |
| FOR, adjusted model 1a | 0.99 (0.45, 2.16) | Referent | 0.67 (0.44, 1.04) | 1.07 (0.46, 2.47) | Referent | 0.75 (0.48, 1.18) |
| FOR, adjusted model 2c | 1.1 (0.49, 2.46) | Referent | 0.66 (0.42, 1.02) | 1.26 (0.53, 2.98) | Referent | 0.75 (0.47, 1.18) |
FOR presented as estimate (95% confidence interval).
Adjusted for age.
Adjusted for age, race, BMI, treatment, income, parity, number of previous losses, and time from last loss to randomization.
Adjusted for age, race, BMI, treatment, and income.
Similarly, restricted analysis by the number of prior live births (none or any), the number of prior pregnancy losses (one or two), and the time since most recent loss (≤1 or > 1 y) did not demonstrate any significant association of low or high AMH with achieving either hCG detected or clinically confirmed pregnancy. Kaplan-Meier (KM) cumulative hazard plots evaluated the number of cycles needed to achieve an hCG-detected pregnancy of the overall cohort (Figure 1A), restricted analysis of women with no previous live birth (Figure 1B), women with one previous loss (Figure 1C), and last loss within 1 year of randomization (Figure 1D). These analyses did not demonstrate significant differences by low (blue), normal (green), or high (red) AMH. KM cumulative hazard plots of clinically confirmed pregnancy demonstrated a similar null association (data not shown).
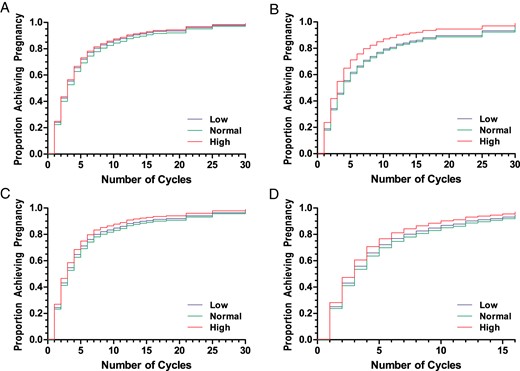
KM cumulative hazard plots illustrating the number of cycles needed to achieve an hCG detected pregnancy in the overall cohort (A), women with no previous live birth (B), women with one previous loss (C), and women with their last loss within 1 year of randomization (D).
No significant differences were observed between women with low (blue), normal (green), or high (red) AMH.
Given the known effect of age, specifically a decline in both AMH levels (12) and fecundability (1, 2, 4), at age 35 years, we performed stratified analysis by age. These exploratory analyses, stratified by maternal age found no significant differences in fecundability in the unadjusted or adjusted models (Table 3).
Association Between AMH and Fecundability Stratified by Age Group (<35 y and ≥ 35 y)
| hCG pregnancy | Clinical pregnancy | |||||
|---|---|---|---|---|---|---|
| Low AMH <1.0 ng/mL | Normal AMH 1.0–3.5 ng/mL | High AMH >3.5 ng/mL | Low AMH <1.0 ng/mL | Normal AMH 1.0–3.5 ng/mL | High AMH >3.5 ng/mL | |
| Participants < 35 y of age (n = 1062) | ||||||
| Achieved pregnancy, n, % | 54 (71.1) | 340 (64.4) | 300 (65.6) | 49 (64.5) | 310 (58.7) | 276 (60.3) |
| FOR, unadjusted | 1.22 (0.87, 1.70) | Referent | 1.09 (0.91, 1.30) | 1.15 (0.82, 1.62) | Referent | 1.08 (0.90, 1.30) |
| FOR, adjusted modela | 1.24 (0.89, 1.73) | Referent | 1.07 (0.90, 1.29) | 1.17 (0.83, 1.64) | Referent | 1.07 (0.89, 1.29) |
| FOR, adjusted model 2b | 1.26 (0.90, 1.76) | Referent | 1.06 (0.88, 1.27) | 1.17 (0.83, 1.65) | Referent | 1.05 (0.87, 1.27) |
| Participants ≥ 35 y of age (n = 140) | ||||||
| Achieved pregnancy, n, % | 28 (58.3) | 43 (64.2) | 15 (60.0) | 25 (52.1) | 25 (52.1) | 14 (56.0) |
| FOR, unadjusted | 0.84 (0.49, 1.42) | Referent | 0.95 (0.49, 1.83) | 0.84 (0.49, 1.46) | Referent | 1.02 (0.52, 2.01) |
| FOR, adjusted model 1a | 0.93 (0.53, 1.62) | Referent | 0.97 (0.50, 1.88) | 0.89 (0.50, 1.58) | Referent | 1.03 (0.52, 2.03) |
| FOR, adjusted model 2b | 0.88 (0.48, 1.60) | Referent | 1.06 (0.50, 2.24) | 0.81 (0.43, 1.51) | Referent | 1.08 (0.5, 2.34) |
FORs are presented as estimate (95% confidence interval).
Adjusted for age.
Adjusted for age, race, BMI, treatment, income, parity, number of previous losses, and time from last loss to randomization.
Discussion
AMH was not associated with natural fecundability in this rigorous analysis of a large cohort of healthy, fecund women attempting pregnancy, evaluating both hCG-detected and clinically confirmed pregnancies. Further examination according to reproductive history characteristics and advanced maternal age groupings told a similar story, with no associations identified, suggesting that factors thought to be linked to AMH did not explain or modify the potential relationship of AMH with natural fecundability. These findings indicate that AMH is not a suitable biomarker of fecundability in women with a history of pregnancy loss.
To our knowledge, this is the first prospective study to evaluate the relationship between preconception AMH level and natural fecundability in a large cohort of women with proven fecundity, proven by this cohort's history of pregnancy followed by pregnancy loss. Prior studies in other populations have shown inconsistent results. Specifically, a significant reduction in fecundability with a low AMH (≤0.7 ng/mL) was reported in women aged 30 years and older (32, 33), whereas another study reported reduced fecundability with high AMH (>5.5 ng/mL) in women aged 19–35 years (13). These prior findings (13) may have been further complicated by the inclusion of women with diseases affecting fecundability, such as PCOS. Women with PCOS generally have higher AMH levels (16) but are often subfertile due to chronic anovulation (18).
Previous studies attempted to identify subgroups of populations in which AMH may be related to fecundability, and parity has received frequent attention as a possible relevant factor (19–21). However, findings have been inconsistent (18–20). Our results in a much larger population indicate no such relationship when both live birth and pregnancy loss characteristics are considered. Interestingly, the FOR point estimates describing the relationship between higher AMH and fecundability among women having their most recent loss more than 1 year prior to the study were consistently less than 1 and were borderline significant in adjusted models. We suspect the most likely explanation for this trend is that a longer time since the prior loss may be a marker of mild subfertility within this fecund population, and those women with the higher AMH within this particular subgroup may be more likely to have some level of AMH-related subfertility along the spectrum of a mild subclinical PCOS-like phenotype (34). This observation is consistent with our findings of higher AMH among premenopausal women with sporadic anovulatory cycles (35).
Because AMH has not proven to be a useful indicator of a woman's ability to conceive in women with a history of pregnancy loss, age remains the most informative factor available for preconception counseling on fecundability. Indeed, multiple fecundity studies confirm the decline in fecundability and fertility related to age (1, 2, 4, 36–38). Female age is known to predict oocyte competence, as demonstrated by the increase in meiotic disjunction and aneuploidy in pregnancies of older women (3). Given that AMH is an established marker of ovarian reserve, some postulate that AMH is also a marker of oocyte competence (39, 40). However, the absence of an association between AMH and fecundability in our population suggests that although AMH is an acceptable marker of ovarian reserve and ovarian response in assisted reproduction, it does not appear to be a preconception marker of conception. Although of great potential clinical interest, preconception biomarkers that accurately predict natural fecundability and time to pregnancy remain elusive.
Our study has many strengths, including using the gold standard method of prospective time to pregnancy assessment (41); preconception collection of AMH levels in a large cohort of over 1200 women with verified fecundity; and early documentation of pregnancy both by urine hCG and 6–7 weeks' gestation ultrasonography. By collecting the daily first morning urine in the first and second cycle of women attempting pregnancy, we were able to detect very early pregnancies. One limitation of this study is the overall generalizability of the findings to a broader fertile population because this study included only women with a history of clinical pregnancy loss. However, pregnancy loss is a common event, occurring in an estimated 30% of conceptions (42, 43), suggesting that this study population is relevant to a large proportion of reproductive-aged women. Although AMH is typically assessed only in older women as a marker of ovarian reserve, given conflicting information available regarding the utility of AMH for predicting a number of outcomes related to fertility and fecundity, our goal was to evaluate for an association with time to pregnancy across a potentially more informative wider range of age. Also, this particular subgroup of women may be of particular relevance to study potential biomarkers of fecundability outside of infertile populations, given that time to pregnancy may be lengthened after a loss (8). Lastly, our exploration of women 35 years of age or older is limited by our proportionally smaller sample size in this group (140 women ≥ 35 y vs 1062 < 35 y of age).
In conclusion, neither lower nor higher AMH was associated with fecundability in women with a history of one or two prior pregnancy losses. Thus, AMH likely does not have utility for preconception counseling purposes in fecund women, although further studies may elucidate some utility for AMH among women without proven fecundity (eg, nulligravid women) or among women with either no or recurrent pregnancy loss. Further studies are needed to determine whether AMH is of clinical utility as a biomarker of pregnancy outcomes, including pregnancy loss. Our data do not support routine AMH testing for preconception counseling in young, fecund women.
Acknowledgments
This work was supported by the Intramural Research Program of the Eunice Kennedy Shriver National Institute of Child Health and Human Development, National Institutes of Health (Contracts HHSN267200603423, HHSN267200603424, and HHSN267200603426).
Disclosure Summary: The authors have nothing to disclose.
Abbreviations
- AMH
anti-Müllerian hormone
- BMI
body mass index
- FOR
fecundability odds ratio
- hCG
human chorionic gonadotropin
- KM
Kaplan-Meier
- LDA
low-dose aspirin
- PCOS
polycystic ovarian syndrome.
