


Loss-of-function mutations of CYP24A1 (which encodes the 25-OH-D3-24-hydroxylase) have recently been reported to cause hypercalcemia.
The aims of this study were: 1) to evaluate the frequency of CYP24A1 mutations in patients with medical history of hypercalcemia; 2) to show the clinical utility of a simultaneous assay of serum 25-hydroxyvitamin D3 (25-OH-D3) and 24,25-dihydroxyvitamin D3 (24,25-[OH]2D3) by liquid chromatography tandem mass spectrometry (LC-MS/MS); and 3) to investigate biochemical parameters in heterozygous gene carriers with CYP24A1 mutations.
We screened for CYP24A1 mutations in 72 patients with serum calcium levels > 2.6 mmol/L and PTH levels < 20 pg/mL and recruited 24 relatives after genetic counseling for subsequent investigations. Vitamin D metabolite concentrations were assessed in a subset of patients by LC-MS/MS and results expressed as a ratio (R) of 25-OH-D3:24,25-(OH)2D3.
Twenty-five patients with hypercalcemia (35%) harbored CYP24A1 variations. Twenty (28%) had biallelic variations, mostly found in subjects with nephrocalcinosis or renal stones (19/20). Five patients, all neonates, were heterozygous, without renal disease. We describe 15 new variations leading to loss-of-function according to pathogenicity prediction programs, and we functionally characterized 5 of them in vitro. A dramatic increase of R, usually >80, was found in patients harboring biallelic mutations providing evidence in vivo for the loss of CYP24A1 activity. In contrast, R value remains <25 in patients without CYP24A1 mutations. Subjects carrying one mutant allele, hypercalcemic individuals, as well as gene-carrier relatives, had a detectable 24,25-(OH)2D3 level and R < 25, indicating normal 24-hydroxylase activity.
CYP24A1 biallelic mutations are frequently found in patients presenting with hypercalcemia, low PTH, and renal disease. We confirm the accuracy and effectiveness of a novel blood test estimating the ratio between relevant vitamin D metabolites as a useful screening tool for CYP24A1 mutations. Haploinsufficiency is not associated with CYP24A1 deficiency.
Over the past decade, there has been an increased focus on the benefits of vitamin D for the maintenance of bone health and the possible prevention of chronic disease states such as cancer and cardiovascular disease. To render it active, vitamin D requires two steps of hydroxylation, the first in the liver catalyzed by a 25-hydroxylase (CYP2R1, 11p15.2) and the second in the kidneys, by 1α-hydroxylase (CYP27B1, 12q13.1), to produce the hormonal form 1,25-dihydroxyvitamin D (1,25-[OH]2D). This hormonal form plays an important role in calcium and phosphate homeostasis by increasing intestinal calcium absorption and bone resorption and improving the efficiency of renal calcium reabsorption, in addition to playing a role in the regulation of cellular proliferation (1). Catabolism of vitamin D follows two different pathways beginning with 24- or 23-hydroxylation, both including several steps of hydroxylation catalyzed by the mitochondrial enzyme, 25-hydroxyvitamin D-24-hydroxylase (CYP24A1, 20q13.2) expressed in most vitamin D target tissues (2).
The variability in serum 25-hydroxyvitamin D (25-OH-D) concentration and the resulting hypercalcemia for a given amount of vitamin D must be interpreted in light of recent developments in genetics. In 2011, Schlingmann et al (3) identified loss-of-function mutations in CYP24A1 in a population of children presenting with idiopathic infantile hypercalcemia (IIH) most of them receiving vitamin D supplementation suggesting an unusual sensitivity to vitamin D (4). Common features of this condition included symptomatic hypercalcemia with suppressed PTH associated with nephrocalcinosis. Since then, additional cases have been published and the phenotypic spectrum has been extended to adults with renal disease (5–16). In addition, although autosomal-recessive inheritance was found, other authors have proposed a potential dominant inheritance pattern (7).
Because only case reports have been published, we describe here a cohort of patients with a medical history of acute or chronic hypercalcemia, and PTH less than 20 pg/mL to better define the phenotype of patients who should benefit from CYP24A1 genetic screening. In addition, we also show that simultaneous measurement of vitamin D metabolites by liquid chromatography–tandem mass spectrometry (LC-MS/MS) is a valuable screening tool for these patients (17). Lastly, we investigated patients harboring CYP24A1 mutations in a heterozygous state to better understand the role of CYP24A1 haploinsufficiency in the occurrence of hypercalcemia.
Patients and Methods
Patients
We enrolled onto this study 72 patients (index cases) presenting with hypercalcemia (> 2.6 mmol/L), or with a medical history of acute or chronic hypercalcemia, and PTH levels less than 20 pg/mL, recruited over an 18-month period in our laboratory. They were considered for the evaluation of CYP24A1 mutations frequency. After genetic counseling, we also included 24 relatives of the patients, and eleven patients from other centers for genetic screening and clinical and biological investigations. (Table 1 and Supplemental Table 1). For each individual, written informed consent was obtained from the patients and/or their parents for collection of clinical and laboratory data, and for DNA collection to conduct molecular studies.
Breakdown of the 72 Patients Presenting With Hypercalcemia and Their 24 Relatives
| Genetic Classification | ||||
|---|---|---|---|---|
| A, No Mutation | B, Biallelic Mutations | C, Heterozygous Mutation | D, Heterozygous Mutation | |
| Patients with hypercalcemia and PTH <20 pg/mL (n = 72) | ||||
| Group 1: isolated hypercalcemia | 11 | 1 | ||
| Group 2: with hypercalciuria | 20 | 1 | 4 | |
| Group 3: with nephrolithiasis | 3 | 4 | ||
| Group 4: with nephrocalcinosis | 14 | 14 | ||
| Relatives (n = 24) | 1a | 2 | 21 | |
| LC-MS/MS analysis | ||||
| Our cohort | 14 | 6 | 3 | 14 |
| Other centers | 10 | 1 | ||
This patient was considered as harboring variations that did not cause IIH and included in Group A. Vitamin D metabolite concentrations were assessed in a subset of patients by LC-MS/MS. Patients from the other centers underwent LC-MS/MS analyses by the same laboratory.
Biochemical and clinical parameters
Data on clinical symptoms and biochemical parameters (calcium and phosphate in serum and urine, renal function, PTH, and vitamin D levels) were collected retrospectively using records from hospitals or primary care physicians. Routine biochemical assays were performed at the time of the diagnosis of acute hypercalcemia, or during followup after normalization of the calcium level, in a variety of different clinical laboratories. Given that routine assays for vitamin D cannot discriminate between vitamin D3 and D2 we use the term “vitamin D” to describe these measurements. Medullary nephrocalcinosis was assessed by renal ultrasonography (echogenic renal pyramids). Nephrolithiasis was defined as kidney stones on ultrasonography or a medical history of renal colic.
Calcium absorption studies
Calcium absorption studies (Pak test) (18) were performed as follows: patients remain on a low-calcium diet for 5 days; after an overnight fast, calcium, phosphate, and PTH were evaluated in blood and calcium and creatinine in urine before (T0) and 4 hours (T4) after oral calcium administration (1 g). Results are expressed as the difference (T4−T0) of the urine calcium to creatinine molar ratio. Results less than 0.6 are considered normal.
Simultaneous assay of multiple vitamin D metabolites
Liquid chromatography–tandem mass spectrometry (LC-MS/MS) analysis was performed as previously described using 100 μL of serum. Results are expressed as the molar ratio (R) of 25-OH-D3: 24,25-(OH)2D3 (17). Values less than 25 indicated no defect in 25-OH-D3-24-hydroxylase activity and were considered normal.
Molecular analysis
Genomic DNA was isolated from peripheral blood leukocytes using standard methods. We designed several sets of primers for amplification of CYP24A1 exons 1–11 and their intron-exon junctions as previously described (10). PCR products were purified and sequenced using the CEQTMDTCS Quick Start Kit (Beckman Coulter) on a Beckman Coulter DNA Sequencer. New variations of sequence were searched on dbSNP database, and interpreted according to pathogenicity prediction programs (PolyPhen-2, Align-GVGD, MutationTaster, SIFT) to estimate the deleteriousness of each variant. Allelic frequencies were evaluated through the examination of Exome Variant Server database in European American and African American populations.
Transfection, cell culture, and analysis of mutant CYP24A1 enzyme activity
Site-directed mutagenesis of wild-type CYP24A1 allowed us to recreate, transfect and test CYP24A1 enzyme activity in V-79–4 Chinese hamster lung fibroblasts using detection of 24- and 23-hydroxylated products of 1,25-(OH)2D3 by LC-MS/MS as a measure of loss-of-function mutation as previously described (3). (Supplemental Appendix 1)
Statistical analysis
Sex was not considered a factor in the statistical analysis of the data. For each biochemical parameter, differences between groups were calculated using the Mann-Whitney nonparametric U test. A two-tailed P < .05 was considered statistically significant. The Kruskal-Wallis test was used for multiple group comparison (one-way nonparametric ANOVA).
Results
Patients
We enrolled 72 patients: 38 males (53%) and 34 females (47%), including 57 children (79%) (range, 1 d to 16 y; mean, 2.1 y) and 15 adults (21%) (range, 19–81 y; mean, 43.9 y). Four of these patients were previously described (10, 16). Familial occurrence was recorded in 17 patients (24%). Patients were classified into four phenotypic groups according to their biological data and the presence of renal disease (Table 1 and Supplemental Table 1). The different cutpoints are as follows: urine calcium:creatinine ratio normal level: adults, < 0.55; children age less than 6 months, < 2.4; children age 7–12 months, < 1.7; children age 1–5 years, < 1.1; and children above age 5 years, < 0.7.
- •
Group 1: without hypercalciuria, n = 12 (16%)
- •
Group 2: with hypercalciuria, n = 25 (35%)
- •
Group 3: with nephrolithiasis, n = 7 (10%)
- •
Group 4: with nephrocalcinosis, n = 28 (39%) (including three patients with nephrolithiasis and nephrocalcinosis)
Vitamin D metabolites including 25-OH-D3 and 24,25-(OH)2D3 were determined by LC-MS/MS in 48 subjects: 23 patients from this cohort, 14 heterozygous relatives, and 11 patients recruited from other centers explored with the same method (Table 1)
CYP24A1 mutations are found in patients presenting with hypercalcemia
The 72 patients were screened for CYP24A1 mutations. They were classified into different groups according to their genotype (Table 1). No mutation was found in 47 patients (Group A). We identified 25 patients (35%) harboring variations in the coding sequence of CYP24A1. Twenty patients (28%) have biallelic variations (Group B) either in a homozygous state (n = 9) with a history of consanguinity in five cases or in a compound heterozygous state (n = 11). We found only one variation (heterozygous status) in five patients (7%) (Group C). (Table 2). Further investigations in relatives identified 21 heterozygotes (Group D). CYP24A1 variations were identified in most of the 11 exons, with the two previously described hot spots: c.427_429del / p.Glu143del and c.1226T>C / p.Leu409Ser in exons 2 and 9, respectively and functionally characterized by Schlingmann et al (3) (Figure 1).
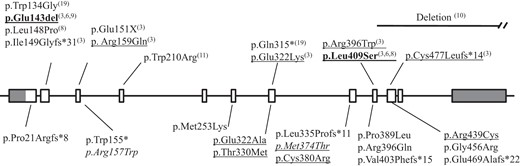
CYP24A1 mutations in patients with hypercalcemia (present study and literature).
Schematic representation of the CYP24A1 gene: exons are identified as rectangle, coding sequence in white, untranslated sequence in gray. Intronic sequences are represented by straight solid lines between exons. Below, mutations identified in this study; above, mutations reported in the literature. Numbers indicate author references. Recurrent mutations in bold characters; functionally characterized mutations are underlined. Variants described as a polymorphism are in italic.
Pedigree, Clinical, and Biochemical Data of Heterozygous-Hypercalcemic Patients at the Time of Diagnosis and During the Followup
| Pedigree | Sex/Origin | Age at Diagnosis | Circumstances of Diagnosis | Maternal Vitamin D Supplementation | Daily Vitamin D Supplementation | Genotype | Followup | ||
|---|---|---|---|---|---|---|---|---|---|
| Not available | M/A | 1 d | Apnea Ca = 2.84 1,25-(OH)2D = 118 at d18 | No | Yes | c.1121T>C (p.Met374Thr) | 3.5 mo: Ca = 2.67 P = 2.1 PTH = 17 25-OH-D = 97.3 1,25-(OH)2D = 237.6 | 21 mo: Ca = 2.61 P = 1.66 PTH = 31 25-OH-D = 64.9 1,25-(OH)2D = 148.8 | 2 y 9 mo: Ca = 2.61 P = 1.75 PTH = 27 25-OH-D = 59.9 1,25-(OH)2D = 144 |
 | M/A | 3 d | Infection Ca = 2.71; 3.11 at d8 P = 1.59; PTH = 5 25-OH-D = 46.2 | Not available | Yes | c.1121T>C (p.Met374Thr) | 3 mo: Ca = 2.7 25-OH-D3 = 76.4 | 8mo: 25-OH-D3 = 31.8 24,25-(OH)2D3 = 1.5 Ratio = 21.2 | |
 | M/C | 11 d | Preeclampsia prematurity (32 wk) Ca = 2.93; PTH = 1.6 25-OH-D = 75.6 1,25-(OH)2D = 422.4 | Yes, maternal hypercalcemia and suppressed PTH | No | c.965A>C (p.Glu322Ala) | 4 mo: Ca = 2.7; P = 2.01 25-OH-D3 = 38.5 24,25-(OH)2D3 = 2.7 Ratio = 14.3 | 2 y: Ca = 2.64; P = 1.52 PTH = 25 25-OH-D = 107.3 1,25-(OH)2D = 93.6 | |
 | F/C | 4 d | Prematurity (34 w) Ca = 3.16; PTH = 3.1 25-OH-D = 132.3 1,25-(OH)2D = 386.4 | Not available | Yes | c.1315C>T (p.Arg439Cys) | 16 mo 25-OH-D3 = 9.1 24,25-(OH)2D3 = 0.5 Ratio = 18.2 | ||
| Not available | F/A | 13 d | SGA Ca = 2.83 PTH = 1.4 | Yes | Yes | c.1121T>C (p.Met374Thr) | Not available | ||
| Pedigree | Sex/Origin | Age at Diagnosis | Circumstances of Diagnosis | Maternal Vitamin D Supplementation | Daily Vitamin D Supplementation | Genotype | Followup | ||
|---|---|---|---|---|---|---|---|---|---|
| Not available | M/A | 1 d | Apnea Ca = 2.84 1,25-(OH)2D = 118 at d18 | No | Yes | c.1121T>C (p.Met374Thr) | 3.5 mo: Ca = 2.67 P = 2.1 PTH = 17 25-OH-D = 97.3 1,25-(OH)2D = 237.6 | 21 mo: Ca = 2.61 P = 1.66 PTH = 31 25-OH-D = 64.9 1,25-(OH)2D = 148.8 | 2 y 9 mo: Ca = 2.61 P = 1.75 PTH = 27 25-OH-D = 59.9 1,25-(OH)2D = 144 |
| M/A | 3 d | Infection Ca = 2.71; 3.11 at d8 P = 1.59; PTH = 5 25-OH-D = 46.2 | Not available | Yes | c.1121T>C (p.Met374Thr) | 3 mo: Ca = 2.7 25-OH-D3 = 76.4 | 8mo: 25-OH-D3 = 31.8 24,25-(OH)2D3 = 1.5 Ratio = 21.2 | |
| M/C | 11 d | Preeclampsia prematurity (32 wk) Ca = 2.93; PTH = 1.6 25-OH-D = 75.6 1,25-(OH)2D = 422.4 | Yes, maternal hypercalcemia and suppressed PTH | No | c.965A>C (p.Glu322Ala) | 4 mo: Ca = 2.7; P = 2.01 25-OH-D3 = 38.5 24,25-(OH)2D3 = 2.7 Ratio = 14.3 | 2 y: Ca = 2.64; P = 1.52 PTH = 25 25-OH-D = 107.3 1,25-(OH)2D = 93.6 | |
| F/C | 4 d | Prematurity (34 w) Ca = 3.16; PTH = 3.1 25-OH-D = 132.3 1,25-(OH)2D = 386.4 | Not available | Yes | c.1315C>T (p.Arg439Cys) | 16 mo 25-OH-D3 = 9.1 24,25-(OH)2D3 = 0.5 Ratio = 18.2 | ||
| Not available | F/A | 13 d | SGA Ca = 2.83 PTH = 1.4 | Yes | Yes | c.1121T>C (p.Met374Thr) | Not available | ||
Abbreviations: A, African origin; C, Caucasian origin; F, female; M, male; SGA, small for gestational age.
Normal ranges: serum calcium level: before 1 y, 2.1–2.8 mmol/L; after 1 y, 2.2–2.6 mmol/L; PTH between 2 and 4 y, 5.7–34.2 pg/mL (male) and 3.6–32 pg/mL (female); 25-OH-D: 50–200 nmol/L; 1,25-(OH)2-D: 50–160 pmol/L; ratio: 5–25 (Ref. 17).
Pedigree, Clinical, and Biochemical Data of Heterozygous-Hypercalcemic Patients at the Time of Diagnosis and During the Followup
| Pedigree | Sex/Origin | Age at Diagnosis | Circumstances of Diagnosis | Maternal Vitamin D Supplementation | Daily Vitamin D Supplementation | Genotype | Followup | ||
|---|---|---|---|---|---|---|---|---|---|
| Not available | M/A | 1 d | Apnea Ca = 2.84 1,25-(OH)2D = 118 at d18 | No | Yes | c.1121T>C (p.Met374Thr) | 3.5 mo: Ca = 2.67 P = 2.1 PTH = 17 25-OH-D = 97.3 1,25-(OH)2D = 237.6 | 21 mo: Ca = 2.61 P = 1.66 PTH = 31 25-OH-D = 64.9 1,25-(OH)2D = 148.8 | 2 y 9 mo: Ca = 2.61 P = 1.75 PTH = 27 25-OH-D = 59.9 1,25-(OH)2D = 144 |
| M/A | 3 d | Infection Ca = 2.71; 3.11 at d8 P = 1.59; PTH = 5 25-OH-D = 46.2 | Not available | Yes | c.1121T>C (p.Met374Thr) | 3 mo: Ca = 2.7 25-OH-D3 = 76.4 | 8mo: 25-OH-D3 = 31.8 24,25-(OH)2D3 = 1.5 Ratio = 21.2 | |
| M/C | 11 d | Preeclampsia prematurity (32 wk) Ca = 2.93; PTH = 1.6 25-OH-D = 75.6 1,25-(OH)2D = 422.4 | Yes, maternal hypercalcemia and suppressed PTH | No | c.965A>C (p.Glu322Ala) | 4 mo: Ca = 2.7; P = 2.01 25-OH-D3 = 38.5 24,25-(OH)2D3 = 2.7 Ratio = 14.3 | 2 y: Ca = 2.64; P = 1.52 PTH = 25 25-OH-D = 107.3 1,25-(OH)2D = 93.6 | |
| F/C | 4 d | Prematurity (34 w) Ca = 3.16; PTH = 3.1 25-OH-D = 132.3 1,25-(OH)2D = 386.4 | Not available | Yes | c.1315C>T (p.Arg439Cys) | 16 mo 25-OH-D3 = 9.1 24,25-(OH)2D3 = 0.5 Ratio = 18.2 | ||
| Not available | F/A | 13 d | SGA Ca = 2.83 PTH = 1.4 | Yes | Yes | c.1121T>C (p.Met374Thr) | Not available | ||
Abbreviations: A, African origin; C, Caucasian origin; F, female; M, male; SGA, small for gestational age.
Normal ranges: serum calcium level: before 1 y, 2.1–2.8 mmol/L; after 1 y, 2.2–2.6 mmol/L; PTH between 2 and 4 y, 5.7–34.2 pg/mL (male) and 3.6–32 pg/mL (female); 25-OH-D: 50–200 nmol/L; 1,25-(OH)2-D: 50–160 pmol/L; ratio: 5–25 (Ref. 17).
We described 15 new variations. Five result in a truncated protein if translated (frameshift or nonsense): c.62del / p.Pro21Argfs*8; c.464G>A / p.Trp155*; c.1003dup / p.Leu335Profs*11; c.1206del / p.Val403Phefs*15; and c.1406_1407del / p.Glu469Alafs*22. Ten were missense variations: c.469C>T / p.Arg157Trp; c.758T>A / p.Met253Lys; c.965A>C / p.Glu322Ala; c.989C>T / p.Thr330Met; c.1121T>C / p.Met374Thr; c.1138T>C / p.Cys380Arg; c.1166C>T / p.Pro389Leu; c.1187G>A / p.Arg396Gln; c.1315C>T / p.Arg439Cys; and c.1366G>C / p.Gly456Arg. The frequency and the deleteriousness of each variant are represented in Supplemental Table 2. Glu322 and Arg396 were described with other substitutions (c.964G>A / p.Glu322Lys and c.1186C>T / p.Arg396Trp) and loss of enzymatic activity (3). Although there was easily detectable production of 1,24,25-trihydroxyvitamin D3 (1,24,25-(OH)3D3) and 1,23,25-trihydroxyvitamin D3 (1,23,25-(OH)3D3) with the wild-type enzyme, the following mutants, p.Thr330Met, p.Cys380Arg, and p.Arg439Cys were totally devoid of enzyme activity. The p.Met374Thr variant was found in four patients of African origin. Its high estimated frequency (5.2% heterozygosity) in this population and the functional in vitro enzyme assay were suggestive of a polymorphism rather than a loss-of-function mutation. We found this p.Met374Thr variant associated with another variant (p.Arg157Trp), also described as a polymorphism (1.9% heterozygosity), in a girl presenting with typical IIH symptoms and nephrocalcinosis (patient No. 7; Supplemental Table 1). The same genetic combination was found in her asymptomatic 2-month-old brother who had normal serum calcium and PTH levels, normal urine calcium level, and no renal disease. Evaluation of serum vitamin D metabolites in this p.Met374Thr/p.Arg157Trp subject confirmed a normal R ratio, suggesting the presence of one of these being a polymorphism rather than a mutation. Furthermore, although p.Arg157Trp remains untested in the in vitro CYP24A1 assay, both p.Met374Thr and p.Arg157Gln variants show measurable enzyme activity in vitro suggesting that both amino acid residues are tolerant of variation (2). Thus, this patient was considered as harboring variations that did not cause IIH and not included in Group B, but in Group A instead.
Clinical data of patients with biallelic CYP24A1 mutations
Biallelic mutations were mostly found in the groups of patients with renal disease (18/35 [51%]), either renal stones (4/7 [57%]; Group 3) or nephrocalcinosis (14/28 [50%]; Group 4). Children with CYP24A1 biallelic mutations presented with early (mean age at diagnosis, 8.5 mo; median age at diagnosis, 5.5 mo), severe (3.33 mmol/L, normal range [2.47–4.94 mmol/L]) and symptomatic (mainly weight loss and feeding problems) hypercalcemia. All children exhibited a renal disease (Groups 3 and 4), mainly nephrocalcinosis (8/9).
Biochemical parameters in patients without mutation compared with patients with biallelic mutations
To improve genetic screening, we searched for specific clinical and/or biological data between patients (Figure 3, Groups A and B) without mutation (Group A) and patients with CYP24A1 biallelic mutations (Group B). To improve our statistical analysis, we included 10 other patients with biallelic mutations recruited from other laboratories who underwent LC-MS/MS analysis by the same laboratory (Supplemental Table 1). Serum calcium and PTH levels in patients from Groups A and B are similar, but routine assay of 1,25-(OH)2D concentration is slightly higher in patients without mutation than those with biallelic mutations (P = .0322). The mean 25-OH D3 level in Group A is below the normal range (42.5 nmol/L). In contrast, in Group B, the 25-OH D3 level is higher and the 24,25-(OH)2D3 level is lower than in Group A (P < .0001 and P = .0006, respectively). Last, whereas R is normal in Group A, the patients of Group B exhibit a dramatic increase in R providing evidence in vivo for the loss of CYP24A1 enzyme activity.
![Enzyme activity for mutant CYP24A1 enzymes: LC-MS/MS of DMEQ-TAD-{4[2-(6,7-dimethoxy-4-methyl-3,4-dihydroquinoxalinyl)ethyl]-1,2,4-troaxoline-3,5-dione} derivatized trihydroxyvitamin D3 metabolites detected using multiple reaction monitoring at m/z 778-> 468.](https://oup.silverchair-cdn.com/oup/backfile/Content_public/Journal/jcem/100/10/10.1210_jc.2014-4387/1/m_zeg9991520110002.jpeg?Expires=1748640736&Signature=TcjmRS3YpAMibnGwQoq3JW6fQAY4pFvCDtItuqFi1oNuGnU2Wr6mAtLVAHEWXiZAvLtb~rRtQBYXIghIsznXN3NARIS0F7mVUZPU7RINI4td7OsNvtRl3b9gK9Q8duhQPOrGLalBHIZCNKGI~HHOi4i1qSu6jcRhSVPue~C~kIfG3VxmVeqIWYhrXMxfidHXwfKYQJAUza2fLZiAo8gycjQ4UyEz8tHwNDvOvCpMa4vyO4yd5oRbph21pD4nBy22uzTq8BThdHl8rrx1hdXAPrAA~5djTRstMKesnmPvMtiW2GilIEt0Wri5BDcjNFpWpRdaRgZ5Q5QgiFQJehAJNQ__&Key-Pair-Id=APKAIE5G5CRDK6RD3PGA)
Enzyme activity for mutant CYP24A1 enzymes: LC-MS/MS of DMEQ-TAD-{4[2-(6,7-dimethoxy-4-methyl-3,4-dihydroquinoxalinyl)ethyl]-1,2,4-troaxoline-3,5-dione} derivatized trihydroxyvitamin D3 metabolites detected using multiple reaction monitoring at m/z 778-> 468.
V79–4 Chinese hamster lung fibroblasts were transiently transfected with wild-type human CYP24A1 and mutant CYP24A1 types as indicated and then incubated with 1,25-(OH)2D3 as described previously (3). Metabolic products of 1,25-(OH)2D3 were extracted and derivatized using the Cookson reagent, DMEQ-TAD. DMEQ-TAD produces two adducts for each vitamin D metabolite present. Each chromatogram depicts the 2–4.5-minute portion of the LC showing both adducts of 1,24,25-(OH)3D3 and 1,23,25-(OH)3D3. The two adducts of 1,24,25-(OH)3D3 can be observed at retention times of 3.4 and 3.85 minutes and two adducts from 1,23,25-(OH)2D3 at retention times of 3.0 and 3.7 minutes.
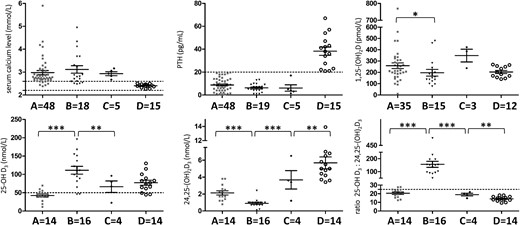
Biochemical data and LC-MS/MS analysis of serum vitamin D metabolites and ratio according to the different genotypes.
Group A, hypercalcemic patients without CYP24A1 mutation; Group B, hypercalcemic patients with biallelic CYP24A1 mutations; Group C, hypercalcemic patients with heterozygous CYP24A1 mutation; Group D, relatives with CYP24A1 mutation in a heterozygous state. *, P ≤ .05; **, P ≤ .01; ***, P ≤ .001. The dash horizontal lines indicate the reference limit. Normal individuals with a 25-OH-D3 of 50–125 nmol/L exhibit a range for 24,25-(OH)2D3 of 3.6–12 nmol/L and the normal ratio (R) of 25-OH-D3:24,25-(OH)2D3 is between 5 and 25 (17).
Clinical and biochemical parameters in patients with CYP24A1 mutation in a heterozygous state
CYP24A1 variations were found in a heterozygous state in five patients with hypercalcemia
These patients (Table 2 and Figure 3, Group C).were neonates, less than 2 weeks of age (range, 1–13 d). Hypercalcemia was found during routine examinations performed for another pathology: prematurity, growth retardation, infection, or apnea. None presented with renal pathology. One child was born prematurely to a mother presenting with severe hypercalcemia and suppressed PTH level during the pregnancy and subsequent investigations found biallelic CYP24A1 mutations in his mother. We described two new mutations, c.965A>C / p.Glu322Ala and c.1315C>T / p.Arg439Cys, both tested as a loss-of-function mutation (Figure 2). However, we found the same variation c.1121T>C / p.Met374Thr in three patients, all from African origin and described as a polymorphism in this population. The presence of heterozygous polymorphisms in several exons ruled out a heterozygous deletion that was not detected by sequence analysis. Calcium, PTH, and 1,25-(OH)2D levels were similar to patients from Groups A and B. They have normal 25-OH-D3 levels, measurable amounts of 24,25-(OH)2D3, and normal R ratio suggesting functional CYP24A1 activity.
Clinical and biochemical parameters in relatives with CYP24A1 heterozygous mutation
To better understand the contribution of a CYP24A1 mutation present in an heterozygous state to the occurrence of hypercalcemia (Figure 3, Group D), we investigated 21 adult relatives (nine females and 12 males; mean age, 36.5 y) recruited after genetic counseling of affected patients and harboring one CYP24A1 mutation (Supplemental Material 1). They have normal serum calcium and PTH levels. The 1,25-(OH)2D level is not significantly different from that of heterozygous patients (Group C). Again, simultaneous assay of both 25-OH-D3 and 24,25-(OH)2D3 provides evidence for the presence of normal CYP24A1 activity with a R ratio within the normal range, similar to patients of Group C.
One family was of particular interest (Figure 4 and Table 3). In this family, the proband (II-1) was followed for renal failure and referred to our laboratory for evaluation of intermittent hypercalcemia (≤ 4.4 mmol/L) with suppressed PTH in a context of vitamin D supplementation. Neither nephrocalcinosis nor nephrolithiasis was noticed on ultrasonography. He harbors two CYP24A1 mutations (c.443T>C/p.Leu148Pro and c.1187G>A/p.Arg396Gln) that were also found in his brother (II-3). One mutation was transmitted to his seven asymptomatic children who had calcium, ionized calcium, PTH, and 25-OH-D levels within the normal range. However, it is worthy to note that in this family, eight of 13 heterozygous subjects show slightly elevated 1,25-(OH)2D levels. Genetic counseling revealed a cousin (II-8) presenting with parathyroid adenoma and. In contrast, his wife (II-2), one of his daughters (III-7), and one of his grandsons (IV-3) complained of renal stones. Surprisingly, genetic analysis of IV-3 found two mutations: one inherited from his grandfather through his mother (c.443T>C / p.Leu148Pro) and a new mutation c.1186C>T / p.Arg396Trp inherited from his healthy father (III-8). To know whether heterozygous CYP24A1 mutation could be associated with chronic hypercalciuria and/or increased calcium absorption from the intestine due to abnormal 1,25-(OH)2D level, we performed absorption studies in this family calcium (Table 3). The increase in urinary calcium to creatinine ratio was high in the subject III-7 with renal stones, but normal in all the other heterozygous subjects.
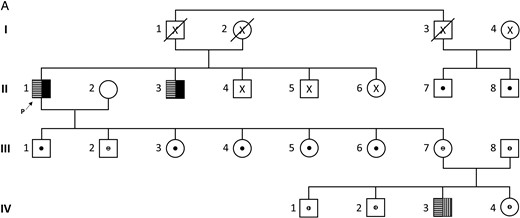
Pedigree of an informative family.
X, lack of molecular analysis;  : compound heterozygous state;
  : heterozygous carrier; Mutations:
  : c.443T>C; ■: c.1187G>A;
  : c.1186C>T. The arrow indicates the proband (p).
Clinical and Biochemical Data at the Time of Diagnosis, During the Pak Test, and Simultaneous LC-MS/MS Analyses of Serum Vitamin D Metabolite and Ratio According to the Genotype
| Patient | II-1 | II-2 | II-3 | II-7 | II-8# | III-1 | III-2 | III-3 | III-4 | III-5 | III-6 | III-7 | III-8 | IV-1 | IV-2 | IV-3 | IV-4 |
|---|---|---|---|---|---|---|---|---|---|---|---|---|---|---|---|---|---|
| Genotype | M/M | N/N | M/M | M/N | M/N | M/N | M/N | M/N | M/N | M/N | M/N | M/N | M/N | M/N | M/N | M/M | M/N |
| Age, | 81 | 73 | 70 | 85 | 73 | 51 | 50 | 48 | 46 | 44 | 36 | 47 | 50 | 22 | 19 | 18 | 10 |
| Sex (M/F) | M | F | M | M | M | M | M | F | F | F | F | F | M | M | M | M | F |
| Symptoms | G2 | NL (1) | NL | AS | PA | AS | AS | AS | AS | AS | AS | NL (1) | AS | AS | AS | NL (2) | AS |
| Calcium 2.2–2.60 mmol/L | 2.59 | 2.41 | 2.43 | 2.42 | 2.79 | 2.41 | 2.47 | 2.37 | 2.44 | 2.32 | 2.42 | 2.27 | 2.27 | 2.39 | 2.5 | 2.52 | 2.51 |
| PTH 12–88 pg/mL | 9.8 | 37 | 14 | 57 | 102 | 54 | 23 | 67 | 36 | 47 | 38 | 21 | 41 | 34 | 22 | 7 | 42 |
| 25-OH-D 50–125 nmol/L | 84.4 | 56.7 | 187.2 | 98.1 | 65.6 | 105.8 | 42.9 | 55.9 | 40.9 | 56.7 | 41.4 | 97.3 | 32.4 | 27 | 44.4 | 45.4 | 50.9 |
| 1,25 (OH)2-D 48–160 pmol/L | 238.2 | 142.8 | — | 215 | 378.7 | 236.4 | 130.2 | 135.6 | 240 | 169.2 | 186.7 | 156 | 144 | 156.7 | 230.6 | 155.5 | 248.6 |
| Pak test | |||||||||||||||||
| Calcium 2.2–2.60 mmol/L | |||||||||||||||||
| T0 | — | — | — | 2.31 | — | 2.31 | 2.32 | 2.03 | 1.91 | 2.24 | 2.29 | 2.26 | 2.06 | — | — | — | — |
| T60 | — | — | — | 2.39 | — | 2.33 | 2.40 | 2.38 | 2.11 | 2.37 | 2.48 | 2.40 | 2.22 | — | — | — | — |
| Ionized calcium 1.2–1.3 mmol/L | |||||||||||||||||
| T0 | — | — | — | 1.21 | — | 1.21 | 1.05 | 1.13 | 1.17 | 1.16 | 1.13 | 1.17 | 1.10 | — | — | — | — |
| T60 | — | — | — | 1.24 | — | 1.15 | 1.21 | 1.16 | 1.21 | 1.21 | 1.16 | 1.20 | 1.11 | — | — | — | — |
| PTH 12–88 pg/mL | |||||||||||||||||
| T0 | — | — | — | 58 | — | 62 | 36 | 31 | 29 | 39 | 26 | 26 | 30 | — | — | — | — |
| T60 | — | — | — | 41 | — | 35 | 16 | 14 | 12 | 14 | 9 | 10 | 25 | — | — | — | — |
| Urine calcium: creatinine | |||||||||||||||||
| T0 | — | — | — | 0.37 | — | 0.14 | 0.14 | 0.47 | 0.35 | — | 0.46 | 0.39 | 0.08 | — | — | — | — |
| T24 | — | — | — | 0.43 | — | 0.26 | 0.65 | 0.96 | 0.69 | 0.59 | 1.01 | 1.47 | 0.56 | — | — | — | — |
| Δ <0.6 | — | — | — | 0.06 | — | 0.12 | 0.51 | 0.49 | 0.34 | — | 0.55 | 1.08 | 0.48 | — | — | — | — |
| Simultaneous assay of serum Vitamin D metabolites* | |||||||||||||||||
| 25-OH-D3 >50 nmol/L | — | — | — | 44.4 | — | 82.4 | 61.2 | 89.6 | 73.6 | 100.3 | 83.1 | 130.0 | 42.4 | — | — | — | — |
| 24,25(OH)2D3 nmol/L | — | — | — | 3.4 | — | 6.5 | 4.3 | 6.7 | 4.8 | 5.5 | 5.0 | 13.9 | 3.6 | — | — | — | — |
| Ratio (<25) | — | — | — | 13.2 | — | 12.7 | 14.2 | 13.3 | 15.3 | 18.2 | 16.5 | 9.3 | 11.8 | — | — | — | — |
Abbreviations: —, no data; AS, asymptomatic; G2, Group 2; M, CYP24A1 mutation; M/N, heterozygosity; N, normal CYP24A1 sequence; NL, nephrolithiasis (renal stones: × episodes); PA, parathyroid adenoma.
Patient presenting with PA.
Normal ranges are indicated according to Kaufmann et al (17).
Discussion
This report presents extensive clinical and biochemical data on a large cohort of patients with a newly identified hypercalcemic syndrome characterized by vitamin D hypersensitivity caused by loss-of-function mutations in the CYP24A1 gene. Our study emphasizes that loss-of-function CYP24A1 mutations are frequently associated with serious renal complications including nephrolithiasis and nephrocalcinosis; it also demonstrates the accuracy and effectiveness of a novel blood test for the relevant vitamin D metabolites 25-OH-D3 and 24,25-(OH)2D3. In addition, it should be noted that in the era of widespread vitamin D supplementation, women with CYP24A1 defects could develop severe hypercalcemia during pregnancy associated with prematurity and intra-uterine growth retardation (19).
CYP24A1 loss-of-function mutations represent the most recent elucidated cause of hypercalcemia after PTHrP-mediated hypercalcemia of malignancy, hyperparathyroidism, milk-alkali syndrome, and vitamin D-mediated hypercalcemia due to either to vitamin D intoxication or poorly regulated 1α-hydroxylation, as observed in some granulomatous diseases or lymphoma. The field is still developing the most efficient ways to distinguish the various causes of hypercalcemia and our paper points to symptoms to look out for and biochemical techniques that can be used to diagnose and monitor the condition.
Since the first publication (3) reporting the association between CYP24A1 loss-of-function mutations and IIH, there have been approximately 10 follow-up papers over the past 3 years from several groups in Europe and North America (5–16), corroborating their findings and extending the age of patients into adulthood. In most cases these are reports limited to a single patient up to six patients. Consequently, our current report is one of the first on a large cohort in which patients with a medical history of hypercalcemia and low PTH levels were screened for CYP24A1 mutations. We included hypercalcemic patients with suppressed PTH, but normocalcemic patients with inappropriately low PTH (< 20 pg/mL) should be considered given that these two biological pictures could reflect two states of the same disease depending of vitamin D supplementation. Indeed, genetic counseling enabled us to find a patient with a normal serum calcium level but low PTH (IV-3; Table 3), harboring, however, biallelic CYP24A1 mutations (situation already reported) (10). Indeed, reduced rates of inactivation of 1,25-(OH)2D caused by a CYP24A1 defect result in a decreased 1,25-(OH)2D3 clearance and thus in increased calcium absorption from the intestine, favoring hypercalcemia, which in turn down-regulates PTH secretion through the vitamin D receptor and calcium-sensing receptor in the parathyroid cell. Tight balance between calcium load and renal function is also a determinant of plasma calcium levels as absorbed calcium is promptly excreted. Lastly, hypercalcemia and low PTH levels favor calcium excretion by the kidney, favoring nephrocalcinosis, further exacerbated by the hyperphosphaturia caused by high FGF23 levels in response to elevated calcitriol (11, 14).
In this population presenting with IIH we found biallelic mutations with a higher frequency than that described by Dauber et al (6) (19/72 and 1/27, respectively) suggesting that CYP24A1 mutations are a more frequent cause of idiopathic hypercalcemia in a French population than in a North American one. We confirm the presence of two hot spots found in 50% of cases: c.427_429del / p.Glu143del and c.1226T>C / p.Leu409Ser in exons 2 and 9, respectively, and functionally characterized by Schlingmann et al (3).
We classified two CYP24A1 variants p.Met374Thr and p.Arg157Trp as polymorphisms rather than mutations, despite predicted pathogenicity using in silico methods. We rationalized our classification on several criteria: (1) p.Met374Thr and p.Arg157Trp are found in the general population at high frequency (5.2 and 1.9% respectively) and p.M374Thr retained measurable enzyme activity in vitro. (2) Evaluation of serum vitamin D metabolites in an asymptomatic subject harboring the p.Met374Thr/p.Arg157Trp mutations showed a normal R, suggesting that at least one of these variants is a polymorphism. (3) A recently identified individual with p.Glu143del/p.Arg157Trp variants also had normal R, despite p.Glu143del being a frequent, and well-characterized CYP24A1 mutation. Taken together, these results suggest that p.Arg157Trp is a polymorphism, however we currently lack a serum sample from an individual with p.Met374Thr coupled with a known deleterious mutation to confirm whether this variant causes IIH.
Renal disease associated with CYP24A1 starts during infancy. The vast majority of children with biallelic mutations of CYP24A1 present with nephrocalcinosis as a manifestation of their increased sensitivity to vitamin D, even though they have small dietary vitamin D intakes. Castanet et al (10) suggested that restriction of vitamin D and sun protection might protect affected patients, particularly during the infant period, preventing acute hypercalcemia, as in one family in which the child who did not receive a vitamin D supplement and did not present with hypercalcemia or hypercalciuria despite having the same homozygous mutation as his older symptomatic brother. This observation conversely highlights the potentially deleterious contribution of vitamin D supplementation in these children. Recently the phenotype has been extended to adults with chronic renal disease (13, 15, 16). The lifetime prevalence of nephrolithiasis is high, estimated at 10–15%, as illustrated in the family described in Figure 4 and Table 3, in which subject II-2, without CYP24A1 mutation, presented with renal stones. Nesterova et al (8) estimated the frequency of kidney stones due to CYP24A1 deficiency to be 4–20%. Given the large number of patients who should be screened for CYP24A1 mutations, the LC-MS/MS assay for simultaneous measurement of several vitamin D metabolites including 24,25-(OH)2D3 in serum should constitute a useful screening tool. The ratio of 25-OH-D3:24,25-(OH)2D3 allows us to distinguish CYP24A1 defects from hypervitaminosis D during vitamin D intoxication, and was proposed as a more accurate parameter to express the absence of CYP24A1 activity than serum 24,25-(OH)2D3 alone, especially given that some of these patients have low vitamin D status and consequently low 24,25-OH2D levels (17).
In 17 patients with biallelic CYP24A1 mutations investigated with the same procedure [including our 15 patients and two patients published by Kaufmann et al (17)], serum 24,25-(OH)2D3 is very low or undetectable and outside of the normal range. However, this parameter alone is unable to distinguish patients with or without CYP24A1 mutations: it can be misleading if there is vitamin D deficiency with low serum 25-OH-D3. In our hands, the ratio 25-OH-D3:24,25-(OH)2D3 takes into consideration the circulating 25-OH-D3 level and provides a clear distinction from vitamin D deficiency. Thus, we suggest that a 25-OH-D3:24,25-(OH)2D3 ratio greater than 50, and usually greater than 80, is indicative of IIH due to inactivating CYP24A1 mutations in vivo. But the corollary is also true that all patients with a single or wild-type allele have a normal 25-OH-D3: 24,25-(OH)2D3 ratio.
The etiology of hypercalcemia in patients with normal 24-hydroxylase activity remains unclear. Normal 25-OH-D3 levels in these patients do not support vitamin D intoxication, whereas high 1,25-(OH)2D levels suggest another metabolic defect (22). We described patients harboring CYP24A1 mutations in a heterozygous state suggesting the hypothesis of an autosomal-dominant trait (7). These findings prompted us to investigate other subjects with one mutation and the most convenient was to study the relatives. In our study, all the heterozygous subjects, gene carriers, and hypercalcemic patients had normal 24-hydroxylase activity as confirmed in vivo by detectable 24,25-(OH)2-D3 level and a normal R ratio as also found by Meusburger (11). The Pak test also found normal calcium absorption in adult heterozygotes. These investigations suggest that their hypercalcemia is not due to CYP24A1 loss of function mutations.
However, heterozygous hypercalcemic neonates have higher 1,25-(OH)2D and lower PTH levels than asymptomatic adults, suggesting excessive vitamin D intake. We should hypothesize that the consequences of haploinsufficiency could vary during the growth from childhood to adulthood. Indeed, there are a number of functional changes that occur in the kidney that accompany an increase in the glomerular filtration rate, as the infant matures (20). The initial prematurity in renal function observed during the early infancy could explain a relative sensitivity of heterozygous children to hypercalcemia. Supporting this hypothesis, hypercalcemia in an infant with CYP24A1 biallelic mutations is most severe in the first days and months of life when renal function relative to body mass is low (3). In the case of heterozygous mutation, the vitamin D supplementation could exceed the capacity of haploinsufficient 25-OH-D3-24-hydroxylase activity in children (21). In contrast, the normal calcium intestinal absorption observed in the adult relatives ruled out the hypothesis of an autosomal-dominant inheritance. However, we cannot exclude the role of another currently unidentified factor in the etiology of IIH.
Conclusion
Our findings emphasize the importance of recognition, genetic diagnosis, and proper treatment of CYP24A1 defects. Mutations are frequently found in patients presenting with hypercalcemia with low or suppressed PTH, especially in patients with nephrocalcinosis or renal stones; inappropriately low PTH levels with normal serum calcium levels should be also taken into consideration. We confirm the accuracy and effectiveness of a novel blood test estimating the ratio between relevant vitamin D metabolites 25-OH-D3 and 24,25-(OH)2D3, which constitutes a useful screening tool for CYP24A1 mutations. Most of patients with CYP24A1 heterozygous mutation remain asymptomatic. However, the observation of hypercalcemic patients with such genotype could suggest that hypercalcemia may occur in the setting of excessive vitamin D intake. This study leads us to recommend preventive measures including restriction of vitamin D supplementation and dietary intakes that could protect affected relatives particularly during the neonatal period.
Acknowledgments
We thank all the physicians and the patients for their precious collaboration: Dr Quintard-Lacour and Professor Tessier (Nephrology, University Hospital, Limoges); Dr Maisin and Dr Kuzbari (Pediatrics, Robert Debré Hospital, Paris); Professor Linglart and Dr Rothenbuhler (Pediatrics, Kremlin-Bicêtre Hospital, Paris); Dr Boutignon (Compiegne Hospital), Dr Thibault (Pediatrics, University Hospital, Montpellier); Dr Taque (Pediatrics, University Hospital, Rennes); Dr D'Anella (Endocrinology, Avignon Hospital); Dr Dupre (Pediatrics, Valenciennes Hospital); Dr Djaghri (Neonatology, Sainte Camille Hospital, Bry-sur-Marne); Dr Ranchin (Pediatrics, University Hospital, Lyon), Professor Prie (Department of Physiology, Necker University Hospital, Paris).
G.J. is supported by the European Rare Diseases Consortium in conjunction with the Canadian Institutes for Health Research (Grant No. ERA-132931). G.J. also acknowledges the Waters Corporation for the provision of the Xevo TQ-S LC-MS/MS instrument used in these studies.
Disclosure Summary: The authors have nothing to disclose.
G.J. and M.L.K. contributed equally to the study.
Abbreviations
- 24,25-(OH)2D3
24,25-dihydroxyvitamin D3
- 25-OH-D3
25-hydroxyvitamin D3
- IIH
idiopathic infantile hypercalcemia
- LC-MS/MS
liquid chromatography tandem mass spectrometry
- R
ratio
- 1,23,25-(OH)3D3
1,23,25-trihydroxyvitamin D3
- 1,24,25-(OH)3D3
1,24,25-trihydroxyvitamin D3.
