


Undercarboxylated osteocalcin (ucOC) modulates insulin secretion and sensitivity in mice, and higher ucOC is associated with lower prevalence of diabetes in men. The influence of ucOC distinct from other markers of bone turnover on incidence of cardiovascular events is unclear.
Community-dwelling men aged 70–89 years resident in Perth, Western Australia.
Serum total osteocalcin (TOC), N-terminal propeptide of type I collagen (P1NP), and collagen type I C-terminal cross-linked telopeptide (CTX) were measured by immunoassay, and ucOC by hydroxyapatite binding. The ratio ucOC/TOC was calculated. Hospital admissions and deaths from myocardial infarction (MI) and stroke were ascertained.
There were 3384 men followed for 7.0 years, during which 293 experienced an MI, 251 stroke, and 2840 neither. In multivariate analyses, higher ratio of ucOC/TOC (expressed as %) was associated with lower incidence of MI (quartiles Q2–4, ≥49% versus Q1,<49%, hazard ratio 0.70, 95% confidence interval = 0.54–0.91), but not of stroke (0.99, 0.73–1.34). Higher P1NP was associated with higher incidence of MI (Q2–4, ≥28.2 μg/L versus Q1, <28.2 μg/L, hazard ratio 1.45, 95% confidence interval = 1.06–1.97), but not of stroke (0.94, 0.70–1.26). CTX was not associated with incident MI or stroke.
A reduced proportion of undercarboxylated osteocalcin or higher P1NP are associated with increased incidence of MI. UcOC/TOC ratio and P1NP predict risk of MI but not stroke, in a manner distinct from CTX. Further studies are needed to investigate potential mechanisms by which bone turnover markers related to metabolic risk and to collagen formation could modulate cardiovascular risk.
Osteocalcin is a peptide secreted by osteoblasts (1). It is present in the circulation in both γ-carboxylated and undercarboxylated forms that are markers of bone turnover and vitamin K availability (2). The γ-carboxylated form binds to hydroxyapatite and composes part of the bone matrix (1). Undercarboxylated osteocalcin (ucOC) has been identified as an endocrine regulator of glucose metabolism in mice, acting via a G protein–coupled receptor GPRC6A (3, 4). In these studies, the amount of ucOC as a proportion of total osteocalcin (TOC) in the circulation was increased in mice resistant to the development of diabetes (3). Consistent with this finding, administration of ucOC in vitro and in wild-type mice increased insulin secretion and sensitivity (4, 5).
We have recently demonstrated that in older men, higher serum ucOC concentrations are associated with lower risk of diabetes, independently of age, body mass index (BMI), other conventional risk factors, and unrelated bone turnover markers (6). However, the long-term implications of this association on major health outcomes remain unclear. Previous studies have documented associations of lower TOC concentrations with adiposity, adverse cardiovascular risk factors, and the metabolic syndrome (7–9). In a study of mainly men who were aged 40 years or younger, men who had experienced premature myocardial infarction (MI) had lower TOC concentrations compared with age-matched controls (10). Smaller studies have reported associations of higher ucOC with improved markers of glucose metabolism (11, 12). However, other reports have shown similar associations of ucOC and carboxylated or total osteocalcin with insulin resistance, markers of β-cell function, and risk of developing diabetes (13–15). Some studies were limited by relatively small sample sizes and measured ucOC using immunoassays (12, 14, 15), which, in the absence of a hydroxyapatite binding step to remove carboxylated osteocalcin, may overestimate ucOC (2). Using a hydroxyapatite binding step, Levinger et al showed that ucOC was associated with whole body insulin sensitivity both at rest and postexercise in obese men (16). Nevertheless, existing studies remain limited by lack of extended follow-up to examine the relationship of ucOC to long-term outcomes such as incidence of cardiovascular events.
Given the association of ucOC with diabetes (6), and the established association between diabetes with vascular risk (17), we aimed to test the hypothesis that ucOC, or the proportion of ucOC in the circulation relative to TOC, would predict the incidence of MI or stroke in a large, population-based cohort of older men in whom ucOC was measured using a hydroxyapatite-binding assay (18). To determine associations of ucOC or the ratio of ucOC/TOC with incident MI or stroke, we compared these with the nonosteocalcin bone turnover markers N-terminal propeptide of type I collagen (P1NP) and collagen type I C-terminal cross-linked telopeptide (CTX) (19).
Participants and Methods
Study population
The Health In Men Study is a cohort study of community-dwelling older men from Perth, Western Australia, which has been described previously (20). Briefly, men aged 65 years or more were randomly selected from the electoral roll (voting being compulsory for Australian citizens) and invited to participate in the study, from which 12 203 men completed a questionnaire and attended for physical examination in wave 1 (W1, 1996–1999). A total of 4248 men attended for reassessment and venesection in wave 2 (W2, 2001–2004). Approximately 95% of the men were Caucasian. The University of Western Australia Human Research Ethics Committee approved the study, and all men gave written informed consent.
Assessment of medical comorbidities
Medical data collected at W2 were used to identify men with a history of osteoporosis or bone fracture and Paget's disease. Medication data were analyzed to identify men receiving bisphosphonates or glucocorticoids. The list of medications included then-available oral and parenteral bisphosphonates (alendronate, risedronate, and zoledronic acid) and the range of glucocorticoid preparations (cortisone, hydrocortisone, dexamethasone, and prednisolone). Because γ-carboxylation is a vitamin K–dependent process, we also identified men who were receiving warfarin. Men were considered to have hypertension if they reported this diagnosis at W1 or W2, or used antihypertensive medication or had blood pressure at least 140/90 mm Hg at W2. Dyslipidemia was defined as having fasting high-density lipoprotein lower than 0.9 mmol/L, low-density lipoprotein at least 3.4 mmol/L, triglycerides at least 1.8 mmol/L, or total cholesterol at least 5.5 mmol/L, or receiving lipid-lowering therapy at W2. Men diagnosed with diabetes, reporting use of glucose-lowering medication, or with fasting or nonfasting glucose at W2 of at least 7 mmol/L or at least 11.1 mmol/L, respectively, were considered to have (predominantly type 2) diabetes. Further assessment of morbidity was performed via the Western Australian Data Linkage System (WADLS), which provides electronic linkage to records from death, hospital, and cancer registries and captures admissions to all public and private hospitals in Western Australia (21). Cancer diagnoses were identified from the cancer registry between 1990 and W2. Prevalent cardiovascular disease (CVD) was defined as self-reported history of angina, acute MI, stroke, or abdominal aortic aneurysm by questionnaire responses in W1 and W2, or hospital diagnoses of these conditions before W2.
Ascertainment of incident MI and stroke
The occurrence of hospital admissions from MI and stroke and death from these causes were obtained from WADLS. This contains hospital admissions data and complete morbidity coding, death certificates, and the International Classification of Diseases-10 coded record generated from these data and other sources by the Australian Bureau of Statistics (21). We examined the outcome of nonfatal or fatal MI based on hospital admissions and deaths from MI comprising International Classification of Diseases-9 and International Classification of Diseases-10 codes 410, I21, and I22. For the outcome of fatal or nonfatal stroke codes 430–438, I60–I64, and I69.0–I69.4 were used. Both hemorrhagic and ischemic stroke were included. At the time of linkage, all hospital admissions and deaths occurring in Western Australia until the end 2010 had been recorded in WADLS. Surviving men were censored 8 years after the collection of blood samples and no later than December 31, 2010.
Laboratory assays
Blood samples were collected between 8:00 am and 10:30 am at W2. Aliquots of plasma and serum were prepared immediately following phlebotomy and stored at −80°C until assayed. Serum TOC, P1NP, and CTX were measured by electrochemiluminescence immunoassay using a Modular E170 analyzer (Roche Diagnostics), as previously described (18). Coefficient of variation was TOC 3.7% and 2.9% at 18 and 89 ug/L; P1NP 4.0% and 5.7% at 28 and 191 ug/L; and CTX 4.1% and 3.8% at 0.31 and 0.71 ug/L. Serum samples were incubated with hydroxyapatite (5 mg/mL), mixed and centrifuged to separate out carboxylated osteocalcin as previously described (18). The ucOC in the supernatant was measured using the same assay as for TOC and was reported as a concentration and as the ratio of ucOC/TOC. For a reference osteocalcin standard with expected fractional hydroxyapatite binding of 0.80, kindly supplied by Professor Caren Gundberg (Yale School of Medicine, New Haven, CT), mean fractional hydroxyapatite-bound osteocalcin was 0.77 and between-run imprecision was 6.0%. Vitamin D was measured using a chemiluminescent immunoassay, as previously reported (22).
Statistical analyses
The statistical package Stata, version 12.1 (StataCorp), was used. Men receiving glucocorticoid, bisphosphonate, or warfarin treatment were excluded. Baseline descriptive data were shown as mean and standard deviations (SD) or percentages (%). Comparisons of means were performed using two sample t tests with equal variances, which are robust for parametric and modestly skewed distributions with sufficiently large sample sizes (23). Nelson-Aalen plots of incident nonfatal or fatal MI and stroke according to quartiles of TOC, ucOC, the ratio of ucOC/TOC, P1NP, and CTX were constructed. For the primary longitudinal analysis, Cox proportional hazards regression was performed to assess associations of TOC, ucOC, the ratio of ucOC/TOC, P1NP, and CTX with incident MI or stroke. Adjustments were made for variables that might potentially confound associations of bone turnover markers with cardiovascular events. Models were age-adjusted, with subsequent additional adjustment for education, smoking, BMI, waist:hip ratio (WHR), then for hypertension, dyslipidemia, diabetes, creatinine, and vitamin D, and finally for history of cancer or existing CVD. A two-tailed P value < .05, or 95% confidence intervals that did not cross 1.0, were considered significant.
Results
Baseline characteristics of study participants
Assay of bone turnover markers was performed in serum aliquots collected at baseline (W2) from 4010 men. Of these, we excluded 24 men with a history of Paget's disease of the bone, 127 with osteoporosis, and 192 with bone fracture. An additional 11 men reported receiving bisphosphonate therapy, 60 reported glucocorticoid therapy, and 212 reported warfarin use. Exclusion of these men left 3384 men for inclusion in the analysis. Baseline characteristic of these men are shown in Table 1. Compared to men who experienced neither MI nor stroke during follow-up, men who experienced either were older, more likely to have prevalent diabetes and CVD, and had higher creatinine concentrations. Men who experienced an MI were also more likely to have smoked compared to men who experienced neither MI nor stroke. TOC, ucOC, and CTX were higher in men who experienced an MI, but the ratio ucOC/TOC was lower. Men who experienced a stroke had similar bone turnover markers at baseline compared to men who experienced neither MI nor stroke.
Baseline Characteristics of The Study Population
| Variable | Neither MI nor Stroke (n = 2840) | MI (n = 293) | P1 Value | Stroke (n = 251) | P2 Value |
|---|---|---|---|---|---|
| Age: 70–74 years | 1169 (41.2) | 74 (25.3) | 65 (25.9) | ||
| 75–79 years | 1210 (42.6) | 133 (45.4) | <.001 | 108 (43.0) | .004 |
| 80–84 years | 400 (14.1) | 64 (21.8) | <.001 | 64 (25.5) | <.001 |
| 85+ | 61 (2.1) | 22 (7.5) | <.001 | 14 (5.6) | <.001 |
| Completed high school | 1393 (49.1) | 141 (48.3) | .796 | 114 (45.4) | .266 |
| Smoker: never | 1019 (35.9) | 84 (28.7) | 78 (31.1) | ||
| Past | 1690 (59.5) | 199 (67.9) | .009 | 158 (62.9) | .165 |
| Current | 131 (4.6) | 10 (3.4) | .825 | 15 (6.0) | .175 |
| BMI ≥25 kg/m2 | 1859 (65.6) | 194 (66.9) | .651 | 175 (70.3) | .133 |
| WHR ≥0.90 | 2412 (85.1) | 250 (85.6) | .806 | 221 (88.4) | .156 |
| Hypertension | 2182 (76.8) | 230 (78.5) | .519 | 194 (77.3) | .868 |
| Dyslipidemia | 2049 (72.1) | 223 (76.1) | .149 | 193 (76.9) | .107 |
| Diabetes | 393 (13.8) | 60 (20.5) | .002 | 49 (19.5) | .014 |
| CVD | 869 (31.8) | 162 (56.6) | <.001 | 116 (47.9) | <.001 |
| Cancer | 509 (17.9) | 45 (15.4) | .274 | 43 (17.1) | .754 |
| Creatinine, μmol/L | 91.7 ± 30.4 | 104.3 ± 40.2 | <0.001 | 97.2 ± 32.9 | 0.008 |
| Vitamin D, nmol/L | 68.5 ± 23.5 | 67.2 ± 21.7 | .364 | 67.1 ± 20.7 | .375 |
| Total OC, μg/L | 20.8 ± 12.1 | 23.9 ± 15.0 | <.001 | 21.7 ± 16.5 | .301 |
| Undercarboxylated OC, μg/L | 11.0 ± 5.0 | 12.2 ± 6.9 | <.001 | 11.3 ± 6.6 | .462 |
| Undercarboxylated/total OC, % | 54.7 ± 8.8 | 53.0 ± 9.7 | .001 | 54.2 ± 8.9 | .404 |
| P1NP, μg/L | 42.8 ± 28.7 | 46.1 ± 29.8 | .060 | 41.7 ± 27.0 | .562 |
| CTX, μg/L | 0.32 ± 0.17 | 0.35 ± 0.23 | .002 | 0.33 ± 0.19 | .347 |
Characteristics of the study participants at baseline (n = 3384); stratified according to whether men experienced an MI or stroke during follow-up. Data are shown as number (%) for categorical variables and mean ± sd for continuous variables. P1 compares men with incident MI to those with neither MI nor stroke; P2 compares men with incident stroke to those with neither MI nor stroke.
Incidence of MI and stroke during follow-up
The mean (±SD) duration of follow-up was 6.97 ± 1.99 years. During this time, 293 men experienced a death or hospitalization because of MI and 251 from stroke. Cumulative incidence of MI according to quartiles of TOC, ucOC, ucOC/TOC, P1NP, and CTX are shown in Figure 1, and the corresponding results for cumulative incidence of stroke in the Supplemental Figure. Higher TOC and CTX concentrations were associated with increased incidence of MI (Figure 1, A and E, respectively). Men with ucOC/TOC in the lowest quartile had the highest incidence of MI, and men with P1NP in the lowest quartile had the lowest incidence of MI (Figure 1, C and D, respectively). UcOC was not associated with risk of MI (Figure 1B). There was no apparent association of any of these markers with incidence of stroke (Supplemental Figure).
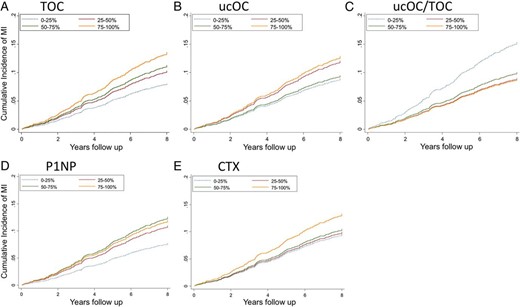
Nelson-Aalen plots showing the cumulative incidence of nonfatal or fatal MI according to quartiles of (A) TOC, (B) ucOC, (C) the ratio of ucOC/TOC, (D) serum P1NP, and (E) CTX in 3384 community-dwelling men aged 70–89 years.
Multivariate analyses of bone turnover markers versus incidence of MI
The results of the longitudinal analyses examining baseline bone turnover markers against the outcome of incident MI are shown in Table 2. In the univariate model, higher TOC was associated with increased risk of MI. However, this association was abrogated by adjustment for age, and was not present in the fully adjusted model. A higher ratio of ucOC/TOC was associated with reduced incidence of MI in univariate and full-adjusted models (quartiles Q2–4, ≥49% versus Q1, <49%: hazard ratio [HR] 0.70, 95% confidence interval [CI] 0.54–0.91). Higher P1NP was associated with increased incidence of MI (Q2–4, ≥28.2 μg/L versus Q1, <28.2 μg/L: HR 1.45, 95% CI 1.06–1.97). CTX was not associated with incident MI.
Associations of ucOC and Other Bone Turnover Markers in Quartiles With Non-Fatal and Fatal Myocardial Infarction in Older Men
| Variable | Range | MI N (%) | Univariate HR (95% CI) | Model 1 HR (95% CI) | Model 2 HR (95% CI) | Model 3 HR (95% CI) | Model 4 HR (95% CI) |
|---|---|---|---|---|---|---|---|
| OC (μg/L) Q1 | 4.64–14.69 | 56 (7.1) | 1.00 | ||||
| OC (μg/L) Q2–4 | 14.70–248.30 | 237 (10.1) | 1.44 (1.08–1.93) | 1.22 (0.91–1.64) | 1.24 (0.92–1.67) | 1.55 (1.15–2.09) | 1.28 (0.94–1.74) |
| UcOC (μg/L) Q1 | 3.00–8.04 | 62 (7.9) | 1.00 | ||||
| UcOC (μg/L) Q2–4 | 8.06–86.02 | 231 (9.9) | 1.29 (0.97–1.70) | 1.13 (0.85–1.50) | 1.12 (0.84–1.48) | 1.33 (1.00–1.77) | 1.14 (0.85–1.53) |
| ucOC/TOC Q1 | 5.51–48.96 | 102 (13.1) | 1.00 | ||||
| ucOC/TOC Q2–4 | 48.99–87.30 | 191 (8.1) | 0.60 (0.47–0.76) | 0.66 (0.52–0.84) | 0.67 (0.52–0.85) | 0.64 (0.50–0.82) | 0.70 (0.54–0.91) |
| P1NP (μg/L) Q1 | 9.45–28.19 | 53 (6.8) | 1.00 | ||||
| P1NP (μg/L) Q2–4 | 28.20–710.10 | 240 (10.2) | 1.53 (1.14–2.06) | 1.42 (1.05–1.91) | 1.42 (1.05–1.92) | 1.59 (1.17–2.16) | 1.45 (1.06–1.97) |
| CTX (μg/L) Q1 | 0.04–0.20 | 67 (8.5) | 1.00 | ||||
| CTX (μg/L) Q2–4 | 0.20–2.53 | 226 (9.6) | 1.18 (0.90–1.54) | 1.03 (0.79–1.36) | 1.02 (0.77–1.35) | 1.21 (0.91–1.60) | 1.03 (0.77–1.37) |
Proportional hazards regression of total OC, ucOC, ucOC/total OC, P1NP, and CTX for the outcome of nonfatal and fatal MI. Results are shown for men in the highest three quartiles compared with men in the lowest quartile (Q2–4 versus reference Q1).
Model 1: adjusted for age.
Model 2: adjustment as in model 1 and for education, smoking, BMI, and WHR.
Model 3: adjustment as in model 2 and for hypertension, dyslipidemia, diabetes, creatinine, and vitamin D.
Model 4: adjustment as in model 3 and for prevalent CVD and cancer.
Multivariate analyses of bone turnover markers versus incidence of stroke
The results of the longitudinal analyses examining baseline bone turnover markers against the outcome of incident stroke are shown in Table 3. There was no association of TOC, ucOC, the ratio of ucOC/TOC, P1NP, or CTX with incident stroke in either univariate or adjusted analyses.
Associations of ucOC and Other Bone Turnover Markers in Quartiles With Nonfatal and Fatal Stroke in Older Men
| Variable | Range | Stroke N (%) | Univariate HR (95% CI) | Model 1 HR (95% CI) | Model 2 HR (95% CI) | Model 3 HR (95% CI) | Model 4 HR (95% CI) |
|---|---|---|---|---|---|---|---|
| OC (μg/L) Q1 | 4.64–14.69 | 62 (7.8) | 1.00 | ||||
| OC (μg/L) Q2–4 | 14.70–248.30 | 189 (8.2) | 1.05 (0.79–1.40) | 0.90 (0.67–1.20) | 0.93 (0.70–1.25) | 1.14 (0.85–1.54) | 0.98 (0.72–1.33) |
| UcOC (μg/L) Q1 | 3.00–8.04 | 64 (8.1) | 1.00 | ||||
| UcOC (μg/L) Q2–4 | 8.06–91.10 | 187 (8.1) | 1.02 (0.76–1.35) | 0.91 (0.68–1.21) | 0.93 (0.70–1.24) | 1.09 (0.81–1.46) | 0.99 (0.73–1.33) |
| ucOC/TOC Q1 | 5.51–48.96 | 66 (8.9) | 1.00 | ||||
| ucOC/TOC Q2–4 | 48.99–87.30 | 185 (7.9) | 0.87 (0.66–1.16) | 0.96 (0.72–1.27) | 0.91 (0.69–1.21) | 0.85 (0.64–1.13) | 0.99 (0.73–1.34) |
| P1NP (μg/L) Q1 | 8.12–28.19 | 65 (8.2) | 1.00 | ||||
| P1NP (μg/L) Q2–4 | 28.20–710.10 | 186 (8.1) | 0.99 (0.74–1.31) | 0.92 (0.69–1.22) | 0.92 (0.69–1.23) | 1.02 (0.77–1.37) | 0.94 (0.70–1.26) |
| CTX (μg/L) Q1 | 0.04–0.20 | 64 (8.1) | 1.00 | ||||
| CTX (μg/L) Q2–4 | 0.20–2.53 | 187 (8.1) | 1.02 (0.77–1.36) | 0.92 (0.69–1.22) | 0.94 (0.70–1.25) | 1.08 (0.80–1.44) | 0.97 (0.72–1.31) |
Proportional hazards regression of total OC, ucOC, ucOC/total OC, P1NP, and CTX for the outcome of nonfatal and fatal stroke. Results are shown for men in the highest three quartiles compared with men in the lowest quartile (Q2–4 versus reference Q1).
Model 1: adjusted for age.
Model 2: adjustment as in model 1 and for education, smoking, BMI, and WHR.
Model 3: adjustment as in model 2 and for hypertension, dyslipidemia, diabetes, creatinine, and vitamin D.
Model 4: adjustment as in model 3 and for prevalent CVD and cancer.
Trimmed analysis of bone turnover and incidence of MI
To verify that the results were not influenced by the presence of low or high outliers, we repeated the longitudinal analyses after excluding men with concentrations of bone turnover markers in the lowest or highest 1% of values (Supplemental Table 1). Exclusion of low and high outliers (n = 62) did not alter the results. A higher ratio of ucOC/TOC remained associated with lower incidence of MI (Q2–4, ≥49% versus Q1, <49%: HR 0.75, 95% CI 0.57–0.99), whereas higher P1NP remained associated with higher incidence of MI (Q2–4, ≥28.2 μg/L versus Q1, <28.2 μg/L: HR 1.54, 95% CI 1.09–2.17).
Sensitivity analysis
We repeated the longitudinal analyses after excluding men who experienced an MI within the first 12 months of follow-up (n = 56). Results are shown in Supplemental Table 2. Exclusion of events occurring within the first year of follow-up did not alter the association of higher ucOC/TOC ratio with lower risk of MI (Q2–4 vs Q1: fully adjusted HR 0.70, 95% CI 0.54–0.92). Higher P1NP remained associated with higher risk of MI (Q2–4 vs Q1: fully adjusted HR 1.49, 95% CI 1.07–2.06).
Supplementary analyses
We tested whether ucOC/TOC ratio and P1NP remained associated with incident MI after excluding men with diabetes at baseline (Table 4). Excluding men with diabetes gives a fully adjusted HR for incident MI for Q2–4 versus Q1 ucOC/TOC of 0.75 compared to 0.70, and Q2–4 versus Q1 P1NP of 1.38 compared to 1.45 in the original analyses (Table 2). We performed a second supplementary analysis excluding men with metabolic syndrome (Table 5). Excluding men with metabolic syndrome gives a fully adjusted HR for Q2–4 versus Q1 ucOC/TOC of 0.70, and for Q2–4 vs Q1 P1NP 1.43. In both supplementary analyses, the HRs are largely unchanged compared to the original results, but statistical power is less with exclusion of these subgroups. When men with estimated glomerular filtration rate higher than 30 ml/min/1.73 m2 were excluded, the results were similar with HR for Q2–4 versus Q1 ucOC/TOC being 0.77, and for Q2–4 versus Q1 P1NP 1.39 (Supplemental Table 3).
Associations of ucOC and Other Bone Turnover Markers in Quartiles With Nonfatal and Fatal Myocardial Infarction in Nondiabetic Older Men
| Variable | Range | MI N (%) | Univariate HR (95% CI) | Model 1 HR (95% CI) | Model 2 HR (95% CI) | Model 3 HR (95% CI) | Model 4 HR (95% CI) |
|---|---|---|---|---|---|---|---|
| OC (μg/L) Q1 | 4.6–14.7 | 42 (7.2) | |||||
| OC (μg/L) Q2–4 | 14.7–148.1 | 191 (9.1) | 1.29 (0.92–1.80) | 1.09 (0.78–1.53) | 1.12 (0.80–1.57) | 1.27 (0.90–1.78) | 1.05 (0.74–1.48) |
| UcOC (μg/L) Q1 | 3.0–8.0 | 46 (7.8) | |||||
| UcOC (μg/L) Q2–4 | 8.1–79.9 | 187 (9.0) | 1.18 (0.85–1.62) | 1.05 (0.76–1.45) | 1.04 (0.75–1.44) | 1.12 (0.81–1.54) | 0.97 (0.70–1.35) |
| ucOC/TOC Q1 | 5.7–49.0 | 80 (11.6) | 1.00 | ||||
| ucOC/TOC Q2—4 | 49.0–86.8 | 153 (7.7) | 0.64 (0.49–0.84) | 0.71 (0.54–0.93) | 0.71 (0.54–0.93) | 0.68 (0.52–0.91) | 0.75 (0.57–1.01) |
| P1NP (μg/L) Q1 | 9.5–28.2 | 37 (6.2) | 1.00 | ||||
| P1NP (μg/L) Q2–4 | 28.2–710.1 | 196 (9.4) | 1.54 (1.08–2.19) | 1.44 (1.02–2.05) | 1.47 (1.03–2.10) | 1.51 (1.06–2.16) | 1.38 (0.96–1.98) |
| CTX (μg/L) Q1 | 0.0–0.2 | 46 (7.6) | |||||
| CTX (μg/L) Q2–4 | 0.2–2.5 | 187 (9.0) | 1.23 (0.89–1.69) | 1.08 (0.78–1.50) | 1.07 (0.77–1.48) | 1.19 (0.86–1.66) | 1.00 (0.71–1.40) |
Proportional hazards regression of total OC, ucOC, ucOC/total OC, P1NP, and CTX for the outcome of nonfatal and fatal MI, after excluding men with diabetes at baseline (n = 453). Results are shown for men in the highest three quartiles compared with men in the lowest quartile (Q2–4 versus reference Q1).
Model 1: adjusted for age.
Model 2: adjustment as in model 1 and for education, smoking, BMI, and WHR.
Model 3: adjustment as in model 2 and for hypertension, dyslipidemia, creatinine, and vitamin D.
Model 4: adjustment as in model 3 and for prevalent CVD and cancer.
Associations of ucOC and Other Bone Turnover Markers in Quartiles With Nonfatal and Fatal Myocardial Infarction in Older Men Without Metabolic Syndrome
| Variable | Range | MI N (%) | Univariate HR (95% CI) | Model 1 HR (95% CI) | Model 2 HR (95% CI) | Model 3 HR (95% CI) | Model 4 HR (95% CI) |
|---|---|---|---|---|---|---|---|
| OC (μg/L) Q1 | 4.6–14.7 | 32 (7.2) | |||||
| OC (μg/L) Q2–4 | 14.7–143.2 | 152 (9.5) | 1.32 (0.90–1.94) | 1.09 (0.74–1.60) | 1.14 (0.77–1.68) | 1.35 (0.92–2.00) | 1.10 (0.74–1.63) |
| UcOC (μg/L) Q1 | 3.0–8.0 | 34 (7.6) | |||||
| UcOC (μg/L) Q2–4 | 8.1–79.9 | 150 (9.4) | 1.28 (0.88–1.85) | 1.14 (0.79–1.66) | 1.14 (0.79–1.66) | 1.24 (0.85–1.81) | 1.09 (0.75–1.59) |
| ucOC/TOC Q1 | 22.1–49.0 | 66 (12.5) | 1.00 | ||||
| ucOC/TOC Q2–4 | 49.0–87.3 | 118 (7.8) | 0.61 (0.45–0.82) | 0.69 (0.51–0.94) | 0.67 (0.50–0.92) | 0.62 (0.45–0.84) | 0.70 (0.51–0.97) |
| P1NP (μg/L) Q1 | 9.5–28.2 | 30 (6.3) | 1.00 | ||||
| P1NP (μg/liter) Q2–4 | 28.2–710.1 | 154 (9.8) | 1.57 (1.06–2.32) | 1.46 (0.99–2.16) | 1.48 (0.99–2.20) | 1.56 (1.05–2.34) | 1.43 (0.95–2.15) |
| CTX (μg/L) Q1 | 0.1–0.2 | 36 (8.0) | |||||
| CTX (μg/L) Q2—4 | 0.2–2.5 | 148 (9.3) | 1.19 (0.83–1.71) | 1.03 (0.71–1.48) | 1.01 (0.70–1.46) | 1.18 (0.82–1.72) | 0.98 (0.67–1.43) |
Proportional hazards regression of total OC, ucOC, ucOC/total OC, P1NP, and CTX for the outcome of nonfatal and fatal MI, after excluding men with metabolic syndrome at baseline (n = 1186). Metabolic syndrome was defined according to the National Cholesterol Education Program-Adult Treatment Panel classification as three or more of waist circumference >102 cm, fasting plasma glucose ≥5.6 mmol/liter, or a known diagnosis of diabetes, fasting triglycerides ≥1.7 mmol/liter, fasting high-density lipoprotein cholesterol <1.03 mmol/liter, or blood pressure ≥130/85 mm Hg. Men with a previous diagnosis of hypertension or taking antihypertensive therapy were regarded as fulfilling the criterion for hypertension. Results are shown for men in the highest three quartiles compared with men in the lowest quartile (Q2–4 versus reference Q1).
Model 1: adjusted for age.
Model 2: adjustment as in model 1 and for education, smoking, BMI, and WHR.
Model 3: adjustment as in model 2 and for hypertension, dyslipidemia, diabetes, creatinine, and vitamin D.
Model 4: adjustment as in model 3 and for prevalent CVD and cancer.
Discussion
In older men without preexisting osteoporosis or history of bone fracture who were not receiving glucocorticoids, bisphosphonates, or warfarin, a higher ratio of ucOC/TOC predicted a lower incidence of hospitalizations or deaths from MI. By contrast, higher serum P1NP was associated with higher incidence of hospital admissions and deaths from MI. The results could not be accounted for by age or other conventional cardiovascular risk factors. Of note, these divergent associations were outcome- and marker-specific, being present for MI but not stroke and not seen with a different marker of bone turnover, CTX. Therefore, lower ucOC/TOC and higher P1NP are biomarkers for, or contributors to, increased risk of MI in older men.
Previous studies have associated reduced TOC with metabolic syndrome (7–9), coronary artery disease (10, 24) and mortality risk (25, 26). None of those studies reported ucOC data, nor were other markers of bone metabolism other than CTX assayed for comparative purposes. Given the association of lower TOC with adverse metabolic parameters, CVD, and mortality, in this study we examined as outcomes the two principle manifestations of CVD, namely MI and stroke. Of note, TOC was not associated with either outcome, instead a higher proportion of ucOC predicted lower incidence of MI.
UcOC measured by immunoassay without a precipitation step has been associated with better indices of glucose metabolism in older men (12) and men with type 2 diabetes (27). However, in several studies associations of ucOC and total or carboxylated osteocalcin with metabolic outcomes were comparable (11, 13–15). These studies have been limited by sample size, and the possibility of overestimation of ucOC in the absence of a precipitation step (2). In a cross-sectional analysis of 63 overweight and obese adults with normal or impaired fasting glucose, TOC was associated with insulin sensitivity determined by iv glucose tolerance testing, whereas the ratio of ucOC/TOC measured using hydroxyapatite binding was associated with β-cell responses to glucose (28). Until now, large longitudinal studies examining the association of ucOC or the ratio of ucOC/TOC measured using hydroxyapatite binding with the outcome of cardiovascular events have been lacking. In the current study, we found that a lower proportion of circulating ucOC relative to TOC was robustly associated with incident MI, but not stroke. Therefore, in older men, lower ucOC/TOC ratios may be biomarkers for or contributors to the risk of atherothrombotic events in the coronary circulation.
The presence of common and contrasting etiologies for MI and stroke would accommodate differential associations with distinct biomarkers or modulating factors (29). Our analyses suggest that the observed associations of ucOC/TOC, and also P1NP, with incident MI are largely not accounted for by the presence of diabetes or metabolic syndrome. With regard to MI, there has been previous interest in the association of markers of collagen turnover and cardiovascular outcomes (10). The combination of elevated type 1 collagen telopeptide (ICTP) and brain natriuretic peptide was associated with all-cause mortality and with a composite of CVD death and heart failure hospitalization in a longitudinal analysis of 476 patients with congestive heart failure following MI (30). It has been postulated that ICTP represented a breakdown product of type 1 collagen arising from the action of matrix metalloproteinases involved in myocardial tissue repair after acute coronary syndromes, whereas CTX reflected cathepsin-mediated breakdown of type 1 collagen in bone (31). However, in men, both ICTP and CTX are elevated following either acute coronary syndrome or a tibial shaft fracture, indicating an overlap of these markers in detecting bone and soft-tissue collagen degradation (31).
A higher ratio of amino-terminal propeptide of procollagen type III (PIIINP) to ICTP has been reported following MI (32). PIIINP is structurally different from P1NP, being a marker of type 3 rather than type 1 collagen synthesis. Both type 1 and type 3 collagen are present in the myocardium, thus acute myocardial damage leading to left ventricular remodelling may manifest with elevations in markers of collagen synthesis and degradation traditionally associated with bone metabolism (33). This differs from our study, in which baseline P1NP and CTX were measured, with the outcome of MI occurring years after. In other studies, higher ICTP and PIIINP as well as the bone turnover marker urinary deoxypyridinoline have been associated with mortality in men (34, 35). We found that higher P1NP, but not CTX, was associated with greater risk of incident MI. Therefore, the association of P1NP with incident MI was not a reflection of a generalized increase in vascular matrix collagen degradation because no comparable association was seen with CTX. Instead, our results identify P1NP as a novel biomarker for risk of MI in older men. Further investigation would be required to clarify whether in this setting P1NP may reflect an interaction between bone formation and the vasculature, or a specific pathway involving collagen synthesis.
Osteoblast-lineage cells are present in the circulation making up 1–2% of mononuclear cells; these cells are positive for osteocalcin and are capable of forming mineralized nodules in vitro (36). Furthermore, circulating endothelial progenitor cells from patients with coronary atherosclerosis are more likely to express osteocalcin compared with endothelial progenitor cells from control patients with normal coronary arteries (37). Thus, osteoblast-like cellular activity occurs in the vasculature and it is conceivable that increased P1NP concentrations are indicative of this process. It is not known to what extent these cells contribute to amounts or proportions of ucOC and TOC in the circulation. Increased numbers of osteoblast-like cells are associated with vascular calcification, which may be an intermediate step mediating adverse cardiovascular outcomes (37, 38).
The finding that lower ucOC/TOC ratio rather than TOC was predictive of incident MI, but not stroke, is noteworthy. The ratio of ucOC/TOC has been used as a marker of vitamin K status because vitamin K deficiency impairs γ-carboxylation of osteocalcin and vitamin K supplementation reduces ucOC concentrations (39). Vitamin K deficiency has been associated with higher ucOC/TOC ratios, and this has been proposed as a contributor to arterial calcification in the coronary circulation (40). By contrast, we found that higher ucOC/TOC ratios were independently associated with lower incidence of MI. Therefore, deficiency of vitamin K is unlikely to account for our findings because vitamin K repletion would lead to lower rather than higher ucOC/TOC ratios. Instead, our findings are consistent with higher ucOC/TOC ratio representing a novel biomarker for reduced cardiovascular risk, possibly mediated via more favorable metabolic profiles as demonstrated in the original animal studies (3, 4). Although a reduced ratio of ucOC/TOC identifies men at risk of MI, further studies are needed to clarify mechanisms underlying this association and whether an optimal hormonal milieu incorporating input from bone and glucose metabolism modulates CVD risk. Ultimately, placebo-controlled trials of ucOC would be needed to directly establish cause and effect.
Strengths of this study include the large cohort of community-dwelling men; the measurement of ucOC using a hydroxyapatite-binding assay; the parallel measurement of total osteocalcin, P1NP, and CTX to compare and contrast associations of different bone turnover markers with incident MI and stroke; the accrual of large numbers of outcome events adding power to the longitudinal analyses; and the systematic adjustment for potential confounders. The results were not driven by high or low outliers, and the sensitivity analysis excluding men who experienced an event within the first 12 months makes reverse causality less likely. We acknowledge several limitations of the study, including its observational nature. Men seen in W2 were drawn from the larger original cohort hence a “healthy survivor” effect may be present. We relied on a single blood sample for assay of ucOC, total osteocalcin, P1NP, and CTX, and did not have serial measurements of these markers. Outcome events were ascertained using data linkage; however, WADLS captures all hospital admissions in the state of Western Australia and few men of this age emigrate interstate or overseas (21). Some cases of stroke may have been missed had they not resulted in hospital admission, but there is no reason to suspect that this would have introduced any bias. Finally, men in the Health In Men Study are predominantly Caucasian; therefore, our results may not apply to other populations of men of differing ethnicities and we cannot comment on associations in women.
Conclusions
In older men, a lower ratio of ucOC/TOC predicted incident MI independently of conventional cardiovascular risk factors. By contrast, higher P1NP was associated with increased incidence of MI. These associations were not found with an alternative bone turnover marker, CTX, nor were they present for incident stroke. These findings identify ucOC/TOC ratio and P1NP as robust, specific, and divergent biomarkers for risk of coronary events. Further investigations are warranted to clarify whether ucOC/TOC mediates incidence of MI via the intermediary of glucose metabolism or other means and whether P1NP in this setting links bone formation to cardiovascular risk.
Acknowledgments
We thank Professor Caren Gundberg, Yale School of Medicine, for assistance in establishing the ucOC assay, and George Koumantakis and Roche Diagnostics Australia for assistance with the supply of assay kits. We thank the staff of PathWest Laboratory Medicine, Fremantle; Royal Perth and Sir Charles Gairdner Hospitals, Perth; and the Data Linkage Unit, Health Department of Western Australia for their excellent technical assistance. We thank the staff and management of Shenton Park Hospital for their support of the study. We especially thank all the men and staff who participated in the Western Australian Abdominal Aortic Aneurysm Program and the Health In Men Study.
This work was supported by a Clinical Investigator Award from the Sylvia and Charles Viertel Charitable Foundation, New South Wales, Australia (to B.B.Y.) and a Grant-in-Aid G11P 5662 from the National Heart Foundation of Australia. The Health In Men Study was funded by Project Grants 279408, 379600, 403963, 513823, 634492, 1045710, and 1060557 from the National Health and Medical Research Council of Australia. J.G. holds Practitioner Fellowship 1019921 from the National Health and Medical Research Council of Australia. The funding sources had no involvement in the planning, analysis, and writing of the manuscript.
Disclosure Summary: The authors declare no conflicts of interest.
Abbreviations
- BMI
body mass index
- CI
confidence interval
- CTX
collagen type I C-terminal cross-linked telopeptide
- CVD
cardiovascular disease
- HR
hazard ratio
- ICTP
type 1 collagen telopeptide
- MI
myocardial infarction
- P1NP
N-terminal propeptide of type I collagen
- PIIINP
amino-terminal propeptide of procollagen type III
- SD
standard deviation
- TOC
total osteocalcin
- ucOC
undercarboxylated osteocalcin
- W
wave
- WADLS
Western Australian Data Linkage System.
